REVIEW 6 minor 75 references
HETDEX [OII] galaxies at $z \le 0.48$: Volume-limited samples and their power spectra
T0 review · 0 major / 6 minor · reviewed 2026-07-13 · grok-4.5
Pith's one-line read Volume-limited HETDEX [OII] samples at z≤0.48 match flat ΛCDM mocks, with host halo masses log(M0)≈11.9–12.3 that rise weakly with luminosity.
desk verdict Solid first clustering release of high-density HETDEX [OII] volume-limited samples that match Planck-ΛCDM mocks; foundation paper, not a growth-rate result yet. read the letter →
The pith
A machine-rendered reading of the paper's core claim, the machinery that carries it, and where it could break.
The reading
What carries the argument
A single-parameter log-normal halo occupation distribution (central occupation ∝ exp[−(log Mh/M0)2/(2σlogM2)], σlogM fixed at 0.6 and Fg set to match the observed number density) applied to Uchuu halo and subhalo catalogs; the free parameter M0 is fit to the measured monopole via a Sellentin–Heavens likelihood.
What would settle it
A re-fit of the same monopoles with σlogM left free (or with a standard step-function plus satellite HOD) that yields statistically unacceptable residuals, or a direct measurement of the satellite fraction that differs significantly from the mock value of ~13 percent.
Extended reading notes
Core claim
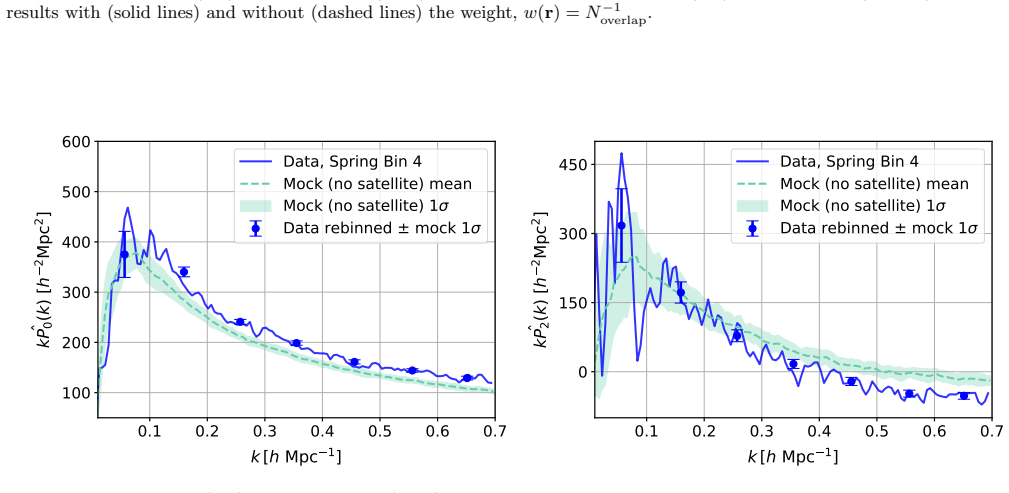
The monopole and quadrupole power spectra of three volume-limited HETDEX [OII] samples agree with Uchuu-based mocks under flat ΛCDM Planck parameters at all wavenumbers 0.01<k<0.7 h Mpc−1. The power-spectrum amplitudes are consistent with a characteristic host-halo mass log(M0 [h−1M⊙])≈11.9–12.3 that scales weakly with [OII] luminosity as M0∝La with a=0.37±0.10; the best-fit mocks place about 13 percent of the galaxies in subhalos.
Load-bearing premise
The model freezes the width of the log-normal occupation function at 0.6 by hand and uses the remaining free parameter only to match number density, so the claim that this simple form is enough rests on that fixed width remaining adequate for every luminosity bin and redshift.
Editorial extensions
If this is right
- The same samples can be used for forthcoming redshift-space-distortion analyses that constrain the late-time growth rate without photometric pre-selection systematics.
- Linear bias values b1~0.8–0.9 are now available for three luminosity bins and can be inserted into halo-model or cross-correlation forecasts with weak lensing and CMB lensing.
- The high number densities make the catalogs competitive for void statistics and for cross-correlations with external low-redshift probes.
- The measured M0–L slope supplies a concrete target for semi-analytic or hydrodynamical models of star-forming galaxies at z≤0.48.
Reading between the lines
- Because luminosity and redshift are correlated by construction in volume-limited bins, any future growth-rate measurement will need an explicit joint model of luminosity evolution and time evolution to avoid absorbing one into the other.
- The success of a pure log-normal HOD without a high-mass step function already suggests that [OII] selection at these redshifts is closer to a star-formation-rate threshold than to a stellar-mass threshold; that distinction can be tested by stacking the same galaxies on continuum mass estimates.
- If the ~13 percent subhalo fraction holds under more flexible HODs, satellite kinematics will contribute a non-negligible fraction of the small-scale quadrupole and should be forward-modelled rather than treated as a free nuisance.
Editorial analysis
A structured set of objections, weighed in public.
Referee Report
Summary. This paper constructs volume-limited samples of emission-line-selected [OII] galaxies from HETDEX PDR1 at z ≤ 0.48 in three luminosity bins across the Spring and Fall fields (N_gal from ~11k to ~65k; n-bar ≃ (2–5) imes10^{-3} h^3 Mpc^{-3}). Using a CIC-assigned FFT Yamamoto estimator with shot-noise subtraction, it measures monopole and quadrupole power spectra that agree with Uchuu mocks (Planck flat ΛCDM) at all 0.01 < k < 0.7 h Mpc^{-1}. A log-normal HOD (Eq. 11) with fixed σ_logM = 0.6 and F_g set to match n-bar yields best-fit characteristic halo masses log(M_0 [h^{-1} M_⊙]) ≃ 11.9–12.3 and a weak luminosity slope M_0 ∝ L^a with a = 0.37 ± 0.10; the mocks further imply ~13% of galaxies occupy subhalos. The samples are presented as the foundation for forthcoming RSD, galaxy–halo, and cross-correlation analyses.
Significance. The work supplies a unique high-density, untargeted spectroscopic tracer set in the low-redshift regime most sensitive to late-time growth and dark-energy effects, complementary to continuum-selected surveys (GAMA, DESI BGS). Strengths that raise include the public HPSC2 catalog, open power-spectrum pipeline, KS-validated volume-limited cuts, Sellentin–Heavens likelihood accounting for finite mocks (N_s = 50), high PTEs for both multipoles, and the fact that the quadrupole is a genuine prediction (not fitted). The demonstration that a minimal HOD already reproduces the data to k = 0.7 h Mpc^{-1} makes the samples immediately usable for cosmology and galaxy-formation studies.
minor comments (6)
- Abstract/title and several headings contain residual LaTeX spacing artifacts (e.g., “V olume-limited”, “z≤0.48”). A global clean-up of the compiled PDF is needed before final production.
- Section 4.2 / Eq. (11): the choice σ_logM = 0.6 is stated as “neither too large nor too small”; a one-sentence justification referencing prior ELG HOD literature (or a brief sensitivity plot already performed for ±0.1) would help readers assess robustness without re-running the mocks.
- Section 5.2: the conversion of M_0 to linear bias b_1 ≃ 0.8–0.9 cites the halo-model reviews but does not specify the exact mass function or bias fitting formula used. Adding the reference (or a short appendix formula) would make the numbers fully reproducible.
- Figure 5 and Appendix A: the N_overlap sky maps and the quantitative effect of the weight on P_0(k) at high k are useful; a single sentence in the main text noting that the weight changes the monopole amplitude by only a few percent would improve accessibility.
- Table 1: the effective redshifts and volumes are clear, but a column (or footnote) listing the exact KS p-values obtained for the adopted (z_min, z_max) pairs would document the volume-limited criterion more transparently.
- Section 4.2: Spring Bin 4 uses 21 slightly overlapping sub-boxes (9 % of the simulation volume). A brief remark that the resulting covariance is therefore mildly underestimated (or a test with non-overlapping boxes) would complete the error-budget discussion.
Circularity Check
Ordinary HOD amplitude fit of M0; monopole amplitude is matched by construction while shape, quadrupole, and external Planck/Uchuu cosmology remain independent tests.
-
fitted input called prediction
[Abstract; Section 5.2 Results; Eq. (11) and surrounding text]
"We find that the power spectrum amplitudes are consistent with a characteristic dark matter halo mass of log(M0 [h−1M⊙])≃11.9–12.3, with the halo mass showing a weak dependence on [OII] luminosity, M0∝La, increasing with a slope of a=0.37±0.10. ... By fixing σlogM=0.6 and the galaxy fraction, Fg, to match the observed number density of each sample, we reduced the HOD to have a single free parameter: the characteristic halo mass M0."
M0 is the sole free parameter adjusted to the monopole amplitudes of each luminosity bin; the quoted log(M0) values and the power-law slope a fitted to those values are therefore the direct numerical output of the fit, not an independent prediction. (The spectral shape across all k and the unused quadrupole remain non-circular consistency checks.)
full rationale
The paper's central results are volume-limited sample construction from HETDEX PDR1, FFT power-spectrum multipoles, and comparison to Uchuu mocks under fixed external Planck 2015 flat-ΛCDM parameters. The only free HOD parameter M0 is fitted solely to the monopole amplitude (Sellentin-Heavens likelihood on 7 k-bins); Fg is set to match the observed number density and σ_logM is fixed by hand at 0.6 (with a ±0.1 robustness check). Consequently the reported log(M0) values and the subsequent power-law slope a = 0.37 ± 0.10 are direct outputs of that fit rather than independent predictions. This is the ordinary level of any HOD amplitude analysis and does not rise to definitional circularity: the full k-dependence of the monopole, the quadrupole (never used in the fit), the subhalo fraction, and the agreement with an external N-body cosmology are genuine, non-forced tests. No self-definitional loop, no load-bearing self-citation uniqueness theorem, and no smuggled ansatz appear. Score 2 reflects only the mild fitted-input reporting of halo masses.
Assumptions & free parameters
free parameters (3)
- M0 (characteristic halo mass per luminosity bin) =
log(M0/h−1M⊙) ≈ 11.94–12.32 depending on bin/field
- σ_logM (HOD width) =
0.6 (fixed)
- Fg (galaxy fraction) =
0.37–0.64 depending on bin
assumptions (4)
- domain assumption Flat ΛCDM cosmology with Planck 2015/2018 parameters (Ωm=0.3089, σ8=0.8159, etc.) correctly describes the matter power spectrum at z≤0.48.
- domain assumption A log-normal central occupation (Geach et al. 2012 form without the error-function term) plus subhalo population is an adequate description of [OII] galaxy occupation.
- ad hoc to paper Two-sample KS p>0.05 between data and random redshift distributions guarantees a sufficiently volume-limited sample for clustering analysis.
- domain assumption Sparse IFU sampling (fill factor ~1/4.6) does not introduce significant window-function bias once the grid cell is larger than the IFU separation.
Cite this review
Pith. "Pith review of HETDEX [OII] galaxies at $z \le 0.48$: Volume-limited samples and their power spectra." pith.science (2026). https://pith.science/paper/VVK6UNIR
@misc{pith2026260708453,
  author       = {Pith},
  title        = {Pith review of: HETDEX [OII] galaxies at $z \le 0.48$: Volume-limited samples and their power spectra},
  year         = {2026},
  howpublished = {\url{https://pith.science/paper/VVK6UNIR}},
  note         = {Machine review of arXiv:2607.08453}
}
abstract
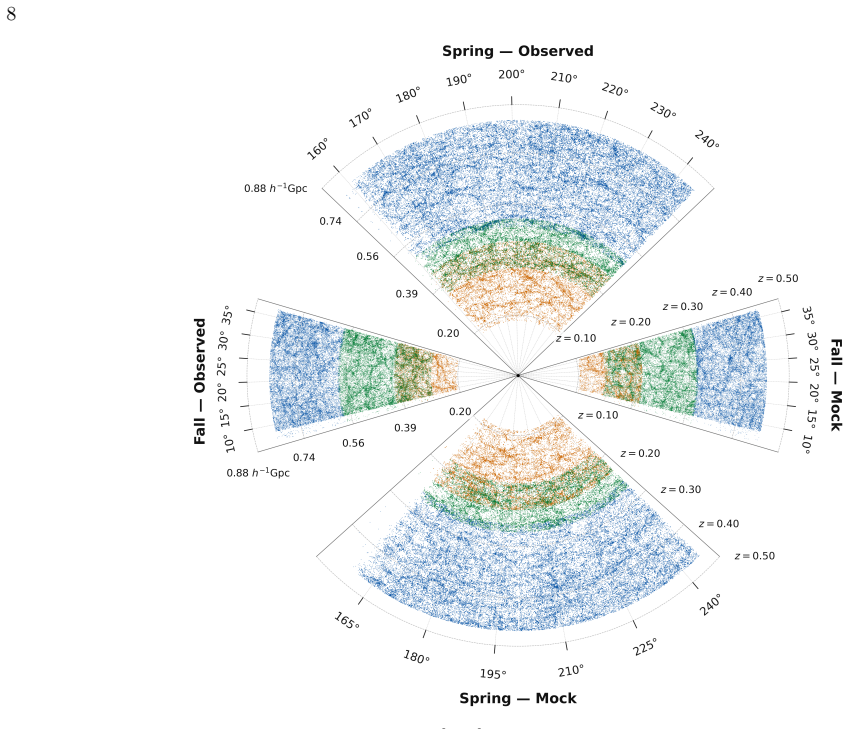
The catalog from the Hobby-Eberly Telescope Dark Energy Experiment (HETDEX) Public Data Release 1 (PDR1) contains half a million emission-line-selected [OII] galaxies spread across $540~\mathrm{deg}^2$ at $z \le 0.48$ from HETDEX's unprecedented untargeted spectroscopic survey. In this paper, we construct volume-limited samples from PDR1 in three luminosity bins across the two main fields: "Spring'' and "Fall''. The numbers of galaxies in the bins range from 11,354 to 64,794 and number densities, $\bar{n}\simeq (2-5)\times10^{-3}~h^3~\mathrm{Mpc}^{-3}$, are higher than those of typical cosmological spectroscopic surveys of emission-line galaxies by a factor of five to ten. The monopole and quadrupole power spectra derived from these samples are in excellent agreement with the mock power spectra from the Uchuu simulation based on a flat $\Lambda$CDM model and the cosmological parameters from the Planck cosmic microwave background data, at all wavenumbers used for the measurement ($0.01<k<0.7~h~\mathrm{Mpc}^{-1}$). We find that the power spectrum amplitudes are consistent with a characteristic dark matter halo mass of $\log(M_0~[h^{-1}M_{\odot}])\simeq 11.9$-$12.3$, with the halo mass showing a weak dependence on [OII] luminosity, $M_0\propto L^a$, increasing with a slope of $a = 0.37\pm0.10$. The best-fit mock suggests that approximately 13 percent of the [OII] galaxies in our sample reside in subhalos. The new, high-density tracers of the underlying matter distribution presented in this paper provide precise measurements of clustering in a low-redshift regime sensitive to the late-time growth of structures. These samples will form the basis for forthcoming analyses of the redshift-space distortion effect, galaxy-halo connection, and cross-correlations with external low-redshift probes.
Figures


Figures from the paper (13 more)


Reference graph
Works this paper leans on
-
[1]
Abdalla, E., Abell´ an, G. F., Aboubrahim, A., et al. 2022, Journal of High Energy Astrophysics, 34, 49, doi: 10.1016/j.jheap.2022.04.002 Abdul Karim, M., Aguilar, J., Ahlen, S., et al. 2025, PhRvD, 112, 083515, doi: 10.1103/tr6y-kpc6
-
[2]
Hopkins, A. M. 2021a, MNRAS, 503, 59, doi: 10.1093/mnras/stab409
-
[3]
2020, MNRAS, 497, 581, doi: 10.1093/mnras/staa1956
Comparat, J. 2020, MNRAS, 497, 581, doi: 10.1093/mnras/staa1956
-
[4]
2017, MNRAS, 470, 2617, doi: 10.1093/mnras/stx721
Alam, S., Ata, M., Bailey, S., et al. 2017, MNRAS, 470, 2617, doi: 10.1093/mnras/stx721
-
[5]
2021b, PhRvD, 103, 083533, doi: 10.1103/PhysRevD.103.083533 20
Alam, S., Aubert, M., Avila, S., et al. 2021b, PhRvD, 103, 083533, doi: 10.1103/PhysRevD.103.083533 20
-
[6]
Anderson, T. W. 2003, An Introduction to Multivariate Statistical Analysis, 3rd edn. (Hoboken, NJ: Wiley-Interscience)
2003
-
[7]
Asgari, M., Mead, A. J., & Heymans, C. 2023, The Open Journal of Astrophysics, 6, 39, doi: 10.21105/astro.2303.08752
-
[8]
2023, MNRAS, 519, 1648, doi: 10.1093/mnras/stac3514
Aung, H., Nagai, D., Klypin, A., et al. 2023, MNRAS, 519, 1648, doi: 10.1093/mnras/stac3514
Show all 75 references
-
[9]
G., et al
Avila, S., Gonzalez-Perez, V., Mohammad, F. G., et al. 2020, MNRAS, 499, 5486, doi: 10.1093/mnras/staa2951
2020 doi
-
[10]
H., Hearin, A
Behroozi, P., Wechsler, R. H., Hearin, A. P., & Conroy, C. 2019, MNRAS, 488, 3143, doi: 10.1093/mnras/stz1182
2019 doi
-
[11]
S., Conroy, C., & Wechsler, R
Behroozi, P. S., Conroy, C., & Wechsler, R. H. 2010, ApJ, 717, 379, doi: 10.1088/0004-637X/717/1/379
2010 doi
-
[12]
Bianchi, D., Gil-Mar´ ın, H., Ruggeri, R., & Percival, W. J. 2015, MNRAS, 453, L11, doi: 10.1093/mnrasl/slv090
2015 doi
-
[13]
A., Beutler, F., et al
Blake, C., Kazin, E. A., Beutler, F., et al. 2011, MNRAS, 418, 1707, doi: 10.1111/j.1365-2966.2011.19592.x
2011 doi
-
[14]
2013, JCAP, 2013, 030, doi: 10.1088/1475-7516/2013/12/030
Chiang, C.-T., Wullstein, P., Jeong, D., et al. 2013, JCAP, 2013, 030, doi: 10.1088/1475-7516/2013/12/030
2013 doi
-
[15]
J., et al
Ciardullo, R., Gronwall, C., Adams, J. J., et al. 2013, ApJ, 769, 83, doi: 10.1088/0004-637X/769/1/83
2013 doi
-
[16]
2026, A&A Rv, 34, 1, doi: 10.1007/s00159-026-00166-x
Contarini, S., Verza, G., & Pisani, A. 2026, A&A Rv, 34, 1, doi: 10.1007/s00159-026-00166-x
2026 doi
-
[17]
2002, PhR, 372, 1, doi: 10.1016/S0370-1573(02)00276-4
Cooray, A., & Sheth, R. 2002, PhR, 372, 1, doi: 10.1016/S0370-1573(02)00276-4
2002 doi
-
[18]
2023, PhRvD, 108, 123519, doi: 10.1103/PhysRevD.108.123519
Dalal, R., Li, X., Nicola, A., et al. 2023, PhRvD, 108, 123519, doi: 10.1103/PhysRevD.108.123519
2023 doi
-
[19]
M., et al
Davis, D., Gebhardt, K., Cooper, E. M., et al. 2023, ApJ, 946, 86, doi: 10.3847/1538-4357/acb0ca de Mattia, A., Ruhlmann-Kleider, V., Raichoor, A., et al. 2021, MNRAS, 501, 5616, doi: 10.1093/mnras/staa3891
2023 doi
-
[20]
2007, ApJL, 671, L101, doi: 10.1086/524950 DES Collaboration, Abbott, T
Deng, X.-F., He, J.-Z., & Jiang, P. 2007, ApJL, 671, L101, doi: 10.1086/524950 DES Collaboration, Abbott, T. M. C., Aguena, M., et al. 2026, arXiv e-prints, arXiv:2602.10065, doi: 10.48550/arXiv.2602.10065
2007 doi
-
[21]
2018, Physics Reports, 733, 1, doi: 10.1016/j.physrep.2017.12.002 Dong-P´ aez, C
Desjacques, V., Jeong, D., & Schmidt, F. 2018, Physics Reports, 733, 1, doi: 10.1016/j.physrep.2017.12.002 Dong-P´ aez, C. A., Smith, A., Szewciw, A. O., et al. 2024, MNRAS, 528, 7236, doi: 10.1093/mnras/stae062
2018 doi
-
[22]
P., Hill, D
Driver, S. P., Hill, D. T., Kelvin, L. S., et al. 2011, MNRAS, 413, 971, doi: 10.1111/j.1365-2966.2010.18188.x Euclid Collaboration, Mellier, Y., Abdurro’uf, et al. 2025, A&A, 697, A1, doi: 10.1051/0004-6361/202450810
2011 doi
-
[23]
J., Cole, S., Norberg, P., et al
Farrow, D. J., Cole, S., Norberg, P., et al. 2015, MNRAS, 454, 2120, doi: 10.1093/mnras/stv2075
2015 doi
-
[24]
2026, ApJ, 1002, 90, doi: 10.3847/1538-4357/ae592a
Favole, G., Kitaura, F.-S., Hadzhiyska, B., et al. 2026, ApJ, 1002, 90, doi: 10.3847/1538-4357/ae592a
2026 doi
-
[25]
A., Comparat, J., et al
Favole, G., Rodr´ ıguez-Torres, S. A., Comparat, J., et al. 2017, MNRAS, 472, 550, doi: 10.1093/mnras/stx1980
2017 doi
-
[26]
2016, MNRAS, 461, 3421, doi: 10.1093/mnras/stw1483
Favole, G., Comparat, J., Prada, F., et al. 2016, MNRAS, 461, 3421, doi: 10.1093/mnras/stw1483
2016 doi
-
[27]
A., Kaiser, N., & Peacock, J
Feldman, H. A., Kaiser, N., & Peacock, J. A. 1994, ApJ, 426, 23, doi: 10.1086/174036
1994 doi
-
[28]
P., Gui, S., et al
Gao, H., Jing, Y. P., Gui, S., et al. 2023, ApJ, 954, 207, doi: 10.3847/1538-4357/ace90a
2023 doi
-
[29]
E., Sobral, D., Hickox, R
Geach, J. E., Sobral, D., Hickox, R. C., et al. 2012, MNRAS, 426, 679, doi: 10.1111/j.1365-2966.2012.21725.x
2012 doi
-
[30]
2021, ApJ, 923, 217, doi: 10.3847/1538-4357/ac2e03
Gebhardt, K., Mentuch Cooper, E., Ciardullo, R., et al. 2021, ApJ, 923, 217, doi: 10.3847/1538-4357/ac2e03
2021 doi
-
[31]
2018, MNRAS, 474, 4024, doi: 10.1093/mnras/stx2807
Gonzalez-Perez, V., Comparat, J., Norberg, P., et al. 2018, MNRAS, 474, 4024, doi: 10.1093/mnras/stx2807
2018 doi
-
[32]
J., Ruiz-Macias, O., et al
Hahn, C., Wilson, M. J., Ruiz-Macias, O., et al. 2023, AJ, 165, 253, doi: 10.3847/1538-3881/accff8
2023 doi
-
[33]
2017, JCAP, 2017, 002, doi: 10.1088/1475-7516/2017/07/002
Hand, N., Li, Y., Slepian, Z., & Seljak, U. 2017, JCAP, 2017, 002, doi: 10.1088/1475-7516/2017/07/002
2017 doi
-
[34]
J., Lee, H., MacQueen, P
Hill, G. J., Lee, H., MacQueen, P. J., et al. 2021, AJ, 162, 298, doi: 10.3847/1538-3881/ac2c02
2021 doi
-
[35]
W., & Eastwood, J
Hockney, R. W., & Eastwood, J. W. 1988, Computer simulation using particles (CRC Press)
1988
-
[36]
A., et al
Ishiyama, T., Prada, F., Klypin, A. A., et al. 2021, MNRAS, 506, 4210, doi: 10.1093/mnras/stab1755
2021 doi
-
[37]
1997, ApJ, 484, 560, doi: 10.1086/304372 Jim´ enez, E., Padilla, N., Contreras, S., et al
Jain, B., & Seljak, U. 1997, ApJ, 484, 560, doi: 10.1086/304372 Jim´ enez, E., Padilla, N., Contreras, S., et al. 2021, MNRAS, 506, 3155, doi: 10.1093/mnras/stab1819
1997 doi
-
[38]
Jing, Y. P. 2005, ApJ, 620, 559, doi: 10.1086/427087
2005 doi
-
[39]
2013, ApJ, 768, 51, doi: 10.1088/0004-637X/768/1/51
Kajisawa, M., Shioya, Y., Aida, Y., et al. 2013, ApJ, 768, 51, doi: 10.1088/0004-637X/768/1/51
2013 doi
-
[40]
C., & Evans, N
Kennicutt, R. C., & Evans, N. J. 2012, ARA&A, 50, 531, doi: 10.1146/annurev-astro-081811-125610
2012 doi
-
[41]
Kennicutt, Jr., R. C. 1998, ApJ, 498, 541, doi: 10.1086/305588
1998 doi
-
[42]
A., Sobral, D., Mobasher, B., et al
Khostovan, A. A., Sobral, D., Mobasher, B., et al. 2018, MNRAS, 478, 2999, doi: 10.1093/mnras/sty925
2018 doi
-
[43]
V., Berlind, A
Kravtsov, A. V., Berlind, A. A., Wechsler, R. H., et al. 2004, ApJ, 609, 35, doi: 10.1086/420959
2004 doi
-
[44]
K., Driver, S
Liske, J., Baldry, I. K., Driver, S. P., et al. 2015, MNRAS, 452, 2087, doi: 10.1093/mnras/stv1436 Mentuch Cooper, E., Gebhardt, K., Davis, D., et al. 2023, ApJ, 943, 177, doi: 10.3847/1538-4357/aca962 Mentuch Cooper, E., Gebhardt, K., Davis, D., et al. 2026, ApJS, 284, 67, do...
2015 doi
-
[45]
J., & White, S
Mo, H. J., & White, S. D. M. 1996, MNRAS, 282, 347, doi: 10.1093/mnras/282.2.347
1996 doi
-
[46]
2023, PhRvL, 131, 111001, doi: 10.1103/PhysRevLett.131.111001 21
Nguyen, N.-M., Huterer, D., & Wen, Y. 2023, PhRvL, 131, 111001, doi: 10.1103/PhysRevLett.131.111001 21
2023 doi
-
[47]
M., Hawkins, E., et al
Norberg, P., Baugh, C. M., Hawkins, E., et al. 2001, MNRAS, 328, 64, doi: 10.1046/j.1365-8711.2001.04839.x
2001 doi
-
[48]
2021, PASJ, 73, 1186, doi: 10.1093/pasj/psab068
Okumura, T., Hayashi, M., Chiu, I.-N., et al. 2021, PASJ, 73, 1186, doi: 10.1093/pasj/psab068
2021 doi
-
[49]
2023, MNRAS, 525, 3879, doi: 10.1093/mnras/stad2401
Oogi, T., Ishiyama, T., Prada, F., et al. 2023, MNRAS, 525, 3879, doi: 10.1093/mnras/stad2401
2023 doi
-
[50]
2025, A&A, 697, A226, doi: 10.1051/0004-6361/202453086
Chaves-Montero, J. 2025, A&A, 697, A226, doi: 10.1051/0004-6361/202453086
2025 doi
- [51]
-
[52]
2023, MNRAS, 519, 1771, doi: 10.1093/mnras/stac3582
Osato, K., & Okumura, T. 2023, MNRAS, 519, 1771, doi: 10.1093/mnras/stac3582
2023 doi
-
[53]
P., et al
Pakmor, R., Springel, V., Coles, J. P., et al. 2023, MNRAS, 524, 2539, doi: 10.1093/mnras/stad2027
2023 doi
-
[54]
J., Friedrich, O., Sellentin, E., & Heavens, A
Percival, W. J., Friedrich, O., Sellentin, E., & Heavens, A. 2022, MNRAS, 510, 3207, doi: 10.1093/mnras/stab3540
2022 doi
-
[55]
Philcox, O. H. E., & Ivanov, M. M. 2022, PhRvD, 105, 043517, doi: 10.1103/PhysRevD.105.043517 Planck Collaboration, Ade, P. A. R., Aghanim, N., et al. 2016, A&A, 594, A13, doi: 10.1051/0004-6361/201525830 Planck Collaboration, Aghanim, N., Akrami, Y., et al. 2020, A&A, 641, A6...
2022 doi
- [56]
-
[57]
J., Hang, Q., Farren, G., et al
Qu, F. J., Hang, Q., Farren, G., et al. 2025, PhRvD, 111, 103503, doi: 10.1103/PhysRevD.111.103503
2025 doi
-
[58]
W., Adams, M
Ramsey, L. W., Adams, M. T., Barnes, T. G., et al. 1998, in Society of Photo-Optical Instrumentation Engineers (SPIE) Conference Series, Vol. 3352, Advanced Technology Optical/IR Telescopes VI, ed. L. M. Stepp, 34–42, doi: 10.1117/12.319287
1998 doi
-
[59]
2025, MNRAS, 539, 3627, doi: 10.1093/mnras/staf700
Said, K., Howlett, C., Davis, T., et al. 2025, MNRAS, 539, 3627, doi: 10.1093/mnras/staf700
2025 doi
-
[60]
2015, PhRvD, 92, 083532, doi: 10.1103/PhysRevD.92.083532
Scoccimarro, R. 2015, PhRvD, 92, 083532, doi: 10.1103/PhysRevD.92.083532
2015 doi
-
[61]
Sellentin, E., & Heavens, A. F. 2016, MNRAS, 456, L132, doi: 10.1093/mnrasl/slv190
2016 doi
-
[62]
Springel, V., White, S. D. M., Jenkins, A., et al. 2005, Nature, 435, 629, doi: 10.1038/nature03597
2005 doi
-
[63]
2012, MNRAS, 423, 2617, doi: 10.1111/j.1365-2966.2012.21063.x
Tadaki, K.-i., Kodama, T., Ota, K., et al. 2012, MNRAS, 423, 2617, doi: 10.1111/j.1365-2966.2012.21063.x
2012 doi
-
[64]
S., Chiba, M., et al
Takada, M., Ellis, R. S., Chiba, M., et al. 2014, PASJ, 66, R1, doi: 10.1093/pasj/pst019
2014 doi
-
[65]
R., Strauss, M
Tegmark, M., Blanton, M. R., Strauss, M. A., et al. 2004, ApJ, 606, 702, doi: 10.1086/382125
2004 doi
-
[66]
2014, A&A, 566, A1, doi: 10.1051/0004-6361/201423585
Tempel, E., Tamm, A., Gramann, M., et al. 2014, A&A, 566, A1, doi: 10.1051/0004-6361/201423585
2014 doi
-
[67]
L., Robertson, B
Tinker, J. L., Robertson, B. E., Kravtsov, A. V., et al. 2010, ApJ, 724, 878, doi: 10.1088/0004-637X/724/2/878
2010 doi
-
[68]
Vale, A., & Ostriker, J. P. 2004, MNRAS, 353, 189, doi: 10.1111/j.1365-2966.2004.08059.x
2004 doi
-
[69]
2024, JCAP, 2024, 044, doi: 10.1088/1475-7516/2024/09/044
Wang, Y., & Yu, Y. 2024, JCAP, 2024, 044, doi: 10.1088/1475-7516/2024/09/044
2024 doi
-
[70]
2022, ApJ, 928, 1, doi: 10.3847/1538-4357/ac4973
Wang, Y., Zhai, Z., Alavi, A., et al. 2022, ApJ, 928, 1, doi: 10.3847/1538-4357/ac4973
2022 doi
-
[71]
H., St¨ olzner, B., Asgari, M., et al
Wright, A. H., St¨ olzner, B., Asgari, M., et al. 2025, A&A, 703, A158, doi: 10.1051/0004-6361/202554908
2025 doi
-
[72]
A., & Nishioka, H
Yamamoto, K., Nakamichi, M., Kamino, A., Bassett, B. A., & Nishioka, H. 2006, PASJ, 58, 93, doi: 10.1093/pasj/58.1.93
2006 doi
-
[73]
H., Wang, Y., et al
Yuan, S., Wechsler, R. H., Wang, Y., et al. 2025, MNRAS, 538, 1216, doi: 10.1093/mnras/staf368
2025 doi
-
[74]
R., Frieman, J
Zehavi, I., Blanton, M. R., Frieman, J. A., et al. 2002, ApJ, 571, 172, doi: 10.1086/339893
2002 doi
-
[75]
A., Weinberg, D
Zheng, Z., Berlind, A. A., Weinberg, D. H., et al. 2005, ApJ, 633, 791, doi: 10.1086/466510 22 160180200220240 R.A.[deg] 46 48 50 52 54 56Dec.[deg] N1 = 59195 N2 = 4562 N3 = 461 N4 = 42 N5 = 13 5101520253035 R.A.[deg] 2 1 0 1 2 Dec.[deg] N1 = 25386 N2 = 1885 N3 = 129 N4 = 3 Fi...
2005 doi
Reviewed July 13, 2026 · model on record in the stance chip above.
Discussion (0). Sign in to comment.