REVIEW 2 major objections 5 minor 58 references
Physics-Informed Neural Networks for the High-Resolution Reconstruction of Flow Measurement Indicators in Fluid Dynamics
T0 review · 2 major / 5 minor · reviewed 2026-07-14 · grok-4.5
Pith's one-line read Physics-informed neural networks turn sparse, noisy blood-flow velocity measurements into high-resolution velocity, pressure and wall-shear-stress fields that match ground truth better than pure CFD or pure data fitting.
desk verdict Solid engineering of a PINN pipeline for sparse flow data; the quasi-steady residual is a real but already-flagged soft spot that does not erase the FDA gains or the transparent ablations. read the letter →
The pith
A machine-rendered reading of the paper's core claim, the machinery that carries it, and where it could break.
The reading
What carries the argument
The composite PINN loss: mean-squared and mean-squared-logarithmic residuals of mass and momentum conservation, boundary-condition residuals, plus data fidelity terms on velocity magnitude and direction; pressure is recovered a posteriori from the momentum residual without ever being supplied as training data.
What would settle it
Train the same PINN architecture on a fully time-resolved, high-resolution ground-truth CFD solution of the aneurysm (including the unsteady term) and check whether the reconstructed wall-shear-stress and enstrophy time series still match the ground truth within the error levels reported for the quasi-steady runs.
Extended reading notes
Core claim
Embedding the steady incompressible Navier–Stokes residuals directly into the training loss of a neural network allows sparse experimental velocity samples (PIV or 4D flow MRI) to be reconstructed into high-resolution velocity, pressure and wall-shear-stress fields that agree more closely with ground-truth observations than either classical CFD or pure data-driven fitting.
Load-bearing premise
Treating the Navier–Stokes equations as quasi-steady (no time derivative) still yields accurate reconstructions for pulsatile aneurysm flow when only a few discrete time snapshots are given to the network.
Editorial extensions
If this is right
- Sparse 4D flow MRI acquisitions can be upgraded to clinically usable wall-shear-stress and pressure maps without additional imaging time.
- Pressure, never measured by phase-contrast MRI, becomes available as a free by-product of the physics residual.
- Mesh generation and geometry segmentation steps required by classical CFD can be skipped for post-processing of clinical velocity data.
- The same loss construction can be reused on other under-resolved experimental modalities (PIV, Doppler ultrasound) once fluid properties and approximate boundary locations are known.
Reading between the lines
- If the quasi-steady approximation holds for moderate pulsatility, the method could be applied frame-by-frame to full cardiac-cycle 4D flow MRI without enlarging the network architecture.
- Automatic balancing of the multi-term loss (rather than manual weight selection) would be the next practical step before routine clinical use.
- Extending the residual to include a simple turbulence model or the unsteady term would test whether the same framework remains competitive in transitional or highly unsteady regimes.
Editorial analysis
A structured set of objections, weighed in public.
Referee Report
Summary. The manuscript proposes a PINN framework that embeds the incompressible Navier–Stokes residuals (Eqs. 1–3, 6–7) together with sparse velocity measurements into a composite loss (Eq. 5) to reconstruct high-resolution velocity, pressure and wall-shear-stress fields from under-resolved experimental data. Two benchmarks are examined: the laminar FDA nozzle (Re = 500), trained and tested against both FEM solutions and PIV measurements (FDA-CFD 1–7, FDA-EXP 1–3), and a patient-derived aneurysm model (Re ≈ 1500) trained on FEM snapshots and on in-vitro 4D-flow MRI (AN-CFD, AN-4DMRI weight sweeps). Systematic ablations of loss weights, MSLE terms, unit-vector losses and collocation density are reported, together with quantitative error metrics (Ez, Eu, kinetic energy, enstrophy) and visual comparisons of velocity, pressure, vorticity and WSS. The central claim is that the data–physics synergy yields reconstructions closer to ground truth than pure CFD or pure data-driven baselines.
Significance. If the claimed superiority holds, the work supplies a practical, mesh-free post-processing pipeline that can recover pressure and wall shear stress from sparse 4D-flow MRI or PIV without full CFD personalization. The multi-configuration ablations (Tables 2–5), explicit residual definitions, and dual validation against both FEM and experimental data constitute a reproducible demonstration of PINN utility for hemodynamic indicators. The FDA-nozzle results in particular are carefully controlled and already of interest to the validation community. The aneurysm application, while more ambitious, remains limited by the quasi-steady residual assumption that the authors themselves flag.
major comments (2)
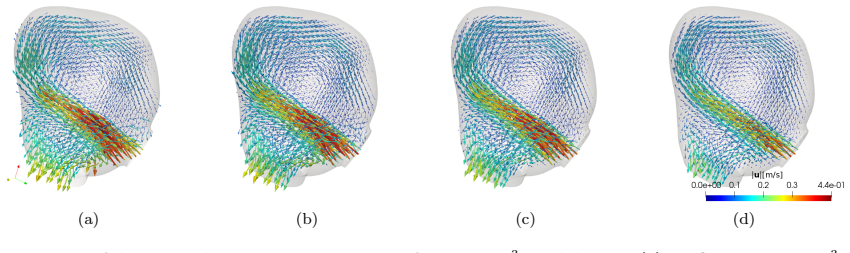
- [§3.2.1, §3.2.2, §4.1] §3.2.1 and §3.2.2 (and Limitations §4.1): for the aneurysm the physics residual L_PDE is the steady form of the Navier–Stokes equations (Eqs. 1a–b, 2a–b) evaluated at isolated fixed times (t = 2.024 s for FEM; discrete snapshots for 4D-flow). The unsteady term ∂u/∂t is therefore omitted even though the inflow is pulsatile (Fig. 13b) and Re ≈ 1500. No residual-magnitude comparison or full-unsteady PINN control is supplied. Because the abstract and §4 assert superiority over CFD and pure data-driven methods for this more complex case, the quasi-steady assumption is load-bearing; either a quantitative check of the neglected acceleration term or a clear restriction of the superiority claim to the steady FDA nozzle is required.
- [Abstract, §4, Table 5] Abstract and §4 claim that PINN results “align more closely with ground truth … than standard CFD or pure data-driven approaches.” For the aneurysm the only pure-data control is AN-4DMRI-4 (Table 5, PDE weights set to zero). No corresponding pure-data ablation is reported for the FDA-EXP series, and the CFD baselines are themselves subject to modeling choices (VMS-LES, mesh, boundary conditions). A single, consistently defined pure-data baseline for both benchmarks would make the superiority statement falsifiable.
minor comments (5)
- [Table 1] Table 1 lists three different characteristic diameters and viscosities; a short sentence clarifying which length scale is used for the aneurysm Re would avoid ambiguity.
- [Eq. (11), Figs. 8d, 11c, 23] Eq. (11) defines WSS; the subsequent wall-averaged plots (Figs. 8d, 11c, 23) would be clearer if the averaging surface and the precise post-processing library (nisaba vs. Paraview) were stated once in the methods.
- [Figs. 7, 22] Several figures (e.g., Fig. 7 residual maps, Fig. 22 vorticity) use log-scale color bars without explicit units or reference values; adding a common color-bar range across panels would aid comparison.
- [Eqs. (6), (9)] The MSLE terms in Eqs. (6) and (9) are introduced without a reference or a short derivation of the +1 offset; a one-sentence justification would help readers unfamiliar with the device.
- [Graphical abstract, figure captions] Typographical inconsistencies appear in the graphical abstract (“Weusephysics-informed…”) and in a few figure captions; a final proof-reading pass is needed.
Circularity Check
No load-bearing circularity; PINN reconstructions are validated against held-out sections and independent external PIV/4D-flow-MRI data, with only a minor non-forcing self-citation of the authors' CFD solver for in-silico verification data.
-
self citation load bearing
[§3.1.1 Setup and §3.2.1 Setup (lifeX citations [41,42])]
"We perform the simulations using lifeX [41, 42], a high-performance solver of multiphysics and multiscale differential models developed at the MOX laboratory of Politecnico di Milano. ... We carry out the FEM simulations using lifeX [41]."
lifeX is the authors' own code; it supplies the in-silico velocity/pressure fields used for the FDA-CFD and ANE-CFD verification cases. This is ordinary self-citation for data generation and is not load-bearing: the paper's central claims rest on the experimental PIV and 4D-flow-MRI validations that are independent of lifeX.
full rationale
The paper's derivation chain is the standard PINN construction: residual of the (quasi-steady) incompressible Navier-Stokes equations (Eqs. 1-3, 6-7) plus data-fidelity terms (Eqs. 8-9) minimized over network parameters. The residuals are the classical continuum equations, not defined in terms of the reconstructed fields or fitted weights. Training uses sparse velocity samples on selected cross-sections; testing and comparison use held-out sections plus independent FEM solutions and external experimental PIV (FDA) and 4D-flow-MRI (aneurysm) acquisitions that were never used to define the architecture or loss. Pressure and WSS are recovered a posteriori from the trained velocity via the momentum residual and Eq. 11; they are not fitted inputs re-labeled as predictions. The sole self-citation of note is lifeX (authors' own FEM library) used solely to generate the in-silico verification datasets of Sections 3.1.1 and 3.2.1; the central empirical claim of superiority over pure CFD or pure data-driven baselines is supported by the external experimental comparisons (Figs. 10-12, 20-24, Tables 3-6) and does not reduce to that citation. Hyper-parameter weights are chosen by trial-and-error and reported; they do not force the reported accuracy gains by construction. The quasi-steady modeling choice is a limitation (explicitly listed in §4.1), not a circularity. Hence the score is 1 (minor non-load-bearing self-citation) rather than 0.
Assumptions & free parameters
free parameters (3)
- loss weights λ_u, λ_PDE,j, λ_BC,j, λ_û, λ_p̄, λ_MSLE
- number of neurons per layer (16 vs 32) and PDE collocation density
- MSLE inclusion flag and unit-vector loss weight
assumptions (3)
- domain assumption Blood obeys the steady incompressible Newtonian Navier-Stokes equations with the given Re, density and viscosity (Eqs. 1–2, Table 1).
- ad hoc to paper Time derivatives may be omitted from the momentum residual when training on discrete 4D-flow snapshots (quasi-steady assumption, §3.2.1).
- domain assumption No-slip wall residual plus zero-mean pressure penalty suffice to recover unique pressure when Neumann data are unavailable.
Cite this review
Pith. "Pith review of Physics-Informed Neural Networks for the High-Resolution Reconstruction of Flow Measurement Indicators in Fluid Dynamics." pith.science (2026). https://pith.science/paper/XXAW7GBZ
@misc{pith2026260711576,
  author       = {Pith},
  title        = {Pith review of: Physics-Informed Neural Networks for the High-Resolution Reconstruction of Flow Measurement Indicators in Fluid Dynamics},
  year         = {2026},
  howpublished = {\url{https://pith.science/paper/XXAW7GBZ}},
  note         = {Machine review of arXiv:2607.11576}
}
read the original abstract
Accurate, spatially resolved flow field measurements are essential for the reliable assessment of hemodynamic quantities in cardiovascular research and clinical practice. Experimental techniques, such as 4D flow MRI, PIV, or Doppler ultrasound, often yield data that are sparse, noisy, or under-resolved, particularly near vessel walls and in regions of complex flow. This limits the fidelity of distributed or derived hemodynamic indicators such as the wall shear stress and the clinical utility of such measurements. To address these challenges, we propose a physics-informed neural network (PINN) framework that integrates the incompressible Navier-Stokes equations with velocity measurements coming from experimental flow field data. By embedding physical laws into data, PINN enhances the reconstruction of velocity fields, enables the estimation of unmeasured quantities such as pressure and wall shear stress, and improves the spatial resolution of hemodynamic indicators. We show the effectiveness of our approach using both in silico and experimental data. First, we apply our method to the FDA nozzle benchmark, leveraging both control particle image velocimetry (PIV) measurements and computational fluid dynamics (CFD) simulations. Next, we apply our method to the more complex case of blood flow in an aneurysm model, exploiting in vitro 4D flow MRI data. In both cases, the synergy between data-driven learning and physics-based regularization yields results that align more closely with ground truth observations than standard CFD or pure data-driven approaches. Our findings highlight the potential of PINNs to improve the fidelity of under-resolved flow field measurements and yield spatially resolved hemodynamic indicators.
Figures


Figures from the paper (21 more)




Reference graph
Works this paper leans on
-
[1]
Stankovic, B
Z. Stankovic, B. D. Allen, J. Garcia, K. B. Jarvis, M. Markl, 4D flow imaging with MRI, Cardiovascular Diagnosis and Therapy 4 (2014) 173
2014
-
[2]
Miyazaki, K
S. Miyazaki, K. Itatani, T. Furusawa, T. Nishino, M. Sugiyama, Y. Takehara, S. Yasukochi, Validation of numerical simulation methods in aortic arch using 4D Flow MRI, Heart and Vessels 32 (2017) 1032–1044
2017
-
[3]
Sughimoto, Y
K. Sughimoto, Y. Shimamura, C. Tezuka, K. Tsubota, H. Liu, K. Okumura, Y. Masuda, H. Haneishi, Effects of arterial blood flow on walls of the abdominal aorta: distributions of wall shear stress and oscillatory shear index determined by phase-contrast magnetic resonance imaging, Heart and Vessels 31 (2016) 1168–1175
2016
-
[4]
Markl, A
M. Markl, A. Frydrychowicz, S. Kozerke, M. Hope, O. Wieben, 4D flow MRI, Journal of Magnetic Resonance Imaging 36 (2012) 1015–1036
2012
-
[5]
Casas, J
B. Casas, J. Lantz, P. Dyverfeldt, T. Ebbers, 4D flow MRI-based pressure loss estimation in stenotic flows: Evaluation using numerical simulations, Magnetic Resonance in medicine 75 (2016) 1808–1821
2016
-
[6]
H. Baek, M. V. Jayaraman, G. E. Karniadakis, Wall shear stress and pressure distribution on aneurysms and infundibulae in the posterior communicating artery bifurcation, Annals of Biomedical Engineering 37 (2009) 2469–2487
2009
-
[7]
C. G. Caro, Discovery of the role of wall shear in atherosclerosis, Arteriosclerosis, Thrombosis, and Vascular Biology 29 (2009) 158–161
2009
-
[8]
Zingaro, L
A. Zingaro, L. Dedè, F. Menghini, A. Quarteroni, Hemodynamics of the heart’s left atrium based on a Variational Multiscale-LES numerical method, European Journal of Mechanics-B/Fluids 89 (2021) 380–400
2021
Show all 58 references
-
[9]
A. Harloff, et al., 3D blood flow characteristics in the carotid artery bifurcation assessed by flow- sensitive 4D MRI at 3T, Magnetic Resonance in Medicine: An Official Journal of the International Society for Magnetic Resonance in Medicine 61 (2009) 65–74
2009
-
[10]
M. T. Ngo, C. I. Kim, J. Jung, G. H. Chung, D. H. Lee, H. S. Kwak, Four-dimensional flow magnetic resonance imaging for assessment of velocity magnitudes and flow patterns in the human carotid artery bifurcation: Comparison with computational fluid dynamics, Diagnostics 9 (2019) 223
2019
-
[11]
M. S. Pravdivtseva, F. Gaidzik, P. Berg, P. Ulloa, N. Larsen, O. Jansen, J.-B. Hövener, M. Salehi Ravesh, Influence of spatial resolution and compressed sense acceleration factor on flow quantification with 4D Flow MRI at 3 Tesla, Tomography 8 (2022) 457–478
2022
-
[12]
Zingaro, I
A. Zingaro, I. Fumagalli, L. Dede’, M. Fedele, P. C. Africa, A. F. Corno, A. Quarteroni, A geometric multiscale model for the numerical simulation of blood flow in the human left heart, Discrete and Continuous Dynamical Systems - S 15 (2022) 2391–2427. doi:10.3934/dcdss.2022052
2022 doi
-
[13]
Futami, T
K. Futami, T. Uno, K. Misaki, S. Tamai, I. Nambu, N. Uchiyama, M. Nakada, Identification of vortex cores in cerebral aneurysms on 4D flow MRI, American Journal of Neuroradiology 40 (2019) 2111–2116
2019
-
[14]
T. B. Le, D. R. Troolin, D. Amatya, E. K. Longmire, F. Sotiropoulos, Vortex phenomena in sidewall aneurysm hemodynamics: experiment and numerical simulation, Annals of Biomedical Engineering 41 (2013) 2157–2170
2013
-
[15]
Quarteroni, Numerical Models for Differential Problems, volume 16 ofModeling, Simulation and Applications, 3rd ed., Springer International Publishing, Cham, Switzerland, 2017
A. Quarteroni, Numerical Models for Differential Problems, volume 16 ofModeling, Simulation and Applications, 3rd ed., Springer International Publishing, Cham, Switzerland, 2017. 27
2017
-
[16]
Totorean, I.-C
A.-F. Totorean, I.-C. Totorean, S. I. Bernad, T. Ciocan, D. C. Malita, D. Gaita, E. S. Bernad, Patient- Specific Image-Based Computational Fluid Dynamics Analysis of Abdominal Aorta and Branches, Jour- nal of Personalized Medicine 12 (2022) 1502. URL:https://www.mdpi.com/2075-...
2022 doi
-
[17]
Goodfellow, Y
I. Goodfellow, Y. Bengio, A. Courville, Deep Learning, MIT press, 2016
2016
-
[18]
Tassi, A
T. Tassi, A. Zingaro, L. Dede’, A machine learning approach to enhance the SUPG stabilization method for advection-dominated differential problems, Mathematics in Engineering 5 (2023) 1–26. doi:10.3934/mine.2023032
2023 doi
-
[19]
Quarteroni, P
A. Quarteroni, P. Gervasio, F. Regazzoni, Combining physics-based and data-driven models: ad- vancing the frontiers of research with scientific machine learning, Mathematical Models and Methods in Applied Sciences 35 (2025) 905–1071. URL:https://www.worldscientific.com/doi/10....
2025 doi
-
[20]
J. D. Toscano, V. Oommen, A. J. Varghese, Z. Zou, N. Ahmadi Daryakenari, C. Wu, G. E. Karniadakis, From PINNs to PIKANs: recent advances in physics-informed machine learning, Machine Learning for Computational Science and Engineering 1 (2025) 15. URL:https://link.springer.com/...
2025 doi
-
[21]
Raissi, P
M. Raissi, P. Perdikaris, G. E. Karniadakis, Physics informed deep learning (part i): Data-driven solutions of nonlinear partial differential equations, arXiv preprint arXiv:1711.10561 (2017)
2017 arXiv
-
[22]
N. K. Schiavone, P. J. Nair, C. J. Elkins, D. B. McElhinney, D. B. Ennis, J. K. Eaton, A. L. Marsden, Assessing the impact of cardiac output and valve orientation on bioprosthetic pulmonary valve hemodynamics using in vitro 4d-flow mri and high-speed imaging, Cardiovascular En...
2025 doi
-
[23]
Zhang, M
J. Zhang, M. C. Brindise, S. Rothenberger, S. Schnell, M. Markl, D. Saloner, V. L. Rayz, P. P. Vlachos, 4D flow MRI pressure estimation using velocity measurement-error-based weighted least-squares, IEEE transactions on medical imaging 39 (2019) 1668–1680
2019
-
[24]
Ferdian, D
E. Ferdian, D. J. Dubowitz, C. A. Mauger, A. Wang, A. A. Young, WSSNet: aortic wall shear stress estimation using deep learning on 4D flow MRI, Frontiers in Cardiovascular Medicine (2022) 1969
2022
-
[25]
Zhang, S
J. Zhang, S. M. Rothenberger, M. C. Brindise, M. B. Scott, H. Berhane, J. J. Baraboo, M. Markl, V. L. Rayz, P. P. Vlachos, Divergence-Free Constrained Phase Unwrapping and Denoising for 4D Flow MRI Using Weighted Least-Squares, IEEE Transactions on Medical Imaging 40 (2021) 33...
2021 doi
-
[26]
S. Cai, Z. Mao, Z. Wang, M. Yin, G. E. Karniadakis, Physics-informed neural networks (PINNs) for fluid mechanics: A review, Acta Mechanica Sinica (2022) 1–12
2022
-
[27]
Kissas, Y
G. Kissas, Y. Yang, E. Hwuang, W. R. Witschey, J. A. Detre, P. Perdikaris, Machine learning in cardiovascular flows modeling: Predicting arterial blood pressure from non-invasive 4D flow MRI data using physics-informed neural networks, Computer Methods in Applied Mechanics and...
2020
-
[28]
Sarabian, H
M. Sarabian, H. Babaee, K. Laksari, Physics-informed neural networks for brain hemodynamic predic- tions using medical imaging, IEEE Transactions on Medical Imaging (2022)
2022
-
[29]
URL:https://www.cambridge.org/core/ product/identifier/S002211202100135X/type/journal_article
S.Cai, Z.Wang, F.Fuest, Y.J.Jeon, C.Gray, G.E.Karniadakis, Flowoveranespressocup: inferring3- DvelocityandpressurefieldsfromtomographicbackgroundorientedSchlierenviaphysics-informedneu- ral networks, Journal of Fluid Mechanics 915 (2021) A102. URL:https://www.cambridge.org/cor...
2021 doi
-
[30]
Hub, Benchmark dataset for validating computational fluid dynamic (CFD) simulation of blood flow through FDA nozzle and FDA blood pump — NCI Hub, 2022
N. Hub, Benchmark dataset for validating computational fluid dynamic (CFD) simulation of blood flow through FDA nozzle and FDA blood pump — NCI Hub, 2022. URL:https://ncihub.org/wiki/FDA_ CFD?version=30, [Online; accessed March 2022]
2022
-
[31]
S. F. Stewart, E. G. Paterson, G. W. Burgreen, P. Hariharan, M. Giarra, V. Reddy, S. W. Day, K. B. Manning, S. Deutsch, M. R. Berman, et al., Assessment of CFD performance in simulations of an idealized medical device: results of FDA’s first computational interlaboratory study...
2012
-
[32]
Hariharan, M
P. Hariharan, M. Giarra, V. Reddy, S. W. Day, K. B. Manning, S. Deutsch, S. F. Stewart, M. R. Myers, M. R. Berman, G. W. Burgreen, et al., Multilaboratory particle image velocimetry analysis of the fda benchmark nozzle model to support validation of computational fluid dynamic...
2011
-
[33]
Hariharan, R
P. Hariharan, R. A. Malinauskas, Round robin 1 data sets, 2017. URL:https://ncihub.org/ publications/43/2. doi:doi:/10.17917/C78G69
2017 doi
-
[34]
Quarteroni, L
A. Quarteroni, L. Dede’, A. Manzoni, C. Vergara, et al., Mathematical modelling of the human cardio- vascular system: data, numerical approximation, clinical applications, volume 33, Cambridge University Press, 2019
2019
-
[35]
Bischof, M
R. Bischof, M. A. Kraus, Multi-Objective Loss Balancing for Physics-Informed Deep Learning, Com- puter Methods in Applied Mechanics and Engineering 439 (2025) 117914. URL:https://linkinghub. elsevier.com/retrieve/pii/S0045782525001860. doi:10.1016/j.cma.2025.117914
2025 doi
-
[36]
Kissas, E
G. Kissas, E. Hwuang, E. W. Thompson, N. Schwartz, J. A. Detre, W. R. Witschey, P. Perdikaris, Feasibility of vascular parameter estimation for assessing hypertensive pregnancy disorders, Journal of Biomechanical Engineering 144 (2022) 121011
2022
-
[37]
Chollet, Deep Learning with Python, Simon and Schuster, 2021
F. Chollet, Deep Learning with Python, Simon and Schuster, 2021
2021
- [38]
-
[39]
D. P. Kingma, J. Ba, Adam: A method for stochastic optimization, CoRR abs/1412.6980 (2015)
2015 arXiv
-
[40]
C. Zhu, R. H. Byrd, P. Lu, J. Nocedal, Algorithm 778: L-BFGS-B: Fortran subroutines for large-scale bound-constrained optimization, ACM Transactions on mathematical software (TOMS) 23 (1997) 550– 560
1997
-
[41]
P. C. Africa, lifex: a flexible, high performance library for the numerical solution of complex finite element problems, SoftwareX 20 (2022) 101252
2022
-
[42]
P. C. Africa, I. Fumagalli, M. Bucelli, A. Zingaro, M. Fedele, L. Dede’, A. Quarteroni, lifex- cfd: An open-source computational fluid dynamics solver for cardiovascular applications, Computer Physics Communications 296 (2024) 109039. URL:https://linkinghub.elsevier.com/retrie...
2024 doi
-
[43]
Arndt, W
D. Arndt, W. Bangerth, D. Davydov, T. Heister, L. Heltai, M. Kronbichler, M. Maier, J.-P. Pelteret, B. Turcksin, D. Wells, The deal.II finite element library: Design, features, and insights, Comput- ers & Mathematics with Applications 81 (2021) 407–422. URL:https://linkinghub....
2021 doi
-
[44]
P. C. Africa, D. Arndt, W. Bangerth, B. Blais, M. Fehling, R. Gassmöller, T. Heister, L. Heltai, S. Kinnewig, M. Kronbichler, M. Maier, P. Munch, M. Schreter-Fleischhacker, J. P. Thiele, B. Tur- cksin, D. Wells, V. Yushutin, The deal.II library, Version 9.6, Journal of Numeric...
2024 doi
-
[45]
Forti, L
D. Forti, L. Dedè, Semi-implicit BDF time discretization of the Navier–Stokes equations with VMS-LES modeling in a high performance computing framework, Computers & Fluids 117 (2015) 168–182
2015
-
[46]
URL:https://mox.polimi.it/research-areas/hpcmox/ hardware/, [Accessed 13-Aug-2022]
Hardware — mox.polimi.it, 2022. URL:https://mox.polimi.it/research-areas/hpcmox/ hardware/, [Accessed 13-Aug-2022]
2022
-
[47]
D. V. Dung, N. D. Song, P. S. Palar, L. R. Zuhal, On The Choice of Activation Functions in Physics- Informed Neural Network for Solving Incompressible Fluid Flows, in: AIAA SCITECH 2023 Forum, American Institute of Aeronautics and Astronautics, National Harbor, MD & Online, 20...
2023 doi
-
[48]
Géron, Hands-on machine learning with Scikit-Learn, Keras, and TensorFlow: Concepts, tools, and techniques to build intelligent systems, O’Reilly Media, Inc., 2019
A. Géron, Hands-on machine learning with Scikit-Learn, Keras, and TensorFlow: Concepts, tools, and techniques to build intelligent systems, O’Reilly Media, Inc., 2019
2019
-
[49]
Ioffe, C
S. Ioffe, C. Szegedy, Batch normalization: Accelerating deep network training by reducing internal covariate shift, in: International conference on machine learning, PMLR, 2015, pp. 448–456
2015
-
[50]
Glorot, Y
X. Glorot, Y. Bengio, Understanding the difficulty of training deep feedforward neural networks, in: Proceedings of the thirteenth international conference on artificial intelligence and statistics, JMLR Workshop and Conference Proceedings, 2010, pp. 249–256
2010
-
[51]
Raschka, Python Machine Learning, Packt publishing ltd, 2015
S. Raschka, Python Machine Learning, Packt publishing ltd, 2015
2015
-
[52]
Abadi, P
M. Abadi, P. Barham, J. Chen, Z. Chen, A. Davis, J. Dean, M. Devin, S. Ghemawat, G. Irving, M. Isard, et al., TensorFlow: a system for Large-Scale machine learning, in: 12th USENIX symposium on operating systems design and implementation (OSDI 16), 2016, pp. 265–283
2016
-
[53]
Chollet, et al., Keras,https://keras.io, 2015
F. Chollet, et al., Keras,https://keras.io, 2015
2015
-
[54]
Ahrens, B
J. Ahrens, B. Geveci, C. Law, Paraview: An end-user tool for large data visualization, The visualization handbook 717 (2005)
2005
-
[55]
M. S. Pravdivtseva, E. Peschke, T. Lindner, F. Wodarg, J. Hensler, D. Gabbert, I. Voges, P. Berg, A. J. Barker, O. Jansen, et al., 3D-printed, patient-specific intracranial aneurysm models: From clinical data to flow experiments with endovascular devices, Medical Physics 48 (2...
2021
-
[56]
Weiss, V
F.Pedregosa, G.Varoquaux, A.Gramfort, V.Michel, B.Thirion, O.Grisel, M.Blondel, P.Prettenhofer, R. Weiss, V. Dubourg, J. Vanderplas, A. Passos, D. Cournapeau, M. Brucher, M. Perrot, Édouard Duchesnay, Scikit-learn: Machine learning in python, Journal of Machine Learning Resear...
2011
-
[57]
A. D. Jagtap, K. Kawaguchi, G. E. Karniadakis, Adaptive activation functions accelerate convergence in deep and physics-informed neural networks, Journal of Computational Physics 404 (2020) 109136
2020
-
[58]
Henry, J
E. Henry, J. Hofrichter, [8] singular value decomposition: Application to analysis of experimental data, in: Methods in enzymology, volume 210, Elsevier, 1992, pp. 129–192. 30
1992
Reviewed July 14, 2026 · model on record in the stance chip above.
Discussion (0). Sign in to comment.