REVIEW 6 major objections 6 minor 50 references
A Hybrid Framework for Blood Vessel Morphology Classification: Discrete Geometry-based Tortuosity Feature Measurement, Information Gain-based Feature Selection, and Random Forest Classification
T0 review · 6 major / 6 minor · reviewed 2026-08-02 · deepseek-v4-flash
Pith's one-line read Six curvature and torsion features, selected by information gain, let a random forest reproduce physician tortuosity grades (Macro-F1 0.92 binary, 0.86 ternary).
desk verdict A competent feature-selection-and-classification study whose headline F1s are probably a bit inflated because the six features were chosen on the full dataset before cross-validation; fixable, and worth a referee. read the letter →
The pith
A machine-rendered reading of the paper's core claim, the machinery that carries it, and where it could break.
The reading
What carries the argument
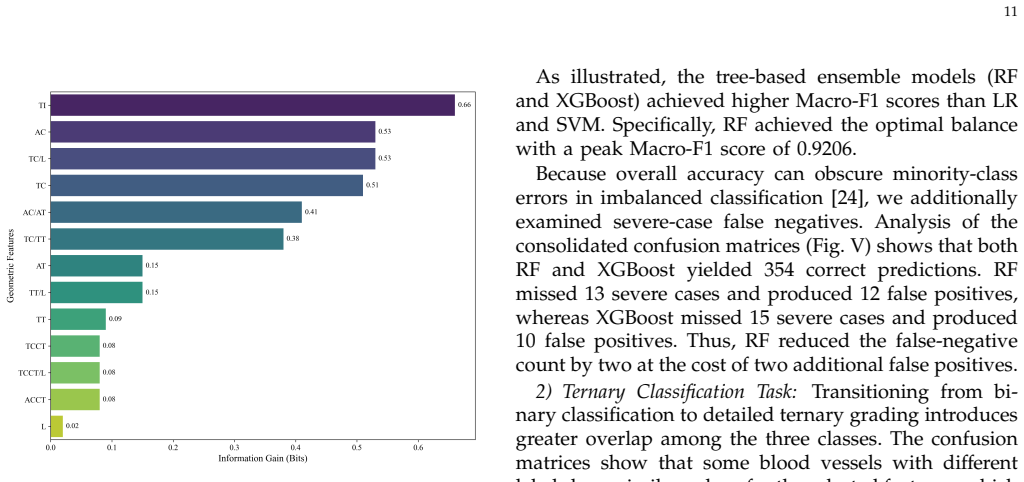
The central mechanism is a discrete-geometry derivative estimator: at each centerline point, a constrained least-squares fit (via Lagrange multipliers) over a sliding window yields stable first, second, and third derivatives r', r'', r'''; these feed the standard Frenet formulas for curvature κ(t) and torsion τ(t). Aggregating these per-point values produces 13 global, averaged, and length-normalized features. A two-stage filter—Information Gain ranking followed by Spearman correlation pruning (|ρ|>0.95)—removes redundant/low-ranked features, yielding the six-feature set. The Random Forest classifier maps these six features to labels, with cost-sensitive class weights to handle imbalance and
What would settle it
Have independent neuroradiologists re-grade the same 379 centerlines and measure inter-rater agreement (e.g., Cohen's kappa); then test the trained six-feature model on a multi-center external dataset. If kappa is far below the model's Macro-F1, or if Macro-F1 drops substantially on the external data, the model is encoding a single rater's or single center's idiosyncrasies rather than a generalizable morphological rule.
Extended reading notes
Core claim
The authors aim to establish that a distance-based metric like the Tortuosity Index is geometrically ambiguous (a Salkowski curve and a helix can share identical L/D values) and that a compact set of curvature- and torsion-derived features can replace subjective visual grading. From 379 ICA-C1 centerlines, they estimate pointwise curvature and torsion via a sliding-window least-squares derivative method, build 13 aggregate features, prune to six (TI, AC, TC, AC/AT, AT, TT) by Information Gain and Spearman correlation, and train a Random Forest. Reported nested out-of-fold Macro-F1 is 0.9206 for binary severe/non-severe screening and 0.8626 for ternary straight/low/high grading. Ablation show
Load-bearing premise
The reported scores are computed against the physicians' previous visual morphological classification, so if those ratings are inconsistent or rater-dependent, the model is matching a subjective reference rather than an objective geometric ground truth.
Editorial extensions
If this is right
- If the reported performance generalizes, tortuosity assessment could become an automated, reproducible measurement rather than a subjective visual judgment.
- The six-feature set is small enough to be checked by hand after centerline extraction, making it a practical candidate for integration into CTA reading workflows.
- The ablation result implies that a fast binary screen only needs three curvature features (TI, AC, TC), while torsion features become necessary when grading into three morphological classes.
- The Morphological Risk Index provides a single numeric summary that could be tracked over time or compared across patients, though the paper explicitly frames it as exploratory.
- Because the labels come from a physician's prior visual classification, the framework should be read as quantifying that clinical consensus, not as discovering an independent ground truth.
Reading between the lines
- A natural extension is to apply the same discrete-geometry feature pipeline to other vessels (e.g., coronary or cerebral arteries) and retrain the classifier, since the mathematics does not depend on the carotid anatomy.
- A multi-reader agreement study would clarify whether the model is learning a stable morphological signal or encoding one rater's idiosyncrasies; if model F1 exceeds human-human agreement, the model could serve as a reference standard.
- The phantom-based argument (identical TI for Salkowski and helix) suggests any proposed replacement metric should be tested against a library of such geometric-ambiguity pairs before being adopted for clinical use.
- The MRI thresholds are sample-based and require external validation; a concrete next test would be to correlate MRI with procedural outcomes such as catheter navigation time or first-pass recanalization.
Editorial analysis
A structured set of objections, weighed in public.
Referee Report
Summary. This paper proposes a hybrid framework for classifying ICA-C1 vascular tortuosity using 379 clinical centerlines (193 subjects). Thirteen geometric features are computed from centerlines by discrete least-squares derivative estimation (curvature, torsion, integrals), and a cascade of information-gain ranking and Spearman correlation pruning reduces them to six features (TI, AC, TC, AC/AT, AT, TT). A random forest is compared with LR, SVM, and XGBoost under nested 5-fold cross-validation; the authors report Macro-F1 0.9206 for binary severe/non-severe screening and 0.8626 for ternary straight/low/high grading. A Morphological Risk Index (MRI) is defined from RF impurity importances with thresholds set at midpoints of group means. The paper also illustrates the insufficiency of TI with matched phantom curves.
Significance. The geometric feature set and the phantom demonstration in Section II-B are useful and clearly presented; the ablation and model comparisons are appropriate in spirit, and the authors explicitly label the MRI as exploratory and list limitations. If the evaluation protocol were corrected (feature selection nested inside CV, subject-level grouping, uncertainty quantification), the central claim of high Macro-F1 would be a meaningful, reproducible contribution to objective tortuosity grading. At present, however, the headline numbers are not trustworthy because of selection bias and unaccounted data dependence.
major comments (6)
- [IV-A / III-D-2] The IG ranking and Spearman pruning are computed once on the full labeled dataset before the nested cross-validation. Thus the outer-fold test labels participate in choosing the six-feature subset, so the 'out-of-fold' predictions are not independent of the test labels. With 379 samples and highly correlated features, this selection bias tends to inflate Macro-F1. Please move the entire feature-selection cascade inside each outer training fold and report selection stability, or justify why the bias is negligible.
- [III-A / III-D-2] The data are 379 vessels from 193 subjects. Vessel-level k-fold splitting can place the two vessels of one subject in both training and test, inflating generalisation. Report subject-level grouped cross-validation or a mixed-effects/random-intercept analysis.
- [Tables IV, VI, VIII] Only point estimates are given. The difference RF vs XGBoost in binary is 0.0009, and the ablation differences are less than 0.01; without foldwise standard deviations, confidence intervals, or paired tests these differences are uninterpretable. Add fold-level results and CIs.
- [Table VII] The ternary confusion matrices sum to 93, 112, and 174 for Straight, Low, and High rows, while Table III gives group sizes N=93, 174, 112. The row/sample-size labeling is therefore inconsistent. The text's comparison of high-tortuosity misclassifications (RF 15 vs LR/SVM 31) relies on these rows; correct the table and recompute the error counts.
- [Eqs. (28)-(29)] MRI thresholds are midpoints of full-sample group means and are not evaluated on held-out data. These are in-sample fitted decision rules; as published they are not validated reference ranges. Please report cross-validated or external performance of the MRI thresholds, or explicitly state that they are descriptive full-sample statistics with no decision-making claim.
- [III-A / IV-A] The binary label definition is not stated. The text says binary and ternary labels are not a one-to-one mapping, yet the Table V class sizes (267/112) coincide with merging 'straight'+'low' vs 'high'. Specify how 'severe' was derived, and report the annotation protocol and inter-rater reliability for the physician's ternary grades used as labels.
minor comments (6)
- [III-D-2] The text mentions an 'inner 3-fold loop' for hyperparameter search but later says '5-fold nested OOF'; clarify the number of inner folds and report grid ranges.
- [IV-C-1] 'Fig. V' should be 'Table V'.
- [III-C-1] The number of quantile bins K for IG discretization is not given; without it the IG ranking is not reproducible.
- [III-D-3] The ablation tolerance ('10^-3 scale') is not defined; specify how the tolerance interval was set.
- [Methods] Consider reporting data/code availability and the exact RF hyperparameters (number of trees, max depth, class weights) to make the experiments reproducible.
- [Table VIII] The 'peaks' at 3 and 5 features are within 0.01 of the 6-feature baseline, but without variance estimates the statement that these are 'equivalent' is not supported.
Circularity Check
Full-data IG feature selection and MRI thresholds fitted to the same labels make several reported results partially circular.
-
fitted input called prediction
[Section III-D-2 with feature selection in Section IV-A / III-C]
"First, we calculated IG values based on the physician’s previous ternary morphological classification ... The optimal models were subsequently evaluated solely on the mutually exclusive outer test folds ... ensuring an unbiased mathematical estimation of the model’s empirical risk on unseen geometric data."
The six-feature subset (TI, AC, TC, AC/AT, AT, TT) is selected once by Information Gain and Spearman correlation using all 379 labeled vessels before the nested 5-fold CV is run. Thus the labels in the outer test folds have already influenced which features enter the RF. The OOF predictions are not generated by a model whose input representation was fixed without access to the test labels; the reported Macro-F1 values (0.9206 and 0.8626) are therefore not fully out-of-sample estimates. This is a circular validation step, not a pure prediction on unseen data.
-
fitted input called prediction
[Section IV.C.4, Eqs. (28)-(29)]
"Here, the mean MRI scores are −0.4003 for the non-severe group and 0.9542 for the severe group, yielding θ0 =(−0.4003+0.9542)/2=0.2770."
The MRI classification thresholds are defined as the midpoints of the observed group means of the MRI scores computed on the very same labeled data. Equations (28) and (29) then assign each vessel to the side of these fitted thresholds. Consequently, the group means are guaranteed to fall on their respective sides of the threshold by construction; any separation of the group means is an arithmetic consequence of the definition rather than an independent predictive finding. The paper labels the MRI exploratory, but the threshold-based categorization is still a fitted rule, not a validated prediction.
full rationale
The geometric feature measurement chain is self-contained: curvature, torsion, TI, AC, TC, AT, TT, and AC/AT are computed from centerline coordinates using standard discrete differential geometry formulas and do not use the labels. There are no load-bearing self-citations and no uniqueness theorem imported from the authors. The RF classifier itself is a standard algorithm. However, two steps close the loop. First, the feature selection by Information Gain uses the physician ternary labels over the full dataset before the outer cross-validation folds are formed, so the headline OOF Macro-F1 estimates are affected by label leakage and are not strictly independent predictions. Second, the MRI thresholds in Eqs. (28)-(29) are midpoints of group means from the same data, making the reported group separation tautological. These are fitted inputs presented as predictive outputs, so the paper is partially circular even though the underlying geometric derivations are not. The paper's own limitations section acknowledges the need for external validation, which mitigates but does not remove the circular construction.
Assumptions & free parameters
free parameters (6)
- Derivative window radii m=(1,1,1)
- Gaussian smoothing sigma =
1
- IG quantile binning =
not specified
- Spearman correlation threshold =
0.95
- MRI thresholds theta0, theta1, theta2 =
0.2770, -0.4555, 0.3527
- Ablation tolerance =
1e-3
assumptions (5)
- standard math The Frenet frame is well-defined: centerline is smooth with nonzero curvature at sample points.
- domain assumption The centerline extraction and smoothing pipeline produces a faithful discrete representation of the vessel centerline.
- domain assumption Physician visual grading provides reliable ground-truth morphological labels.
- domain assumption ICA-C1 segment identification via multi-planar visualization is anatomically correct.
- domain assumption The discrete least-squares derivative estimator with m=(1,1,1) accurately approximates true derivatives at ~0.994 points/mm sampling.
invented entities (1)
-
Morphological Risk Index (MRI)
Cite this review
Pith. "Pith review of A Hybrid Framework for Blood Vessel Morphology Classification: Discrete Geometry-based Tortuosity Feature Measurement, Information Gain-based Feature Selection, and Random Forest Classification." pith.science (2026). https://pith.science/paper/2OOYGR6J
@misc{pith2026260714195,
  author       = {Pith},
  title        = {Pith review of: A Hybrid Framework for Blood Vessel Morphology Classification: Discrete Geometry-based Tortuosity Feature Measurement, Information Gain-based Feature Selection, and Random Forest Classification},
  year         = {2026},
  howpublished = {\url{https://pith.science/paper/2OOYGR6J}},
  note         = {Machine review of arXiv:2607.14195}
}
abstract
Subjective visual grading of blood vessel tortuosity relies heavily on clinical experience, while traditional distance-based indices often fail to adequately characterize three-dimensional spatial deformation. Because abnormal internal carotid artery morphology may be clinically relevant to cerebrovascular assessment and stroke-risk evaluation, objective and reproducible quantification of vascular tortuosity is of considerable importance. To address this limitation, we propose a mathematical framework for the morphological classification of the internal carotid artery (ICA-C1) segment. The framework integrates discrete geometric feature measurement, Information Gain-based feature selection, and Random Forest classification. An initial set of 13 tortuosity features is extracted from the corresponding 379 clinical vascular centerlines using discrete geometric methods and subsequently reduced to a six-feature subset consisting of $\mathcal{TI}$, $\mathcal{AC}$, $\mathcal{TC}$, $\mathcal{AC}/\mathcal{AT}$, $\mathcal{AT}$, and $\mathcal{TT}$. The framework is evaluated in two classification tasks. For binary classification of non-severe and severe tortuosity, the RF model achieves a Macro-F1 score of 0.9206. For ternary morphological grading into straight, low-tortuosity, and high-tortuosity groups, it achieves a Macro-F1 score of 0.8626. The results indicate that elongation- and curvature-related features provide strong discriminatory information for basic screening, whereas torsion-related features contribute additional information for more detailed morphological classification. Based on the RF feature-importance values, we further define a Morphological Risk Index (MRI), which provides a direct numerical reference for vascular morphology and may facilitate more objective and consistent clinical assessment.
Figures


Figures from the paper (9 more)




Reference graph
Works this paper leans on
-
[1]
A novel curvature-based algorithm for automatic grading of retinal blood vessel tortuosity,
M. Aghamohamadian-Sharbaf, H. R. Pourreza, and T. Banaee, “A novel curvature-based algorithm for automatic grading of retinal blood vessel tortuosity,”IEEE Journal of Biomedical and Health Informatics, vol. 20, no. 2, pp. 586–595, 2016
2016
-
[2]
Explainability for artificial intelligence in healthcare: a multi- disciplinary perspective,
J. Amann, A. Blasimme, E. Vayena, D. Frey, and V . I. Madai, “Explainability for artificial intelligence in healthcare: a multi- disciplinary perspective,”BMC Medical Informatics and Decision Making, vol. 20, no. 1, pp. 1–9, 2020
2020
-
[3]
Geometric properties estima- tion from discrete curves using discrete derivatives,
Y. An, C. Shao, X. Wang, and Z. Li, “Geometric properties estima- tion from discrete curves using discrete derivatives,”Computers & Graphics, vol. 35, no. 4, pp. 916–930, 2011
2011
-
[4]
Geometric properties esti- mation from line point clouds using gaussian-weighted discrete derivatives,
Y. An, L. Wang, R. Ma, and J. Wang, “Geometric properties esti- mation from line point clouds using gaussian-weighted discrete derivatives,”IEEE Transactions on Industrial Electronics, vol. 68, no. 1, pp. 703–714, 2020
2020
-
[5]
An image- based modeling framework for patient-specific computational hemodynamics,
L. Antiga, M. Piccinelli, L. Botti, and D. A. Steinman, “An image- based modeling framework for patient-specific computational hemodynamics,”Medical & Biological Engineering & Computing, vol. 46, no. 11, pp. 1097–1112, 2008
2008
-
[6]
Initialization, noise, singularities, and scale in height ridge traversal for tubular object centerline extraction,
S. R. Aylward and E. Bullitt, “Initialization, noise, singularities, and scale in height ridge traversal for tubular object centerline extraction,”IEEE Transactions on Medical Imaging, vol. 21, no. 2, pp. 61–75, 2002
2002
-
[7]
Morphometry of the entire internal carotid artery on ct angiography,
R. A. Baz, C. Scheau, C. Niscoveanuet al., “Morphometry of the entire internal carotid artery on ct angiography,”Medicina, vol. 57, no. 8, p. 832, 2021. 16
2021
-
[8]
Parameter free torsion estimation of curves in 3d images,
C. Blankenburg, C. Daul, and J. Ohser, “Parameter free torsion estimation of curves in 3d images,” in2016 IEEE International Conference on Image Processing, 2016, pp. 1081–1085
2016
Show all 50 references
-
[9]
Auto- mated landmarking and geometric characterization of the carotid siphon,
H. Bogunovi ´c, J. M. Pozo, M. C. Villa-Uriolet al., “Auto- mated landmarking and geometric characterization of the carotid siphon,”Medical Image Analysis, vol. 16, no. 4, pp. 889–903, 2012
2012
-
[10]
Segments of the internal carotid artery: a new classification,
A. Bouthillier, H. R. van Loveren, and J. T. Keller, “Segments of the internal carotid artery: a new classification,”Neurosurgery, vol. 38, no. 3, pp. 425–433, 1996
1996
-
[11]
Random forests,
L. Breiman, “Random forests,”Machine Learning, vol. 45, no. 1, pp. 5–32, 2001
2001
-
[12]
Improving blood vessel tortuosity measurements via highly sampled numerical integration of the frenet-serret equations,
A. B. Brummer, D. Hunt, and V . Savage, “Improving blood vessel tortuosity measurements via highly sampled numerical integration of the frenet-serret equations,”IEEE Transactions on Medical Imaging, vol. 40, no. 1, pp. 297–309, 2020
2020
-
[13]
Measuring tortuosity of the intracerebral vasculature from mra images,
E. Bullitt, G. Gerig, S. Pizer, W. Lin, and S. Aylward, “Measuring tortuosity of the intracerebral vasculature from mra images,”IEEE Transactions on Medical Imaging, vol. 22, pp. 1163–1171, 2003
2003
-
[14]
Explainable medical imaging AI needs human-centered design: Guidelines and evidence from a systematic review,
H. Chen, C. Gomez, C.-M. Huang, and M. Unberath, “Explainable medical imaging AI needs human-centered design: Guidelines and evidence from a systematic review,”npj Digital Medicine, vol. 5, p. 156, 2022
2022
-
[15]
Estimating curvature and torsion of 3d curves from digital images,
D. Coeurjolly and S. Miguet, “Estimating curvature and torsion of 3d curves from digital images,”Pattern Recognition Letters, vol. 25, no. 10, pp. 1181–1192, 2004
2004
-
[16]
TRIPOD+AI statement: Updated guidance for reporting clinical prediction models that use regression or machine learning methods,
G. S. Collins, K. G. M. Moons, P . Dhimanet al., “TRIPOD+AI statement: Updated guidance for reporting clinical prediction models that use regression or machine learning methods,”The BMJ, vol. 385, p. e078378, 2024
2024
-
[17]
Random forest versus logistic regression: a large-scale benchmark experiment,
R. Couronn ´e, P . Probst, and A. L. Boulesteix, “Random forest versus logistic regression: a large-scale benchmark experiment,” BMC Bioinformatics, vol. 19, no. 1, p. 270, 2018
2018
-
[18]
T. M. Cover and J. A. Thomas,Elements of information theory. John Wiley & Sons, 1991. [Online]. Available: https: //onlinelibrary.wiley.com/doi/book/10.1002/0471200611
1991 doi
-
[19]
Modeling and hexahedral meshing of cerebral arterial networks from centerlines,
M. Decroocq, C. Frindel, P . Roug ´e, M. Ohta, and G. Lavou ´e, “Modeling and hexahedral meshing of cerebral arterial networks from centerlines,”Medical Image Analysis, vol. 89, p. 102912, 2023
2023
-
[20]
Multiscale vessel enhancement filtering,
A. F. Frangi, W. J. Niessen, K. L. Vincken, and M. A. Viergever, “Multiscale vessel enhancement filtering,” inMedical Image Com- puting and Computer-Assisted Intervention–MICCAI’98, 1998, pp. 130–137
1998
-
[21]
The false hope of current approaches to explainable artificial intelligence in health care,
M. Ghassemi, L. Oakden-Rayner, and A. L. Beam, “The false hope of current approaches to explainable artificial intelligence in health care,”The Lancet Digital Health, vol. 3, no. 11, pp. e745– e750, 2021
2021
-
[22]
Endovascu- lar thrombectomy after large-vessel ischaemic stroke: a meta- analysis,
M. Goyal, B. K. Menon, W. H. van Zwamet al., “Endovascu- lar thrombectomy after large-vessel ischaemic stroke: a meta- analysis,”The Lancet, vol. 387, no. 10029, pp. 1723–1731, 2016
2016
-
[23]
A novel method for the automatic grading of retinal vessel tortuosity,
E. Grisan, M. Foracchia, and A. Ruggeri, “A novel method for the automatic grading of retinal vessel tortuosity,”IEEE Transactions on Medical Imaging, vol. 27, no. 3, pp. 310–319, 2008
2008
-
[24]
Learning from class-imbalanced data: Review of meth- ods and applications,
G. Haixiang, L. Yijing, J. Shang, G. Mingyun, H. Yuanyue, and Z. Bing, “Learning from class-imbalanced data: Review of meth- ods and applications,”Expert Systems with Applications, vol. 73, pp. 220–239, 2017
2017
-
[25]
Robust measures of three- dimensional vascular tortuosity,
M. J. Johnson and G. Dougherty, “Robust measures of three- dimensional vascular tortuosity,”Medical Engineering & Physics, vol. 29, no. 6, pp. 677–690, 2007
2007
-
[26]
Accuracy of vascular tortuosity measures using computational modelling,
V . Kashyap, R. Gharleghi, D. D. Li, L. McGrath-Cadell, R. M. Graham, C. Ellis, M. Webster, and S. Beier, “Accuracy of vascular tortuosity measures using computational modelling,”Scientific Reports, vol. 12, no. 1, p. 865, 2022
2022
-
[27]
In- ternal carotid artery tortuosity: impact on mechanical thrombec- tomy,
J. Koge, K. Tanaka, T. Yoshimoto, M. Shiozawa, Y. Kushiet al., “In- ternal carotid artery tortuosity: impact on mechanical thrombec- tomy,”Stroke, vol. 53, no. 8, pp. 2458–2467, 2022
2022
-
[28]
FUTURE-AI: International consensus guideline for trustworthy and deployable artificial intelligence in health- care,
K. Lekadiret al., “FUTURE-AI: International consensus guideline for trustworthy and deployable artificial intelligence in health- care,”The BMJ, vol. 388, p. e081554, 2025
2025
-
[29]
A review of 3d vessel lumen segmentation techniques: Models, features and extraction schemes,
D. Lesage, E. D. Angelini, I. Bloch, and G. Funka-Lea, “A review of 3d vessel lumen segmentation techniques: Models, features and extraction schemes,”Medical Image Analysis, vol. 13, no. 6, pp. 819– 845, 2009
2009
-
[30]
Feature selection: A data perspective,
J. Li, K. Cheng, S. Wang, F. Morstatter, R. P . Trevino, J. Tang, and H. Liu, “Feature selection: A data perspective,”ACM Computing Surveys (CSUR), vol. 50, no. 6, pp. 1–45, 2017
2017
-
[31]
Tortuosity and other vessel attributes for arterioles and venules of the human cerebral cortex,
S. Lorthois, F. Lauwers, and F. Cassot, “Tortuosity and other vessel attributes for arterioles and venules of the human cerebral cortex,” Microvascular Research, vol. 91, pp. 99–109, 2014
2014
-
[32]
Estimation of torsion,
K. V . Mardia, “Estimation of torsion,”Journal of Applied Statistics, vol. 26, no. 3, pp. 373–381, 1999
1999
-
[33]
Thrombectomy 6 to 24 hours after stroke with a mismatch between deficit and infarct,
R. G. Nogueira, A. P . Jadhav, D. C. Haussenet al., “Thrombectomy 6 to 24 hours after stroke with a mismatch between deficit and infarct,”New England Journal of Medicine, vol. 378, no. 1, pp. 11–21, 2018
2018
-
[34]
In vitro analysis of the efficacy of endovascular thrombectomy techniques according to the vascular tortuosity using 3d printed models,
J. Ohet al., “In vitro analysis of the efficacy of endovascular thrombectomy techniques according to the vascular tortuosity using 3d printed models,”American Journal of Neuroradiology, vol. 43, no. 10, pp. 1431–1437, 2022
2022
-
[35]
Blood flow in the tortuous internal carotid artery,
V . Pancaldiet al., “Blood flow in the tortuous internal carotid artery,”Journal of Biomechanics, vol. 45, no. 11, pp. 1885–1890, 2012
2012
-
[36]
A framework for geometric analysis of vascular structures: Application to cerebral aneurysms,
M. Piccinelli, A. Veneziani, D. A. Steinman, A. Remuzzi, and L. Antiga, “A framework for geometric analysis of vascular structures: Application to cerebral aneurysms,”IEEE Transactions on Medical Imaging, vol. 28, no. 8, pp. 1141–1155, 2009
2009
-
[37]
Explicit solutions of the three-dimensional inverse prob- lem of dynamics, using the frenet reference frame,
F. Puel, “Explicit solutions of the three-dimensional inverse prob- lem of dynamics, using the frenet reference frame,”Celestial Mechanics and Dynamical Astronomy, vol. 53, pp. 207–218, 1992
1992
-
[38]
Common pitfalls and recommendations for using machine learning to detect and prog- nosticate for COVID-19 using chest radiographs and CT scans,
M. Roberts, D. Driggs, M. Thorpeet al., “Common pitfalls and recommendations for using machine learning to detect and prog- nosticate for COVID-19 using chest radiographs and CT scans,” Nature Machine Intelligence, vol. 3, pp. 199–217, 2021
2021
-
[39]
Correlation coefficients: appropriate use and interpretation,
P . Schober, C. Boer, and L. A. Schwarte, “Correlation coefficients: appropriate use and interpretation,”Anesthesia & Analgesia, vol. 126, no. 5, pp. 1763–1768, 2018
2018
-
[40]
A mathematical theory of communication,
C. E. Shannon, “A mathematical theory of communication,”The Bell System Technical Journal, vol. 27, no. 3, pp. 379–423, 1948
1948
-
[41]
A systematic analysis of perfor- mance measures for classification tasks,
M. Sokolova and G. Lapalme, “A systematic analysis of perfor- mance measures for classification tasks,”Information Processing & Management, vol. 45, no. 4, pp. 427–437, 2009
2009
-
[42]
The need to report effect size estimates revisited. an overview of some recommended measures of effect size,
M. Tomczak and E. Tomczak, “The need to report effect size estimates revisited. an overview of some recommended measures of effect size,”Trends in Sport Sciences, vol. 21, no. 1, pp. 19–25, 2014
2014
-
[43]
What clinicians want: contextualizing explainable machine learning for clinical end use,
S. Tonekaboni, S. Joshi, M. D. McCradden, and A. Goldenberg, “What clinicians want: contextualizing explainable machine learning for clinical end use,” inProceedings of the 4th Machine Learning for Healthcare Conference, 2019, pp. 359–380. [Online]. Available: https://proceedi...
2019
-
[44]
Machine learning algorithm validation with a limited sample size,
A. Vabalas, E. Gowen, E. Poliakoff, and A. J. Casson, “Machine learning algorithm validation with a limited sample size,”PLOS ONE, vol. 14, no. 11, p. e0224365, 2019
2019
-
[45]
Reporting guideline for the early-stage clinical evaluation of decision support systems driven by artificial intelligence: DECIDE-AI,
B. Vasey, M. Nagendran, B. Campbellet al., “Reporting guideline for the early-stage clinical evaluation of decision support systems driven by artificial intelligence: DECIDE-AI,”Nature Medicine, vol. 28, no. 5, pp. 924–933, 2022
2022
-
[46]
A review of feature selection methods based on mutual information,
J. R. Vergara and P . A. Est ´evez, “A review of feature selection methods based on mutual information,”Neural Computing and Applications, vol. 24, no. 1, pp. 175–186, 2014
2014
-
[47]
Exploitation of surrogate variables in random forests for unbiased analysis of mutual impact and importance of features,
L. F. Voges, L. C. Jarren, S. Seifert, and S. Szymczak, “Exploitation of surrogate variables in random forests for unbiased analysis of mutual impact and importance of features,”Bioinformatics, vol. 39, no. 8, p. btad471, 2023
2023
-
[48]
Tortuosity, coiling, and kinking of the internal carotid artery,
J. Weibel and W. S. Fields, “Tortuosity, coiling, and kinking of the internal carotid artery,”Neurology, vol. 15, no. 1, p. 7, 1965
1965
-
[49]
Anatomy of the intracranial arteries: the internal carotid artery,
D. N. Wolman, A. M. Moraff, and J. J. Heit, “Anatomy of the intracranial arteries: the internal carotid artery,”Neuroimaging Clinics, vol. 32, no. 3, pp. 603–615, 2022
2022
-
[50]
Application of 3d curvature and torsion in evaluating aortic tortuosity,
X. Zhang, M. F. Luo, K. Fang, J. Li, Y. Penget al., “Application of 3d curvature and torsion in evaluating aortic tortuosity,”Commu- nications in Nonlinear Science and Numerical Simulation, vol. 95, p. 105619, 2021
2021
Reviewed August 2, 2026 · model on record in the stance chip above.
Discussion (0). Sign in to comment.