REVIEW 4 major objections 5 minor 42 references
Learning Long-Term Educational Investment Policies under Residential Sorting
T0 review · 4 major / 5 minor · reviewed 2026-08-10 · deepseek-v4-flash
Pith's one-line read A reinforcement-learning planner can allocate school budgets over time so that average accessed quality is highest and access inequality low, even though households respond by sorting across neighbourhoods and bidding up housing prices.
desk verdict A solid testbed undermined by a headline that its own Table 2 contradicts; the enrollment-proportional baseline beats the RL policy on every equity metric at identical mean access. read the letter →
The pith
A machine-rendered reading of the paper's core claim, the machinery that carries it, and where it could break.
The reading
What carries the argument
The load-bearing mechanism is the education–housing feedback loop, and its computational heart is a convex-program characterization of sorting equilibrium. Each period, households with Gumbel taste shocks generate logit demand for vacant units; housing prices are the dual variables that clear the vacancy market through a complementarity condition, and the price vector is the unique minimizer of a potential function whose gradient is excess demand. This equilibrium is the environment step of a partially observable Markov decision process: the government sees aggregated school and community summaries, samples a budget share vector from a Dirichlet policy, and is trained with proximal policy optimization (PPO) against the discounted Atkinson welfare objective. School quality evolves by $r^{t+1}_k = (1-\delta) r^t_k + \delta (w_v g_v(h^t_k) + w_s S^t_k)$, so both per-student investment and peer composition carry current decisions into future access. The Atkinson parameter $\epsilon$ makes the effectiveness–equity trade-off explicit: at $\epsilon=0$ the objective is average access, and larger values shift priority toward children with lower access.
What would settle it
Track an actual district over several budget cycles, estimate the model's logit parameters from observed moves and housing transactions, and rerun the same policy comparison; the central claim is falsified if the learned RL policy does not match or beat equal-split, enrollment-proportional, and compensatory allocation on average accessed quality and access Gini in that recalibrated environment.
Extended reading notes
Core claim
On the paper's own terms, the discovery is that sequential investment policy can be learned for a school system whose access patterns are mediated by a housing market, and that the learned policy outperforms static allocation rules on the planner's own objective. The authors build a dynamic model in which government budget shares, household residential choice, housing prices, enrollment, and school quality all co-evolve. They prove that each period's sorting equilibrium—prices and logit choice probabilities that clear vacancies—is the minimizer of a convex potential function, so it can be computed efficiently and treated as part of the environment. The government observes only school and community summaries, and its policy is trained with reinforcement learning to maximize discounted Atkinson welfare of accessed quality minus a penalty for abrupt budget changes. The headline simulation result is a high average access level with low access inequality, and the ablation study shows that the largest social consequence comes from endogenous housing prices: making prices responsive lowers access inequality but more than doubles income dissimilarity, revealing a trade-off that static models hide.
Load-bearing premise
The load-bearing premise is that the hand-set behavioural parameters in the simulator—household tastes for school quality, price sensitivity, choice randomness, school-quality transition weights, and the government's inequality aversion—are close enough to reality that the ranking of policies in the simulation would survive contact with real districts.
Editorial extensions
If this is right
- A planner that ignores the housing market will systematically misestimate who benefits from a school improvement, because capitalized prices reassign access.
- The policy can be learned from coarse community-level summaries (occupancy, mean income, mean ability, school quality) rather than from household microdata.
- Equalizing the overall distribution of school quality is not the same as equalizing access across income groups; the learned policy's income-quality correlation stays positive.
- Expanding the number of schools without changing spatial structure can worsen access inequality and income dissimilarity, since households sort more finely across differentiated schools.
- A fixed recurring budget, reallocated through a learned policy, can sustain high average access while reducing the Gini of accessed quality, even with population turnover and delayed quality effects.
Reading between the lines
- Beyond the paper: if the behavioural parameters were estimated from administrative records (for example, house transactions and school-choice applications around a real funding reform), the same framework could produce a directly deployable, district-specific spending rule.
- Beyond the paper: the convex-program sorting module is a reusable forward model, so the planning layer could be re-trained for other instruments—attendance-boundary changes, housing vouchers, or teacher allocation—without changing the equilibrium solver.
- Beyond the paper: the small mean-access differences across policies suggest that in real data the effect of policy choice may show up mainly in distributional and sorting metrics rather than in average test scores, so evaluation designs should look at access inequality and housing capitalization as primary outcomes.
Editorial analysis
A structured set of objections, weighed in public.
Referee Report
Summary. The paper builds a dynamic simulation that couples government school-investment decisions with household residential sorting, housing prices, enrollment, and evolving school quality, and uses PPO to learn a multiyear budget-allocation policy under an Atkinson-type equity-efficiency reward. The core modeling contribution is a lower-level sorting equilibrium characterized as a convex program (Proposition 1), a projected-gradient algorithm with convergence guarantee (Proposition 2), and a POMDP/RL upper-level formulation. In simulations the RL policy is compared with equal-split, enrollment-proportional, and compensatory funding, and the paper claims a favorable effectiveness–equity balance. The equilibrium and training derivations are internally consistent, but the headline policy claim is not supported by the paper's own Table 2: the enrollment-proportional baseline achieves essentially identical mean access with substantially lower access Gini.
Significance. If the policy-comparison claim were sustained, the framework would be a valuable computational platform for studying education–housing feedback over time. The paper deserves credit for providing machine-checkable-looking proof sketches for the equilibrium characterization (Prop. 1) and the convergence of Algorithm 1 (Prop. 2), for disclosing all model parameters in Table 11, for reporting 100-seed averages, and for running one-factor-at-a-time sensitivity and scalability analyses. Those elements make the framework reproducible and transparent. However, the central comparative claim about the RL policy's balance of effectiveness and equity is not established by the reported experiments, and the paper's hand-set behavioral parameters are not validated against observed outcomes. The contribution may survive as a modeling framework, but not as the policy-evaluation result stated in the abstract and conclusions.
major comments (4)
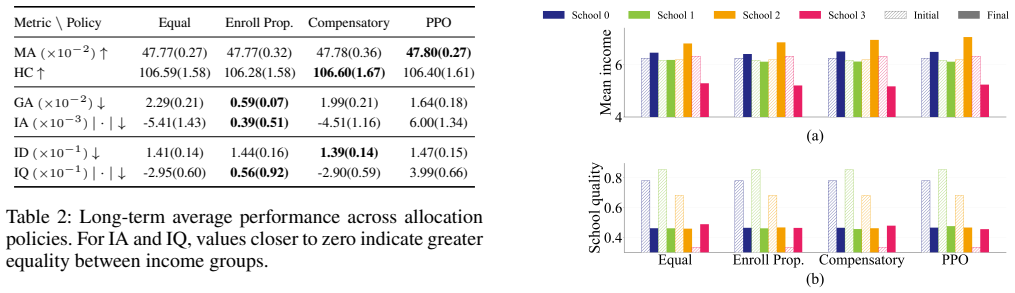
- [Abstract and §8, Table 2] The claimed “favorable effectiveness–equity balance” is not supported by the reported numbers. In Table 2, the enrollment-proportional baseline has GA = 0.59 (0.07) ×10^−2, while PPO has GA = 1.64 (0.18) ×10^−2; on MA the two are 47.77 (0.32) versus 47.80 (0.27) ×10^−2, a raw difference of 0.0003 with standard errors near 0.004. Thus the enrollment-proportional rule—equal per-student funding—achieves statistically indistinguishable mean access and substantially lower access inequality. The prose highlights comparisons to equal-split and compensatory funding and ignores this baseline when claiming a balance result. The statements “highest access” and “favorable balance” need to be either replaced by a statistically grounded comparison or restricted to the baselines for which they hold.
- [Eqs. (11)–(12) and §8, Table 2] The paper never reports the government's own Atkinson reward W_epsilon (Eq. 11) for any baseline. Since the RL policy was trained to maximize the discounted version of this reward (Eq. 12), the reader cannot verify whether PPO improves the objective it was designed to optimize relative to the baselines. Reporting W_epsilon under all policies, together with the access-Gini and mean-access comparisons, is necessary to assess whether the RL solution has actually learned a better policy or simply a different one.
- [Appendix D.6, Table 11 and §8 sensitivity] The behavioral parameters—α, ξ, β0, η, D, τ, δ, w_v, w_s, ψ, ε, and the demographic parameters—are hand-set rather than estimated from school-choice or housing-market data. The CEPS sample is used only to construct the joint type distribution, not to identify preferences or school production. The one-at-a-time sensitivity analysis does not validate the model against real outcomes, and the paper does not show that the ranking of policies is preserved under plausible joint perturbations of these parameters. Therefore, even if the in-simulator comparison were corrected, the external policy conclusions would remain unsubstantiated.
- [§8, first paragraph under “Comparison with Allocation Baselines”] The numerical differences in MA across policies are all within one standard error, so the claim that PPO attains “the highest access level” is at best a point estimate without statistical support. Similarly, the claim that PPO maintains “substantially lower inequality than equal-split and compensatory funding” is true for GA but must be qualified by the observation that enrollment-proportional funding has a GA nearly three times lower than PPO. The interpretation paragraph should be rewritten so the reader is not left with the impression that the RL policy dominates the main alternatives.
minor comments (5)
- [Table 2] The table's ×10^-2 scaling is easy to misread; the text should state the original-scale values (e.g., MA ≈ 0.478, GA ≈ 0.0164) at least once in the discussion to avoid confusion between 47.80 and 0.478.
- [Section heading after Conclusions] The section heading “Disucssions and Conclusions” contains a typo; it should read “Discussions and Conclusions.”
- [Appendix A.1] In the sentence beginning “All tasteshocks are independent,” there is a typo: “taste shocks.”
- [Eq. (12) and Table 11] The policy-stability penalty is denoted λ in Eq. (12) but appears as κ in Table 11, while the same table uses λ for a relocation-cost weight that is not present in Eq. (2). The notation should be harmonized.
- [Appendix D.3 heading] The heading “Sensitive Analysis” should be “Sensitivity Analysis,” and the same typo appears in the paragraph following Table 5.
Circularity Check
No significant circularity: the RL policy result is a simulated outcome, not an equation-level reduction to its own inputs.
full rationale
The paper's derivation chain is self-contained as a computational pipeline: household sorting is derived from a logit demand model and characterized by a convex program (Appendix B), school quality evolves through a stated transition equation, and the RL policy is trained on the explicit Atkinson-type reward W_epsilon with epsilon=2. The evaluation metrics MA and GA are defined independently in Appendix D.2, and although MA is noted to be equivalent to W0, the trained reward W_epsilon is not equal to W0 and GA is not the training objective; the paper even reports that the income-based metrics (IA, IQ) do not improve, showing the evaluation is not merely a restatement of the optimized objective. The comparison baselines are evaluated under the same metrics, so the claimed balance is a testable simulation result rather than a quantity forced by construction. No fitted parameter is renamed as a prediction, and no load-bearing argument relies on self-citation or on an imported uniqueness theorem from the authors' prior work. Concerns about hand-set behavioral parameters and lack of external validation are robustness/calibration risks, not circularity, and the statistical weakness of the 'highest MA' claim relative to Table 2 is a correctness issue outside the circularity pass.
Assumptions & free parameters
free parameters (18)
- α (school-quality preference baseline) =
1.0
- ξ (parental-education preference gradient) =
1.0
- β0 (price-sensitivity scale) =
1.0
- η (amenity weight) =
1.0
- D (relocation cost) =
1.0
- τ (logit temperature) =
0.25
- δ (school-quality adjustment rate) =
0.4
- w_v (investment weight) =
0.8
- w_s (peer-composition weight) =
0.2
- ψ (ability exponent) =
1.0
- ε (Atkinson inequality aversion) =
2.0
- λ (policy-stability penalty, labeled κ in Table 11) =
0
- π (annual departure probability) =
0.2
- χ_in (inflow-to-departure ratio) =
1.0
- γ (discount factor) =
0.95
- P_min (price floor) =
0
- C_m (community housing capacity) =
100
- B (annual education budget) =
100
assumptions (8)
- standard math Logit discrete-choice model with i.i.d. Gumbel taste shocks (Eqs. 2-3, 7-8)
- domain assumption Assumption 1: expected fresh demand does not exceed aggregate vacancies and prices have a positive floor P_min (Eq. 10)
- domain assumption Fixed district map D assigns each community to one school (Setting and Notation)
- domain assumption Households make residential decisions only when a child enters school at age 6, and enrolled households stay for W periods (Household Model)
- domain assumption School quality evolves as r_{t+1,k}=(1-δ)r_{t,k}+δ[w_v g_v(h_k^t)+w_s S_k^t] (Eq. 5)
- domain assumption Government observes only summary q_t, not the full household microstate (Eq. 13)
- domain assumption Household types are drawn from the CEPS empirical joint distribution of income, ability, and parental education (Appendix D.1)
- domain assumption The capacity-feasible realization procedure (Appendix B.4) converts expected-demand equilibrium into discrete assignments without systematically changing prices
Cite this review
Pith. "Pith review of Learning Long-Term Educational Investment Policies under Residential Sorting." pith.science (2026). https://pith.science/paper/Y3IPIVIX
@misc{pith2026260807295,
  author       = {Pith},
  title        = {Pith review of: Learning Long-Term Educational Investment Policies under Residential Sorting},
  year         = {2026},
  howpublished = {\url{https://pith.science/paper/Y3IPIVIX}},
  note         = {Machine review of arXiv:2608.07295}
}
read the original abstract
Allocating public-school investment effectively and fairly is difficult when school access depends on residence. School improvements can raise nearby housing demand and prices, reshape enrollment, and potentially limit access for lower-income households. These effects evolve as residential sorting changes school composition, quality, and future investment needs. Existing approaches often study school funding, household choice, and housing markets separately, while static models can miss their interconnected, long-term effects. We address this gap with a dynamic multi-agent framework that links government investment, household sorting, housing prices, population turnover, enrollment, and evolving school quality. A government planner uses reinforcement learning (RL) to identify multiyear allocation policies that account for household responses while balancing aggregate educational access and equity. In simulations, our RL-based policy attains the highest access level (0.4780) and second-lowest access Gini coefficient (0.0164) among representative baselines, demonstrating a favorable effectiveness-equity balance. The results also indicate reduced socioeconomic stratification in educational access. By making education-housing feedback explicit, our framework supports long-term analysis of how school investment shapes educational opportunity over time.
Figures


Figures from the paper (1 more)

Reference graph
Works this paper leans on
-
[1]
Communication, Simulation, and Intelligent Agents: Implications of Personal Intelligent Machines for Medical Education
Clancey, William J. Communication, Simulation, and Intelligent Agents: Implications of Personal Intelligent Machines for Medical Education. Proceedings of the Eighth International Joint Conference on Artificial Intelligence (IJCAI-83)
-
[2]
Classification Problem Solving
Clancey, William J. Classification Problem Solving. Proceedings of the Fourth National Conference on Artificial Intelligence
-
[3]
, title =
Robinson, Arthur L. , title =. 1980 , doi =. https://science.sciencemag.org/content/208/4447/1019.full.pdf , journal =
1980
-
[4]
New Ways to Make Microcircuits Smaller---Duplicate Entry
Robinson, Arthur L. New Ways to Make Microcircuits Smaller---Duplicate Entry. Science
-
[5]
Clancey and Glenn Rennels , abstract =
Diane Warner Hasling and William J. Clancey and Glenn Rennels , abstract =. Strategic explanations for a diagnostic consultation system , journal =. 1984 , issn =. doi:https://doi.org/10.1016/S0020-7373(84)80003-6 , url =
-
[6]
and Rennels, Glenn R
Hasling, Diane Warner and Clancey, William J. and Rennels, Glenn R. and Test, Thomas. Strategic Explanations in Consultation---Duplicate. The International Journal of Man-Machine Studies
-
[7]
Poligon: A System for Parallel Problem Solving
Rice, James. Poligon: A System for Parallel Problem Solving
-
[8]
Transfer of Rule-Based Expertise through a Tutorial Dialogue
Clancey, William J. Transfer of Rule-Based Expertise through a Tutorial Dialogue
Show all 42 references
-
[9]
The Engineering of Qualitative Models
Clancey, William J. The Engineering of Qualitative Models
-
[10]
2023 , eprint=
Attention Is All You Need , author=. 2023 , eprint=
2023
-
[11]
Pluto: The 'Other' Red Planet
NASA. Pluto: The 'Other' Red Planet
-
[12]
American Economic Review , volume=
The effects of exposure to better neighborhoods on children: New evidence from the moving to opportunity experiment , author=. American Economic Review , volume=. 2016 , publisher=
2016
-
[13]
Journal of Labor Economics , volume=
School finance equalization increases intergenerational mobility , author=. Journal of Labor Economics , volume=. 2023 , publisher=
2023
-
[14]
Sociology of education , volume=
Income segregation between school districts and inequality in students’ achievement , author=. Sociology of education , volume=. 2018 , publisher=
2018
-
[15]
The quarterly journal of economics , volume=
Do better schools matter? Parental valuation of elementary education , author=. The quarterly journal of economics , volume=. 1999 , publisher=
1999
-
[16]
Journal of Urban Economics , volume=
Neighborhood sorting and the value of public school quality , author=. Journal of Urban Economics , volume=. 2019 , publisher=
2019
-
[17]
American Economic Journal: Economic Policy , volume=
Peer preferences, school competition, and the effects of public school choice , author=. American Economic Journal: Economic Policy , volume=. 2019 , publisher=
2019
-
[18]
American economic review , volume=
School choice: A mechanism design approach , author=. American economic review , volume=. 2003 , publisher=
2003
-
[19]
American Educational Research Journal , volume=
Income segregation between schools and school districts , author=. American Educational Research Journal , volume=. 2016 , publisher=
2016
-
[20]
American Economic Journal: Applied Economics , volume=
School attendance boundaries and the segregation of public schools in the United States , author=. American Economic Journal: Applied Economics , volume=. 2023 , publisher=
2023
-
[21]
Journal of Political Economy , year =
Bayer, Patrick and Ferreira, Fernando and McMillan, Robert , title =. Journal of Political Economy , year =
-
[22]
2024 , doi =
Agostinelli, Francesco and Luflade, Margaux and Martellini, Paolo , title =. 2024 , doi =
2024
-
[23]
Computers, Environment and Urban Systems , year =
Dignum, Eric and Athieniti, Efi and Boterman, Willem and Flache, Andreas and Lees, Michael , title =. Computers, Environment and Urban Systems , year =
-
[24]
American Economic Journal: Applied Economics , year =
Lafortune, Julien and Rothstein, Jesse and Schanzenbach, Diane Whitmore , title =. American Economic Journal: Applied Economics , year =
-
[25]
Kirabo and Mackevicius, Claire L
Jackson, C. Kirabo and Mackevicius, Claire L. , title =. American Economic Journal: Applied Economics , year =
-
[26]
Optimal Student/School/Class/Teacher/Classroom Matching to Support Efficient Public School System Resource Allocation , journal =
Mayerle, S. Optimal Student/School/Class/Teacher/Classroom Matching to Support Efficient Public School System Resource Allocation , journal =. 2022 , volume =
2022
-
[27]
Educational Researcher , year =
Gillani, Nabeel and Beeferman, Doug and Vega-Pourheydarian, Christine and Overney, Cassandra and Van Hentenryck, Pascal and Roy, Deb , title =. Educational Researcher , year =
-
[28]
Proceedings of the AAAI Conference on Artificial Intelligence , year =
Guan, Hongzhao and Gillani, Nabeel and Simko, Tyler and Mangat, Jasmine and Van Hentenryck, Pascal , title =. Proceedings of the AAAI Conference on Artificial Intelligence , year =
-
[29]
Environment and Planning B: Urban Analytics and City Science , year =
Zhang, Di and Mu, Senlin and Mango, Joseph and Li, Xiang , title =. Environment and Planning B: Urban Analytics and City Science , year =
-
[30]
Do Parents Value School Effectiveness? , journal =
Abdulkadiro. Do Parents Value School Effectiveness? , journal =. 2020 , volume =
2020
-
[31]
and Zheng, Minrong , title =
Turnbull, Geoffrey K. and Zheng, Minrong , title =. Real Estate Economics , year =
-
[32]
RSF: The Russell Sage Foundation Journal of the Social Sciences , year =
Owens, Ann , title =. RSF: The Russell Sage Foundation Journal of the Social Sciences , year =
-
[33]
Income Distribution, Communities, and the Quality of Public Education , journal =
Fern. Income Distribution, Communities, and the Quality of Public Education , journal =. 1996 , volume =
1996
-
[34]
, title =
Nechyba, Thomas J. , title =. Journal of Public Economic Theory , year =
-
[35]
The Journal of Mathematical Sociology , year =
Dignum, Eric and Boterman, Willem and Flache, Andreas and Lees, Mike , title =. The Journal of Mathematical Sociology , year =
-
[36]
Kirabo and Johnson, Rucker C
Jackson, C. Kirabo and Johnson, Rucker C. and Persico, Claudia , title =. The Quarterly Journal of Economics , year =
-
[37]
Public Education and Income Distribution: A Dynamic Quantitative Evaluation of Education-Finance Reform , journal =
Fern. Public Education and Income Distribution: A Dynamic Quantitative Evaluation of Education-Finance Reform , journal =. 1998 , volume =
1998
-
[38]
2004 , doi =
Bayer, Patrick and McMillan, Robert and Rueben, Kim , title =. 2004 , doi =
2004
-
[39]
Journal of Political Economy , year =
Epple, Dennis and Sieg, Holger , title =. Journal of Political Economy , year =
-
[40]
arXiv preprint arXiv:1707.06347 , year=
Proximal policy optimization algorithms , author=. arXiv preprint arXiv:1707.06347 , year=
-
[41]
Conditional logit analysis of qualitative choice behavior , author=
-
[42]
2015 , howpublished =
2015
Reviewed August 10, 2026 · model on record in the stance chip above.
Discussion (0). Continue with ORCID to comment.