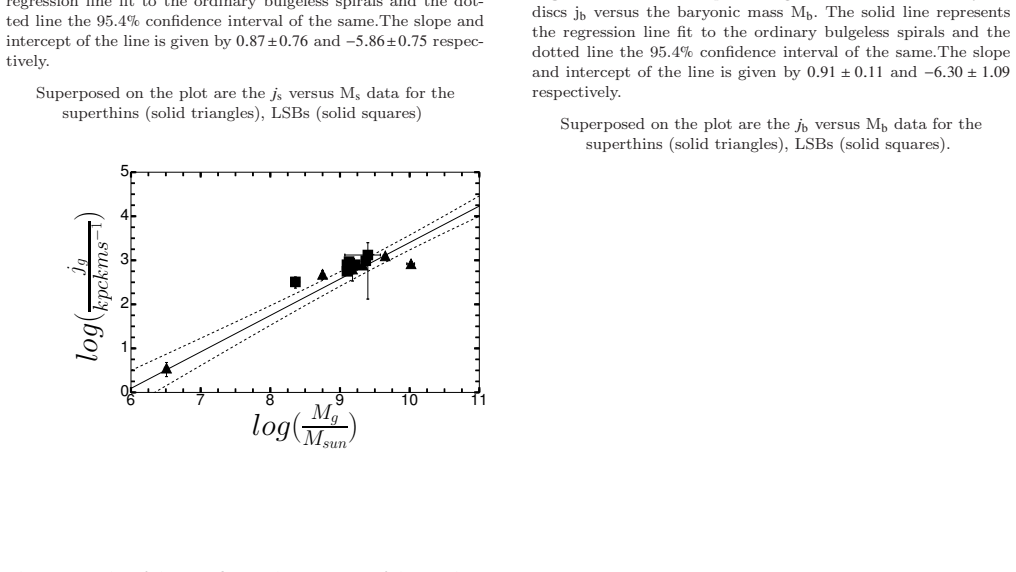
The specific angular momenta of superthin galaxies: Cue to their origin?
Pith reviewed 2026-05-25 17:10 UTC · model grok-4.3
The pith
Superthin galaxies show higher stellar specific angular momentum and disc sizes than ordinary bulgeless discs.
A machine-rendered reading of the paper's core claim, the machinery that carries it, and where it could break.
Core claim
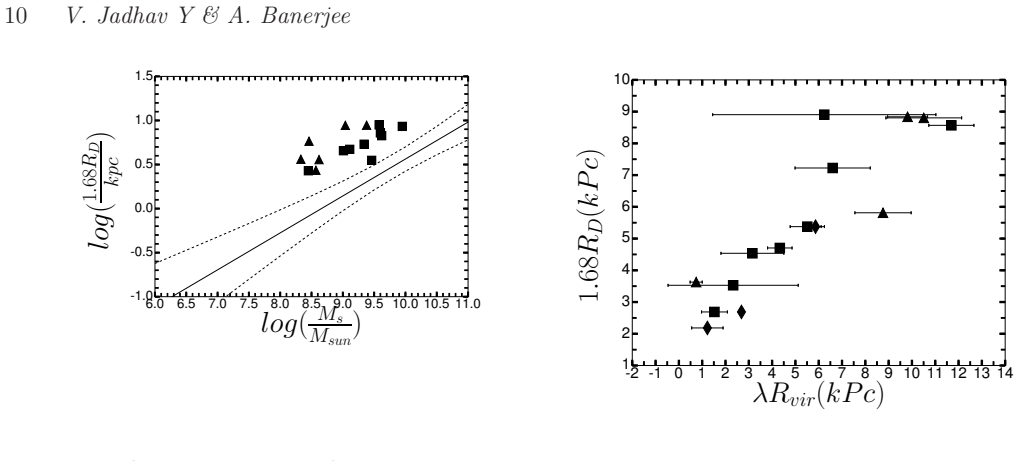
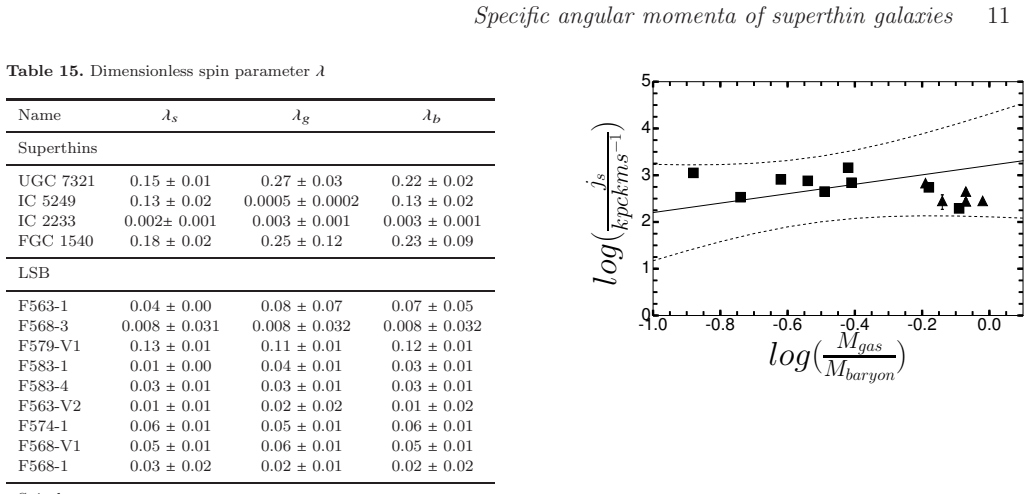
Superthin galaxies may be distinguished by a characteristically larger disc size which could possibly explain the origin of its large planar-to-vertical axes ratio. The median spin parameter λ equals 0.13 plus or minus 0.01 for superthin galaxies, an order of magnitude higher than those of LSBs and ordinary disc galaxies.
What carries the argument
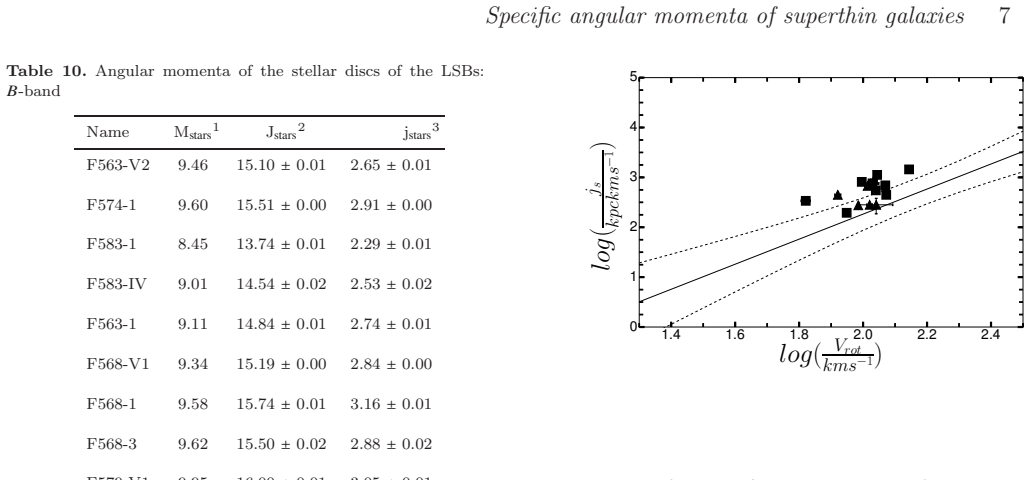
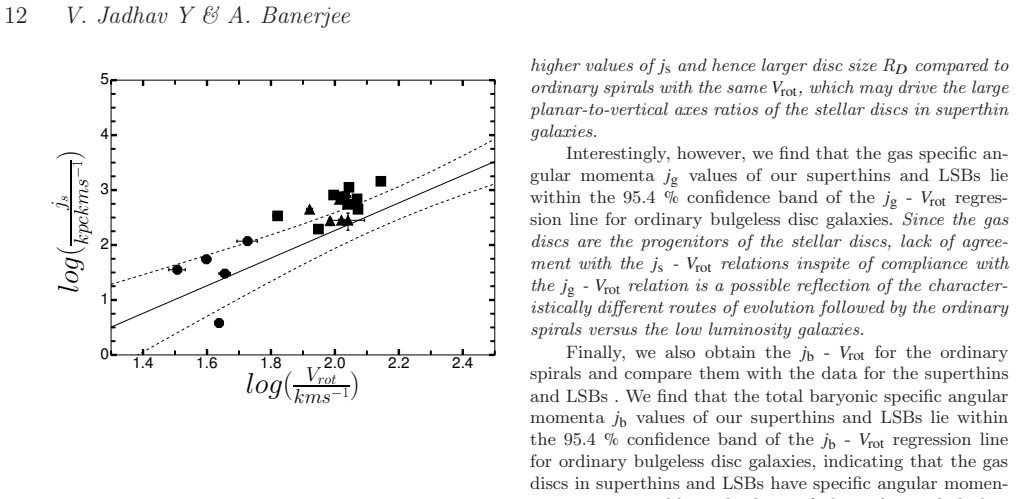
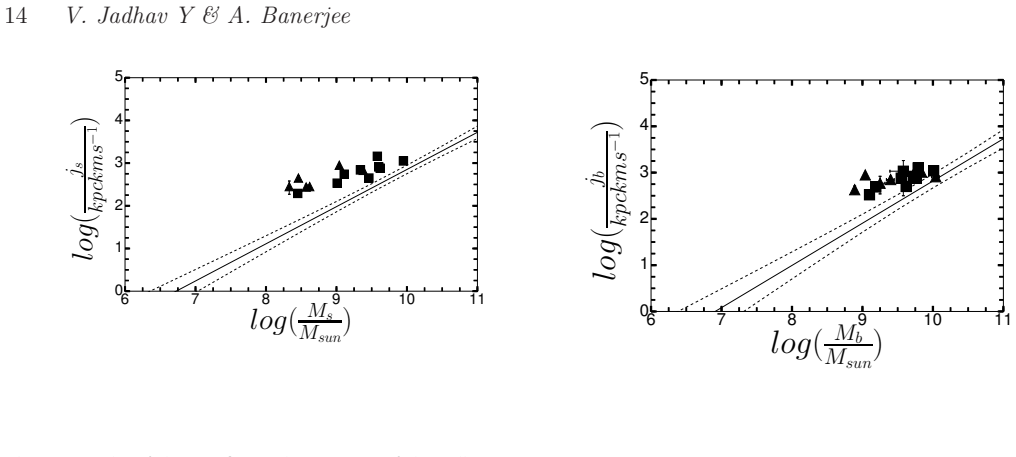
The stellar specific angular momentum j_s, computed from photometry and HI data, which sets the exponential disc scale length R_D and is tested against the j_s-V_rot and j_s-M_s relations for ordinary galaxies.
If this is right
- Superthins and many LSBs possess larger disc sizes at given stellar mass than ordinary bulgeless discs.
- The high b/a ratio of superthins can arise from this enlarged disc size rather than from other structural factors.
- Superthin galaxies exhibit a median spin parameter λ of 0.13 plus or minus 0.01.
- The elevated λ values point to distinct formation conditions for superthins relative to LSBs and ordinary discs.
Where Pith is reading between the lines
- Galaxy formation simulations may need to produce a subset of low-density discs with unusually high angular momentum to match the observed superthin population.
- Measuring λ for a larger sample of superthins could test whether the high value is a defining property of the class.
- The offset in j_s may correlate with environment or accretion history in ways that current samples cannot yet resolve.
Load-bearing premise
The regression relation and 95.4 percent confidence band derived from ordinary bulgeless disk galaxies constitute the correct null hypothesis against which superthins and LSBs are compared.
What would settle it
A re-analysis of the same galaxies using uniform methods for measuring V_rot and M_s that places the superthin j_s values inside the 95.4 percent confidence band of the ordinary-galaxy relation.
Figures
read the original abstract
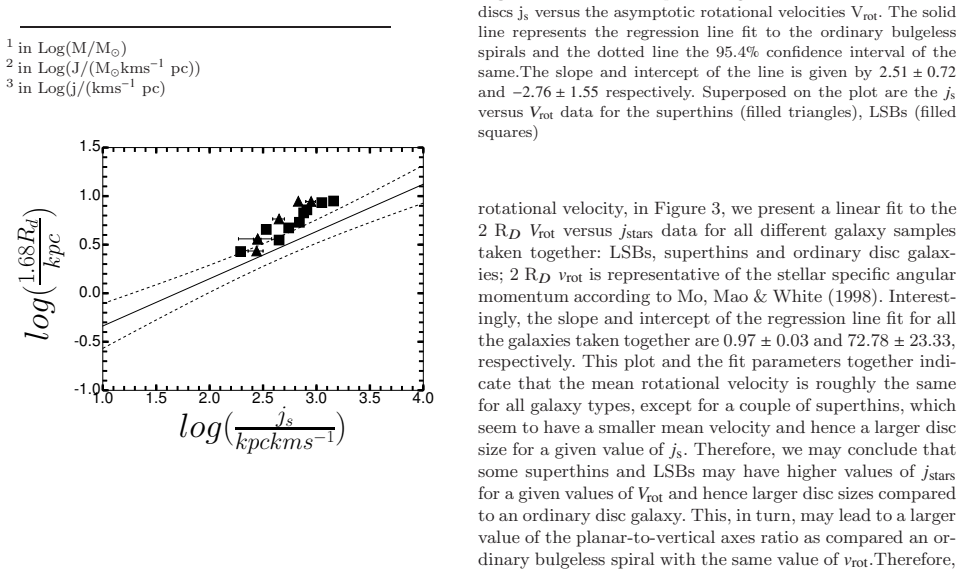
Superthin galaxies are low surface brightness (LSB) bulgeless disc galaxies having stellar discs with unusually high planar-to-vertical axes ratio $b/a$ $>$ 10 - 20, the formation and evolution of which is not well-understood. We calculate the specific angular momenta of a sample of six superthins and nine other bulgeless LSBs using stellar photometry, atomic hydrogen (HI) surface density and high resolution HI rotation curves available in the literature. We find that the stellar specific angular mometum $j_{\rm{s}}$, and hence the stellar disc size given by the exponential stellar disc scale length R$_D$, of three superthins and seven LSBs lie above the 95.4 $\%$ confidence band of the $j_{\rm{s}}$ - $V_{\rm{rot}}$ regression line for ordinary bulgeless disc galaxies, $V_{\rm{rot}}$ being the asymptotic rotational velocity. Further, we find that superthins and LSBs have higher $j_{\rm{s}}$ and R$_D$ values for a given value of stellar mass $M_{\rm{s}}$ at high values of statistical significance, compared to ordinary disc galaxies. Therefore, we conclude, a superthin is may be distinguished by a characteristically larger disc size which could possibly explain the origin of its large planar-to-vertical axes ratio. Interestingly, we find that the median spin parameter $\lambda = \frac{ j_{\rm{stars}} } { {\sqrt(2) V_{\rm{vir}} R_{\rm{vir}} } }$, $V_{\rm{vir}}$ and $R_{\rm{vir}}$ being the virial velocity and virial radius of the galaxy respectively, is 0.13 $\pm$ 0.01 for superthin galaxies which is an order of magnitude higher than those of LSBs and ordinary disc galaxies, which may have important implications for the existence of superthin stellar discs in these low surface brightness galaxies.
Editorial analysis
A structured set of objections, weighed in public.
Referee Report
Summary. The manuscript compiles literature HI rotation curves, stellar photometry and HI surface densities for six superthin galaxies and nine bulgeless LSBs. It reports that three superthins and seven LSBs lie above the 95.4% confidence band of the j_s–V_rot regression for ordinary bulgeless discs, that both populations show statistically higher j_s and R_D at given M_s, and that the median spin parameter λ = j_stars / (√2 V_vir R_vir) equals 0.13 ± 0.01 for the superthins—an order of magnitude above the values for LSBs and ordinary discs—suggesting that characteristically larger disc sizes may explain the extreme b/a ratios.
Significance. If the elevated angular-momentum result survives verification of cross-sample measurement consistency, the work would supply a quantitative clue to the origin of superthin discs and would constrain angular-momentum acquisition in low-surface-brightness environments. The compilation of existing high-resolution HI data provides a useful first statistical indication, though the small sample (n=6) and reliance on heterogeneous literature values limit immediate impact.
major comments (3)
- [Results section (comparison to regression)] The central claim that three superthins and seven LSBs lie above the 95.4% confidence band of the ordinary-bulge-less-disc j_s–V_rot regression (and that both populations have higher j_s, R_D at fixed M_s) is load-bearing; the manuscript provides no demonstration that asymptotic V_rot, stellar-mass M_s and the radial integration yielding j_s are extracted on an equivalent footing between the superthin/LSB literature compilations and the separate ordinary-disc regression baseline. Systematic differences in velocity extraction, M/L ratios or radial weighting would shift the points relative to the band without reflecting an intrinsic difference.
- [Spin-parameter paragraph (abstract and discussion)] The reported median λ = 0.13 ± 0.01 (n=6) is an order of magnitude higher than literature values for LSBs and ordinary discs; the calculation adopts the standard definition but supplies neither the explicit V_vir–R_vir conversion adopted for these low-surface-brightness systems nor any sensitivity test to halo-mass assumptions, both of which are critical for the claimed offset.
- [Methods / sample description] No error budgets, sample-selection criteria or robustness checks against distance, inclination or M/L uncertainties are presented, despite the statistical offsets depending entirely on the compiled quantities.
minor comments (2)
- [Abstract] Abstract contains typographical errors: 'mometum' → 'momentum'; 'a superthin is may be' → 'a superthin may be'.
- [Spin-parameter definition] Notation for the spin-parameter denominator (√2 V_vir R_vir) should be explicitly justified or referenced to the standard definition used in the literature.
Simulated Author's Rebuttal
We thank the referee for the constructive comments on our manuscript. We address each major comment point by point below, noting the revisions that will be incorporated.
read point-by-point responses
-
Referee: [Results section (comparison to regression)] The central claim that three superthins and seven LSBs lie above the 95.4% confidence band of the ordinary-bulge-less-disc j_s–V_rot regression (and that both populations have higher j_s, R_D at fixed M_s) is load-bearing; the manuscript provides no demonstration that asymptotic V_rot, stellar-mass M_s and the radial integration yielding j_s are extracted on an equivalent footing between the superthin/LSB literature compilations and the separate ordinary-disc regression baseline. Systematic differences in velocity extraction, M/L ratios or radial weighting would shift the points relative to the band without reflecting an intrinsic difference.
Authors: The referee is correct that explicit cross-sample consistency checks are needed to support the load-bearing claim. While the literature sources for the superthin and LSB samples employ high-resolution HI curves and standard radial integration methods comparable to those underlying the ordinary-disc regression, the manuscript does not demonstrate this equivalence in detail. We will add a subsection (or table) in the Methods/Results that lists the exact sources, velocity extraction procedures, M/L assumptions, and radial weighting for each quantity, together with a brief discussion of why systematic shifts are unlikely to explain the offsets. revision: yes
-
Referee: [Spin-parameter paragraph (abstract and discussion)] The reported median λ = 0.13 ± 0.01 (n=6) is an order of magnitude higher than literature values for LSBs and ordinary discs; the calculation adopts the standard definition but supplies neither the explicit V_vir–R_vir conversion adopted for these low-surface-brightness systems nor any sensitivity test to halo-mass assumptions, both of which are critical for the claimed offset.
Authors: We will revise the spin-parameter section to supply the explicit conversion: V_vir and R_vir are obtained from the baryonic Tully-Fisher relation to estimate halo mass, followed by standard NFW halo relations at the adopted cosmology. A sensitivity analysis varying halo concentration and mass-to-light ratio by ±20 % will be added to show that the median λ remains an order of magnitude above comparison values under these variations. revision: yes
-
Referee: [Methods / sample description] No error budgets, sample-selection criteria or robustness checks against distance, inclination or M/L uncertainties are presented, despite the statistical offsets depending entirely on the compiled quantities.
Authors: We agree that these elements are required. The revised manuscript will expand the Methods section to state the sample-selection criteria (bulgeless LSBs with b/a > 10), provide error budgets for distance, inclination, and M/L, and include robustness checks in which these parameters are varied within their uncertainties to confirm that the reported j_s and R_D offsets remain statistically significant. revision: yes
Circularity Check
No significant circularity; derivations are independent computations from external data
full rationale
The paper computes stellar specific angular momentum j_s directly from stellar photometry, HI surface densities and rotation curves using standard integration methods. The j_s–V_rot regression baseline and 95.4% confidence band are taken from separate literature on ordinary bulgeless discs. The spin parameter λ is evaluated from its textbook definition λ = j_stars / (√2 V_vir R_vir) with V_vir, R_vir obtained via standard halo scaling relations. None of these steps reduce by construction to the target claims (outlier status of superthins, higher median λ); all quantities are measured or cited externally. No self-citations, fitted inputs renamed as predictions, or self-definitional loops appear in the reported chain.
Axiom & Free-Parameter Ledger
free parameters (1)
- regression slope and intercept of j_s versus V_rot for ordinary bulgeless disks
axioms (2)
- domain assumption Published high-resolution HI rotation curves accurately represent the circular velocity at all radii needed for stellar specific angular momentum integration.
- domain assumption Stellar mass M_s and exponential scale length R_D are reliably recovered from optical photometry without significant dust or population corrections.
Reference graph
Works this paper leans on
- [1]
- [2]
- [3]
-
[4]
Bizyaev, D. V., Kautsch, S. J., Sotnikova, N. Ya., Reshet- nikov, V. P., Mosenkov, A. V., 2017, MNRAS, 465, 3784
work page 2017
- [5]
- [6]
-
[7]
Chowdhury, A., Chengalur, J. N. 2017, MNRAS, 467, 3856
work page 2017
-
[8]
Schneider, D. P. 1997, AJ, 114, 2178 Efstathiou G., Lake G., Negroponte J., 1982, MNRAS, 199, 1069
work page 1997
-
[9]
Garg, P. & Banerjee, A. 2017, MNRAS, Ghosh S., Jog, C. J. 2014, MNRAS, 439, 929
work page 2017
-
[10]
Pakmor, R., Campbell, D. J. R., Jenkins, A. 2016, MNRAS, 459, 199 Karachentsev I., 1989, AJ, 97, 1566
work page 2016
-
[11]
Makarov, D. I., Melnyk, O. V. 2016, AstBu, 71, 1 Kautsch S. J., 2009, PASP, 121, 1297 Khoperskov A., Bizyaev D., Tiurina N., Butenko M., 2010, Astron. Nachr., 331, 731
work page 2016
-
[12]
Kurapati, S., Chengalur, J.N., & Pustilnik, S. 2018, MN- RAS, 479, 228
work page 2018
- [13]
-
[14]
Wilcots, E. M. 2000, BAAS, 32, 1459
work page 2000
-
[15]
Obreschkow, D., Glazebrook, K. 2014, ApJ, 784, 26 O’Brien J. C., Freeman, K. C., van der Kruit, P. C. 2010c, A&A, 515, 62
work page 2014
-
[16]
N., Banerjee, A., Chengalur, J.N
Patra, N. N., Banerjee, A., Chengalur, J.N. & Begum, A. 2014, MNRAS, 479, 5686 Peebles P. J. E., 1969, ApJ, 155, 393
work page 2014
-
[17]
Posti, L., Pezzulli, G., Fraternali, F., Di Teodoro, E. M. 2018, MNRAS, 475, 232
work page 2018
-
[18]
Posti, L., Fraternali, F., di Teodoro, E., Pezzulli, G. 2018 , arXiv180404663
work page 2018
-
[19]
Qu, Y., Di Matteo, P., Lehnert, M. D., van Driel, W. 2011, A&A, 399, 879
work page 2011
-
[20]
Rosenbaum, S. D., Krusch, E., Bomans, D. J., Dettmar, R.-J. 2009, A&A, 504, 807
work page 2009
-
[21]
Uson, Juan M., Matthews, L. D. 2003, AJ, 125, 2455
work page 2003
-
[22]
Velazquez, H., White, S. D. M. 1999, MNRAS, 304, 254
work page 1999
-
[23]
Walker, I. R., Mihos, J. C., Hernquist, L. 1996, ApJ, 460, 121 White S. D. M., 1984, ApJ, 286, 38
work page 1996
-
[24]
Zoldan, A., De Lucia, G., Xie, L., Fontanot, F., Hirschmann, M. 2018, arXiv180308056
work page 2018
-
[25]
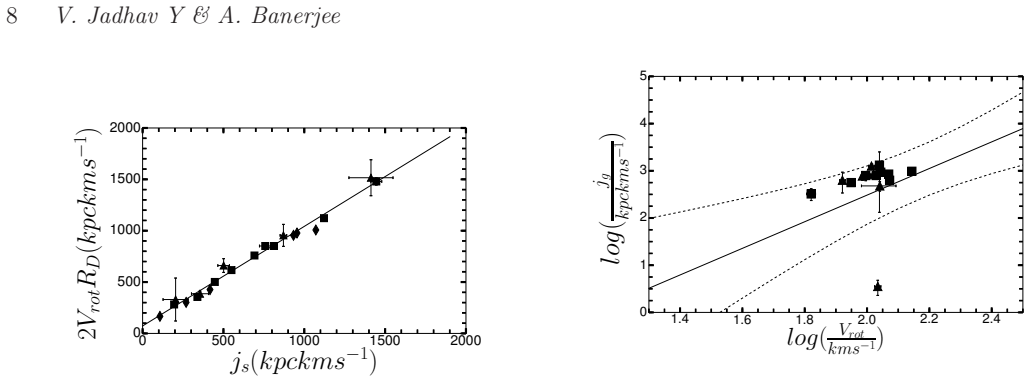
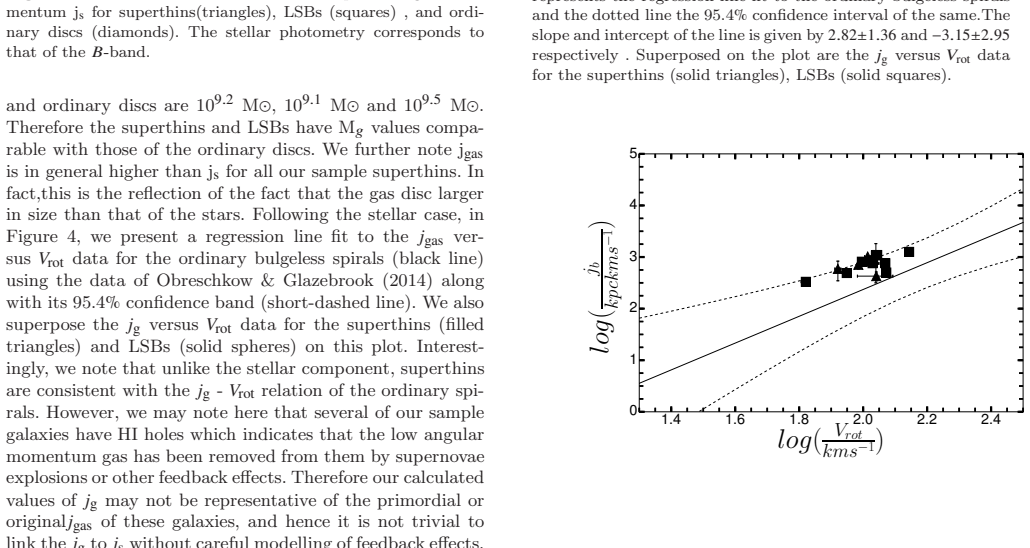
2011, ApJ, 740, 35 APPENDIX We study the Fall relation (1983) i.e
Kamphuis, P. 2011, ApJ, 740, 35 APPENDIX We study the Fall relation (1983) i.e. the correlation betwe en specific angular momentum and disc mass in the stellar, gas and baryonic discs in our superthin and LSB samples. In Figure 10, we plot the regression line fit to the js - Ms data along with the 2- σor 95.4 % confidence band for the ordi- nary discs, and s...
work page 2011
discussion (0)
Sign in with ORCID, Apple, or X to comment. Anyone can read and Pith papers without signing in.