Christian Horrebow's Sunspot Observations -- II. Construction of a Record of Sunspot Positions
Pith reviewed 2026-05-25 15:31 UTC · model grok-4.3
The pith
A record of sunspot positions from 1761 and 1764-1777 yields a butterfly diagram with the standard structure.
A machine-rendered reading of the paper's core claim, the machinery that carries it, and where it could break.
Core claim
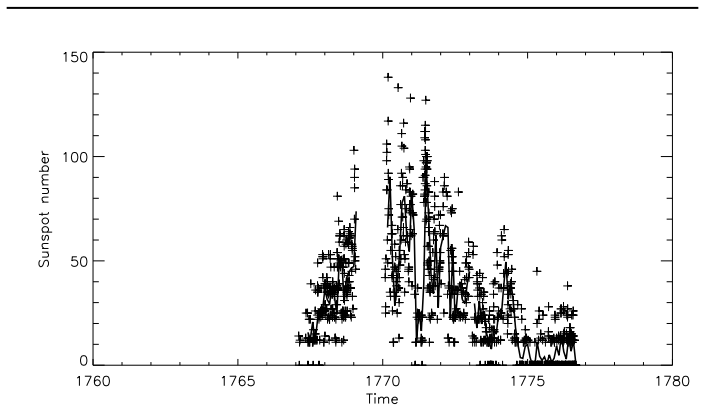
A complete record of sunspot positions is constructed from the notebooks covering 1761 and 1764-1777, and the resulting butterfly diagram shows the characteristic structure known from observations in the 19th and 20th century, with some indications of equatorial sunspots in Cycle 1 but none in the better-covered Cycle 2.
What carries the argument
Extraction of quantitative latitude and longitude values from the notebook entries on observed sunspot locations.
If this is right
- The butterfly diagram pattern of spots migrating toward the equator was already operating in the mid-18th century.
- Spot locations during these cycles can be used to study solar variability and Sun-Earth links before the 19th century.
- Cycle 1 shows possible equatorial spots while Cycle 2 does not, suggesting possible cycle-to-cycle differences.
Where Pith is reading between the lines
- Combining this record with other 18th-century observations could push the butterfly diagram back further in time.
- The lack of equatorial spots in Cycle 2 might reflect real differences in how that cycle behaved rather than data limits.
- The position data could be tested against early magnetic or auroral records to check consistency of solar activity patterns.
Load-bearing premise
The notebook entries contain enough quantitative detail to compute sunspot positions accurately enough to show the butterfly pattern without large systematic errors from the original observations or later copying.
What would settle it
Recalculation of positions from the same notebooks that produces a diagram lacking clear equatorward migration or dominated by random scatter would show the record cannot support the claimed structure.
Figures


read the original abstract
The number of spots on the surface of the Sun is one of the best tracers of solar variability we have. The sunspot number is not only known to change in phase with the 11-year solar cycles, but also to show variability on longer time scales. It is, however, not only the sunspot number that changes in connection with solar variability. The location of the spots on the solar surface is also known to change in phase with the 11-year solar cycle. This has traditionally been visualised in the so-called butterfly diagram, but this is only well constrained from the beginning of the 19th century. This is unfortunate, as knowledge about the butterfly diagram could aid our understanding of the variability and the Sun-Earth connection. As part of a larger review of the work done on sunspots by the Danish astronomer Christian Horrebow, we here present a reanalysis of Christian Horrebow's notebooks covering the years 1761 and 1764 - 1777. These notebooks have been analysed in at least three earlier studies by Thiele (Astron. Nachr. 50, 257, 1859), d'Arrest (published in Wolf, Astron. Mitt. Eidgenoss. Sternwarte Zur. 4, 77, 1873) and Hoyt and Schatten (Solar Phys. 160, 387, 1995). In this article, we construct a complete record of sunspot positions covering the years 1761 and 1764 - 1777. The resulting butterfly diagram shows the characteristic structure known from observations in the 19th and 20th century. We do see some indications of equatorial sunspots in the observations we have from Cycle 1. However, in Cycle 2, which has much better coverage, we do not see such indications.
Editorial analysis
A structured set of objections, weighed in public.
Referee Report
Summary. The paper reanalyzes Christian Horrebow's sunspot observation notebooks covering 1761 and 1764-1777 (building on prior work by Thiele, d'Arrest, and Hoyt & Schatten) to construct a record of sunspot heliographic positions. The resulting butterfly diagram is reported to exhibit the characteristic latitudinal migration structure known from 19th- and 20th-century observations, with some indications of equatorial spots during Cycle 1 but none during the better-sampled Cycle 2.
Significance. If the derived positions prove reliable, the work would extend the butterfly diagram record by several decades into the 18th century, providing new constraints on solar-cycle behavior and dynamo models during a period with sparse direct observations. The reprocessing of primary notebook sources is a clear strength, as is the explicit comparison to the known structure of later cycles.
major comments (2)
- [Abstract] Abstract: the central claim that a 'complete record of sunspot positions' has been constructed and that the butterfly diagram reliably shows characteristic structure is not supported by any quantitative error estimates, validation against independent data, or description of the coordinate-conversion pipeline; without these, it is impossible to assess whether systematic offsets from position-angle determination or transcription dominate the reported latitudinal distribution.
- [Methods (position derivation)] The weakest assumption (notebook entries yield latitudes/longitudes with errors ≪ spot-zone width) is load-bearing for distinguishing real Cycle-1 equatorial spots from artifacts, yet no section quantifies the contribution of unaccounted differential rotation, drawing-scale uncertainty, or orientation errors to the final positions.
minor comments (1)
- [Abstract] The abstract would benefit from a single sentence summarizing the conversion method and any cross-checks performed against the earlier Thiele/d'Arrest reductions.
Simulated Author's Rebuttal
We thank the referee for the careful reading and constructive comments, which highlight areas where the manuscript can be strengthened by additional methodological detail. We agree that the current version lacks sufficient description of the position-derivation pipeline and quantitative error analysis, and we will revise the paper accordingly.
read point-by-point responses
-
Referee: [Abstract] Abstract: the central claim that a 'complete record of sunspot positions' has been constructed and that the butterfly diagram reliably shows characteristic structure is not supported by any quantitative error estimates, validation against independent data, or description of the coordinate-conversion pipeline; without these, it is impossible to assess whether systematic offsets from position-angle determination or transcription dominate the reported latitudinal distribution.
Authors: We accept the point that the abstract overstates the completeness and reliability without supporting detail. In the revised manuscript we will (i) add a dedicated Methods section describing the full coordinate-conversion pipeline from notebook entries (including measurement of position angles, drawing scales, and conversion to heliographic coordinates), (ii) provide quantitative estimates of uncertainties from transcription, orientation, and scale errors, and (iii) revise the abstract to state that a record has been constructed from the notebooks while noting the remaining limitations. Direct validation against fully independent modern data is not feasible for this epoch; we will instead expand the comparison with the earlier reductions of Thiele, d'Arrest, and Hoyt & Schatten. revision: yes
-
Referee: [Methods (position derivation)] The weakest assumption (notebook entries yield latitudes/longitudes with errors ≪ spot-zone width) is load-bearing for distinguishing real Cycle-1 equatorial spots from artifacts, yet no section quantifies the contribution of unaccounted differential rotation, drawing-scale uncertainty, or orientation errors to the final positions.
Authors: We agree that a quantitative error budget is required to evaluate the Cycle-1 equatorial spots. The revised manuscript will include an explicit uncertainty analysis that estimates the contributions from drawing-scale uncertainty, orientation errors, and any residual effects of differential rotation (noting that positions are derived from individual drawings rather than long-term tracking). This section will allow readers to judge whether the reported latitudinal distribution is robust relative to the spot-zone width. revision: yes
- Validation against fully independent, high-precision position data from the same epoch is not possible, as no such contemporaneous records exist beyond the historical reductions already cited.
Circularity Check
No significant circularity; position record derived from primary notebook data
full rationale
The paper constructs sunspot latitudes and longitudes directly from Horrebow's 18th-century notebook entries via a coordinate-conversion pipeline, then plots the resulting positions to produce a butterfly diagram. This output is compared to (but not derived from) the known 19th-20th century pattern. The three cited prior analyses (Thiele 1859, d'Arrest 1873, Hoyt & Schatten 1995) are by unrelated authors and function only as historical context; none supply load-bearing parameters, uniqueness theorems, or ansatzes that the present work reduces to. No self-citations, fitted inputs renamed as predictions, or self-definitional steps appear. The derivation chain is therefore self-contained against the external notebook source.
Axiom & Free-Parameter Ledger
axioms (1)
- domain assumption Horrebow's notebook entries contain sufficient information to determine sunspot positions with accuracy adequate to reveal the butterfly-diagram structure
Reference graph
Works this paper leans on
- [1]
- [2]
-
[3]
Arlt, R., Senthamizh Pavai, V., Schmiel, C., and Spada, F. 2016, Astron. Astrophys., 595, A104
work page 2016
- [4]
- [5]
-
[6]
Hathaway, D. H. 2015, Living Rev. Solar Phys., 12, 4
work page 2015
- [7]
-
[8]
Hoyt, D. V., Schatten, K. H. 1998b, Solar Phys., 181, 491 Jørgensen, C. S., Karoff, C., Senthamizh Pavai, V., Rainer, A. 2019, Paper I, Solar Phys., xxx, xxx Karoff, C., Inceoglu, F., Knudsen, M. F., Olsen, J., Fogtmann-Schulz, A. 2015, Astron. Astrophys., 575, A77 Neuh¨ auser, R., Neuh¨ auser, D. L. 2016, Astronomische Nachrichten, 337, 581 Neuh¨ auser, R....
work page 2019
-
[9]
Pedersen, K. M., Schneider, A. 2018, Dansk Biografisk Leksikon, 3, Gyldendal 1979-84, http://denstoredanske.dk/index.php?sideId=286236 Senthamizh Pavai, V., Arlt, R., Dasi-Espuig, M., Krivova, N. A., Solanki, S. K. 2015, Astron. Astrophys., 584, A73 Senthamizh Pavai, V., Arlt, R., Diercke, A., Denker, C., Vaquero, J. M. 2016, Adv. Space Res., 58, 1468
work page 2018
-
[10]
Svalgaard, L., Schatten, K. H. 2016, Solar Phys., 291, 2653
work page 2016
-
[11]
Thiele, T. N. 1859, Astronomische Nachrichten, 50, 257 SOLA: Karoff_v3.tex; 27 June 2019; 0:36; p. 17
work page 2019
-
[12]
G., Mursula, K., Arlt, R., Kovaltsov, G
Usoskin, I. G., Mursula, K., Arlt, R., Kovaltsov, G. A. 2009, Astrophys. J., 700, L154
work page 2009
-
[13]
Wolf, R. 1873, Astronomische Mitteilungen der Eidgen¨ ossischen Sternwarte Zurich, 4, 77 SOLA: Karoff_v3.tex; 27 June 2019; 0:36; p. 18
work page 2019
discussion (0)
Sign in with ORCID, Apple, or X to comment. Anyone can read and Pith papers without signing in.