Teaching Split Plot Experiments With a Boomerang Tin
Pith reviewed 2026-05-24 16:30 UTC · model grok-4.3
The pith
A boomerang tin toy supplies a hands-on setup for teaching split-plot experimental designs.
A machine-rendered reading of the paper's core claim, the machinery that carries it, and where it could break.
Core claim
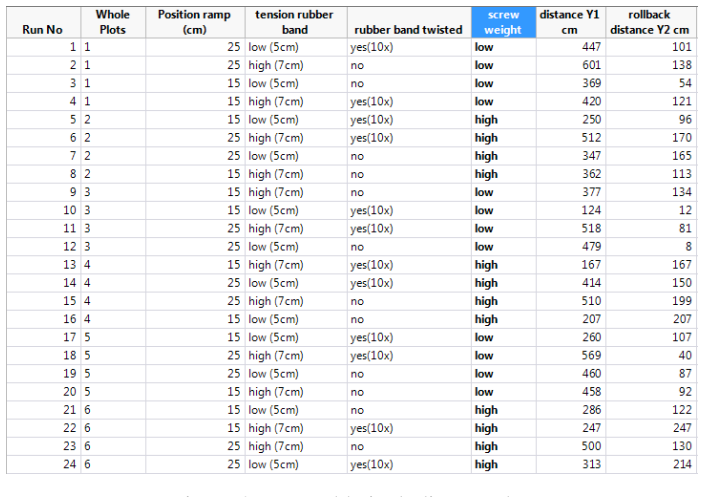
The boomerang tin experiment sets up whole-plot factors that are costly to reset and subplot factors that can be varied more easily, then analyzes the resulting data with the appropriate mixed model to illustrate the split-plot structure for teaching purposes.
What carries the argument
The rubber-band energy mechanism that separates hard-to-change whole-plot factors from easier-to-vary subplot factors.
If this is right
- Instructors obtain a ready-to-use example that includes the physical setup, design matrix, and analysis code.
- Students experience the cost of resetting whole plots in real time rather than only in abstract terms.
- The same toy can be reused across multiple class sessions to compare different design choices.
- Analysis results can be discussed immediately after data collection while the physical process is still fresh.
Where Pith is reading between the lines
- The method could extend to other toys or devices where some controls are physically harder to adjust than others.
- Similar classroom props might help teach related topics such as blocking or repeated measures.
- If the toy is inexpensive and portable, it lowers the barrier for statistics courses that lack access to industrial equipment.
Load-bearing premise
The toy produces measurable responses whose variance cleanly separates into whole-plot and subplot error terms without extra mechanical noise.
What would settle it
Re-running the described design and finding that a single-error-term model fits the data as well as the split-plot model, or that the two variance components cannot be distinguished.
Figures


read the original abstract
This article presents an example on how to teach split-plot experimental designs based on a hands-on exercise. This is a toy called boomerang tin which utilizes a rubber band to store and release energy. The set up and mechanisms of the hands-on example are explained followed by a description of how it can be leveraged in teaching split plot DoE. An actual design is set up, analyzed and discussed to provide reference for its usage in class.
Editorial analysis
A structured set of objections, weighed in public.
Referee Report
Summary. The manuscript presents a hands-on teaching example for split-plot experimental designs using a boomerang tin toy that stores and releases energy via a rubber band. It describes the toy's setup and mechanisms, explains its use in illustrating split-plot DoE, and provides details of an actual experimental design that was set up, run, and analyzed to serve as a classroom reference.
Significance. If the physical responses separate whole-plot and subplot error strata as intended, the example supplies a concrete, low-cost classroom activity that can help students distinguish error terms in split-plot structures; such tangible demonstrations are useful additions to statistics education literature when they are reproducible.
minor comments (2)
- The description of the actual design (factors, levels, response variable, and analysis output) is referenced but would benefit from explicit listing of the whole-plot and subplot factors and the model equation used, to facilitate direct replication by instructors.
- Figure captions and any tables summarizing the ANOVA or variance components should be checked for self-contained clarity so that readers can interpret the error-strata separation without returning to the main text.
Simulated Author's Rebuttal
We thank the referee for the positive review and recommendation to accept the manuscript.
Circularity Check
No significant circularity
full rationale
The paper is a purely descriptive teaching note that presents a hands-on classroom exercise with a boomerang tin to illustrate split-plot experimental design structure. It describes the physical setup, the actual design that was run, the analysis performed, and how the example can be used in class. No model derivation, quantitative prediction, uniqueness theorem, or fitted parameter is advanced; the central claim is simply that the exercise can be used for teaching. Because no derivation chain exists, no step reduces to its own inputs by construction, self-citation, or renaming.
Axiom & Free-Parameter Ledger
Reference graph
Works this paper leans on
-
[1]
Annis, D. H. (2005). Rethinking the paper helicopter: Combining statistical and engineering knowledge. The American Statistician 59(4), 320–326
work page 2005
-
[2]
Antony, J. (2002). Training for design of experiments using a catapult. Quality and Reliability Engineering International 18, 29–35
work page 2002
-
[3]
Box, G. E. P. (1992). Teaching engineers experimental design with a paper helicopter. Quality Engineering 4(3), 453–459
work page 1992
-
[4]
Box, G. E. P. and P. Y . T. Liu (1999). Statistics as a catalyst to learning by scientific method part i - an example. Journal of Quality Technology 31, 1–15
work page 1999
-
[5]
Fisher, R. (1960). Design of Experiments. Edinburgh: Oliver and Boyd Ltd. 13
work page 1960
-
[6]
Goos, P. (2002). The optimal design of blocked and split plot experiments. Springer
work page 2002
-
[7]
Goos, P. and B. Jones (2011). Optimal Design of Experiments: A Case Study Approach. John Wiles & Sons
work page 2011
-
[8]
Jones, B. and P. Goos (2011, 09). An algorithm for finding d-efficient equivalent-estimation second-order split-plot designs
work page 2011
-
[9]
Jones, B. and C. J. Nachtsheim (2009). Split-plot designs: What, why, and how. Journal of quality technology 41, 340–361
work page 2009
-
[10]
Kowalski, S. M., P. Parker, and G. Vining (2007). Tutorial: Industrial split-plot experiments. Quality Engineering 19, 1–15
work page 2007
-
[11]
Luner, J. L. (1994). Achieving continuous improvement with the dual appproach: A demonstra- tion of the roman catapult. Quality Engineering 6, 6–4. Minitab Inc. (2017). Minitab 18 Statistical Software. State College PA
work page 1994
-
[12]
Montgomery, D. (2009). Design and Analysis of Experiments. Hoboken: Wiley
work page 2009
-
[13]
Press, H. (2002). The little Giant Book of Science Experiments. Sterling Publishing Co. Inc. SAS Institute (2013). JMP 11 Design of Experiments Guide. Cary, NC. SAS Institute Inc. (2015). JMP 11.2. Cary, NC. 14
work page 2002
discussion (0)
Sign in with ORCID, Apple, or X to comment. Anyone can read and Pith papers without signing in.