REVIEW 86 references
Evaluating Perceptual Bias During Geometric Scaling of Scatterplots
T0 review · reviewed 2026-08-14 · deepseek-v4-flash
Pith's one-line read Geometric scaling of scatterplots biases perceived numerosity, correlation, and cluster separation, and the bias grows linearly with the scale ratio.
The pith
A machine-rendered reading of the paper's core claim, the machinery that carries it, and where it could break.
The reading
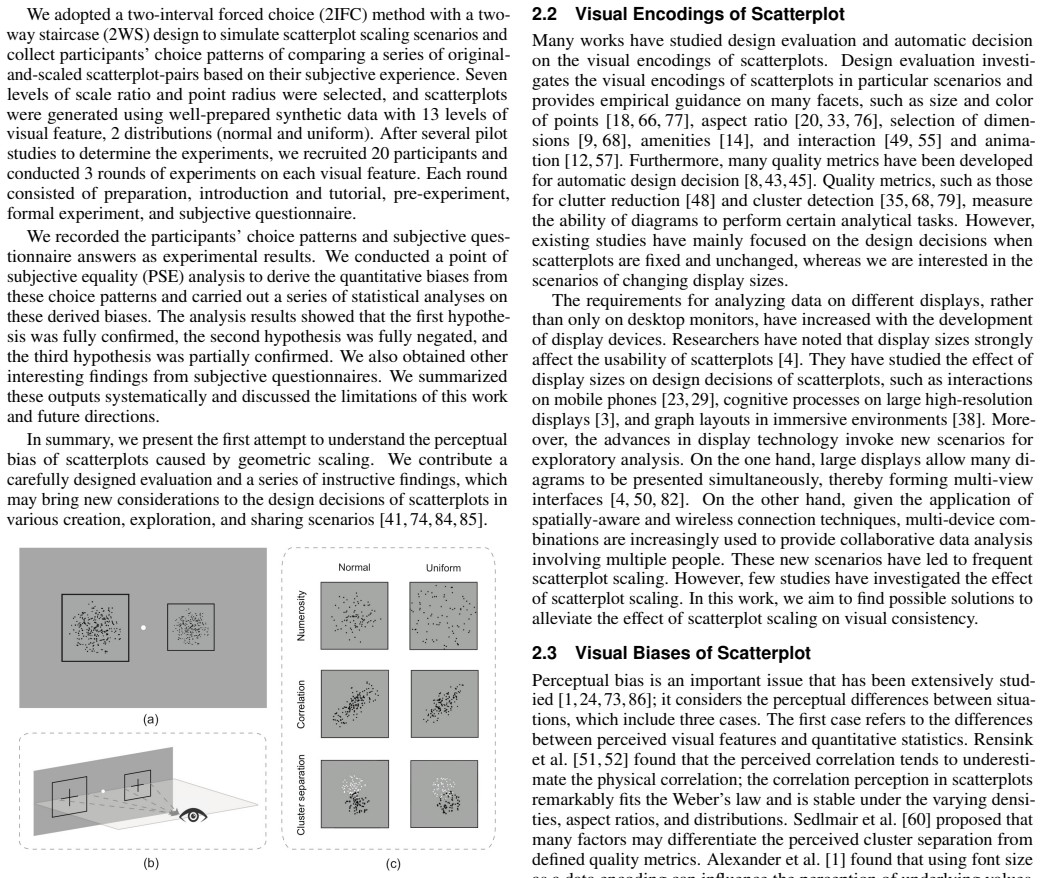
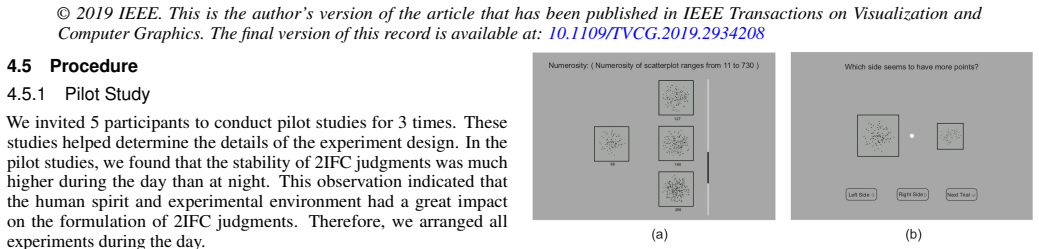
The results showed that scaling changes perception. An enlarged scatterplot seemed to have fewer dots than it really did, while a shrunken one seemed to have more. Similar biases appeared for correlation and cluster separation, and the size of the bias increased steadily with the amount of scaling. The authors also tried changing the dot radius to counteract the bias. Making dots smaller in a shrunken chart, or larger in an enlarged chart, reduced the bias, but only within a certain range and not completely.
They also compared normally distributed and uniformly distributed dot clouds, but found no reliable difference in the bias. The conclusion is that resizing a scatterplot is not a neutral operation: it changes perceived patterns in a predictable, roughly linear way, and dot size offers only limited correction.
Extended reading notes
Core claim
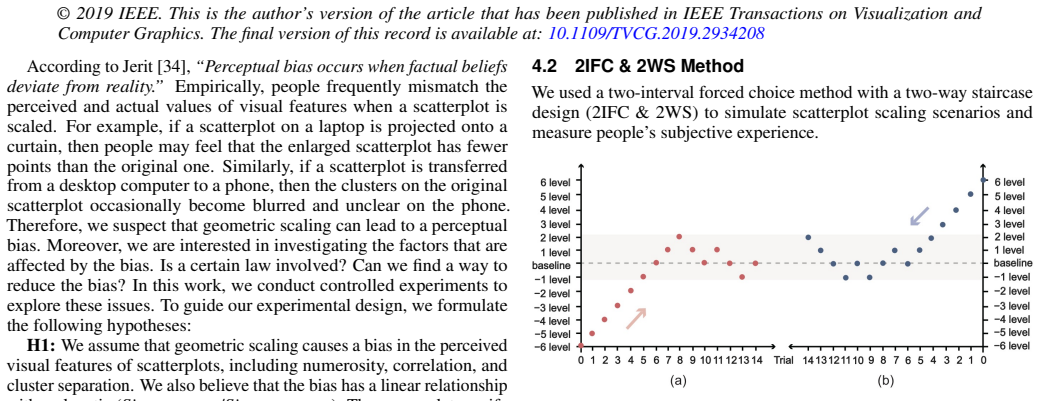
Geometric scaling causes a perceptual bias that has a linear relationship with the scale ratio. The paper states: "the results of fitting index R2 (numerosity: R2 = 0.940 > 0.9; correlation: R2 = 0.969 > 0.9; cluster separation: R2 = 0.920 > 0.9) denote that the bias has a significant linear relationship with the scale ratio for each feature" (Section 5.2, Hypothesis 1). If correct, the bias is a monotonic function of scaling, with direction depending on the visual feature.
Load-bearing premise
The study assumes that perceptual bias measured on a single desktop monitor with stimuli scaled to different visual angles (Section 4.4, fixed 59 cm viewing distance) represents the bias in real multi-device scenarios with different physical screens, resolutions, and viewing distances. The authors acknowledge this: "all scatterplots in the experiments were simplified to be shown on a unified desktop monitor. This practice benefited controllable experiments but reduced the ecological validity" (Section 6). If device-specific rendering modulates the bias, the measured linear relationship may not generalize to the motivating laptop-to-projector or desktop-to-phone scenarios.
Signed reviews
Editorial analysis
A structured set of objections, weighed in public.
Assumptions & free parameters
free parameters (2)
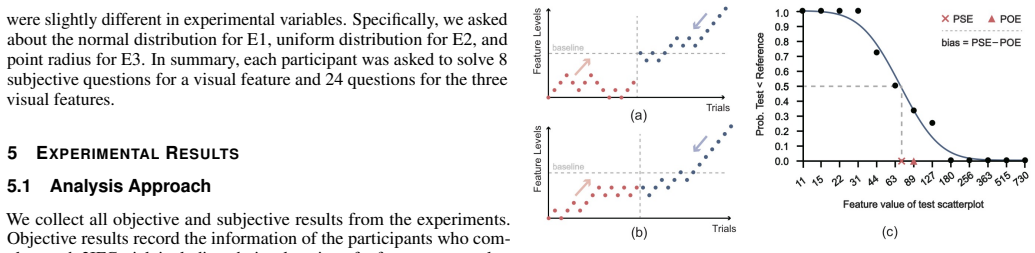
- Linear regression coefficients (slope and intercept) for bias versus scale ratio =
Not reported numerically; R² = 0.940, 0.969, 0.920
- Variance threshold for abnormal sequence identification =
2 (variance of feature levels in 10 essential trials)
assumptions (4)
- domain assumption The 2IFC with 2WS staircase protocol yields a valid and approximately unbiased estimate of the point of subjective equality.
- domain assumption The choice probabilities are adequately described by a cumulative Gaussian psychometric function.
- domain assumption Replacing abnormal choice sequences with the group mean for the same condition does not systematically distort the results.
- domain assumption Perceptual biases measured on a single desktop monitor at fixed viewing distance generalize to real multi-device scaling scenarios.
Cite this review
Pith. "Pith review of Evaluating Perceptual Bias During Geometric Scaling of Scatterplots." pith.science (2026). https://pith.science/paper/UAJQGMWK
@misc{pith2026190800403,
  author       = {Pith},
  title        = {Pith review of: Evaluating Perceptual Bias During Geometric Scaling of Scatterplots},
  year         = {2026},
  howpublished = {\url{https://pith.science/paper/UAJQGMWK}},
  note         = {Machine review of arXiv:1908.00403}
}
read the original abstract
Scatterplots are frequently scaled to fit display areas in multi-view and multi-device data analysis environments. A common method used for scaling is to enlarge or shrink the entire scatterplot together with the inside points synchronously and proportionally. This process is called geometric scaling. However, geometric scaling of scatterplots may cause a perceptual bias, that is, the perceived and physical values of visual features may be dissociated with respect to geometric scaling. For example, if a scatterplot is projected from a laptop to a large projector screen, then observers may feel that the scatterplot shown on the projector has fewer points than that viewed on the laptop. This paper presents an evaluation study on the perceptual bias of visual features in scatterplots caused by geometric scaling. The study focuses on three fundamental visual features (i.e., numerosity, correlation, and cluster separation) and three hypotheses that are formulated on the basis of our experience. We carefully design three controlled experiments by using well-prepared synthetic data and recruit participants to complete the experiments on the basis of their subjective experience. With a detailed analysis of the experimental results, we obtain a set of instructive findings. First, geometric scaling causes a bias that has a linear relationship with the scale ratio. Second, no significant difference exists between the biases measured from normally and uniformly distributed scatterplots. Third, changing the point radius can correct the bias to a certain extent. These findings can be used to inspire the design decisions of scatterplots in various scenarios.
Figures

Figures from the paper (4 more)

Reference graph
Works this paper leans on
-
[1]
Alexander, C.-C
E. Alexander, C.-C. Chang, M. Shimabukuro, S. Franconeri, C. Collins, and M. Gleicher. Perceptual biases in font size as a data encoding. IEEE Transactions on Visualization and Computer Graphics, 24(8):2397–2410, 2017
2017
-
[2]
Allik and T
J. Allik and T. Tuulmets. Occupancy model of perceived numerosity. Perception & Psychophysics, 49(4):303–314, 1991
1991
-
[3]
Andrews, A
C. Andrews, A. Endert, and C. North. Space to Think: Large High- Resolution Displays for Sensemaking. In Proceedings of the SIGCHI conference on human factors in computing systems , pp. 55–64. ACM, 2010
2010
-
[4]
Andrews, A
C. Andrews, A. Endert, B. Yost, and C. North. Information visualization on large, high-resolution displays: Issues, challenges, and opportunities. Information Visualization, 10(4):341–355, 2011
2011
-
[5]
Anobile, G
G. Anobile, G. M. Cicchini, and D. C. Burr. Separate Mechanisms for Perception of Numerosity and Density. Psychological Science, 25(1):265– 270, 2014
2014
-
[6]
Anobile, M
G. Anobile, M. Turi, G. M. Cicchini, and D. C. Burr. Mechanisms for perception of numerosity or texture-density are governed by crowding-like effects. Journal of Vision, 15(5):4–4, 2015
2015
- [7]
-
[8]
M. Behrisch, M. Blumenschein, N. W. Kim, L. Shao, M. El-Assady, J. Fuchs, D. Seebacher, A. Diehl, U. Brandes, H. Pfister, et al. Qual- ity Metrics for Information Visualization. Computer Graphics Forum, 37(3):625–662, 2018
work page 2018
Show all 86 references
-
[9]
Bertini, A
E. Bertini, A. Tatu, and D. Keim. Quality Metrics in High-Dimensional Data Visualization: An Overview and Systematization. IEEE Transactions on Visualization and Computer Graphics, 17(12):2203–2212, 2011
2011
-
[10]
Blascheck, L
T. Blascheck, L. Besanc ¸on, A. Bezerianos, B. Lee, and P. Isenberg. Glance- able Visualization: Studies of Data Comparison Performance on Smart- watches. IEEE Transactions on Visualization and Computer Graphics, 25(1):630–640, 2019
2019
-
[11]
M. A. Borkin, Z. Bylinskii, N. W. Kim, C. M. Bainbridge, C. S. Yeh, D. Borkin, H. Pfister, and A. Oliva. Beyond Memorability: Visualiza- tion Recognition and Recall. IEEE Transactions on Visualization and Computer Graphics, 22(1):519–528, 2016
2016
-
[12]
Brehmer and T
M. Brehmer and T. Munzner. A Multi-Level Typology of Abstract Vi- sualization Tasks. IEEE Transactions on Visualization and Computer Graphics, 19(12):2376–2385, 2013
2013
-
[13]
Butscher, S
S. Butscher, S. Hubenschmid, J. M¨uller, J. Fuchs, and H. Reiterer. Clusters, Trends, and Outliers: How Immersive Technologies Can Facilitate the Collaborative Analysis of Multidimensional Data. In Proceedings of the 2018 CHI Conference on Human Factors in Computing Systems, p...
2018
-
[14]
Y .-H. Chan, C. D. Correa, and K.-L. Ma. Flow-based Scatterplots for Sensitivity Analysis. In Proceedings of the 2010 IEEE Symposium on Visual analytics science and technology (VAST), pp. 43–50. IEEE, 2010
2010
-
[15]
H. Chen, W. Chen, H. Mei, Z. Liu, K. Zhou, W. Chen, W. Gu, and K.-L. Ma. Visual abstraction and exploration of multi-class scatterplots. IEEE Transactions on Visualization and Computer Graphics, 20(12):1683–1692, 2014
2014
-
[16]
Chittaro
L. Chittaro. Visualizing Information on Mobile Devices. Computer, 39(3):40–45, 2006
2006
-
[17]
Chung, S
H. Chung, S. L. Chu, and C. North. A comparison of Two Display Models for Collaborative Sensemaking. In Proceedings of the 2nd ACM International Symposium on Pervasive Displays, pp. 37–42. ACM, 2013
2013
-
[18]
W. S. Cleveland and W. S. Cleveland. The Elements of Graphing Data, vol. 2. Wadsworth Advanced Books and Software Monterey, CA, 1985
1985
-
[19]
W. S. Cleveland, P. Diaconis, and R. McGill. Variables on Scatterplots Look More Highly Correlated When the Scales are Increased. Science, 216(4550):1138–1141, 1982
1982
-
[20]
W. S. Cleveland, M. E. McGill, and R. McGill. The Shape Parameter of a Two-variable Graph. Journal of the American Statistical Association, 83(402):289–300, 1988
1988
-
[21]
Conati and H
C. Conati and H. Maclaren. Exploring the Role of Individual Differences in Information Visualization. In Proceedings of the working conference on Advanced visual interfaces, pp. 199–206. ACM, 2008
2008
-
[22]
S. C. Dakin, M. S. Tibber, J. A. Greenwood, M. J. Morgan, et al. A common visual metric for approximate number and density. Proceedings of the National Academy of Sciences, 108(49):19552–19557, 2011
2011
-
[23]
S. M. Drucker, D. Fisher, R. Sadana, J. Herron, et al. TouchViz: A Case Study Comparing Two Interfaces for Data Analytics on Tablets. In Proceedings of the SIGCHI Conference on Human Factors in Computing Systems, pp. 2301–2310. ACM, 2013
-
[24]
G. Ellis. Cognitive Biases in Visualizations. Springer, 2018
2018
-
[25]
Friendly and D
M. Friendly and D. Denis. The Early Origins and Development of The Scatterplot. Journal of the History of the Behavioral Sciences, 41(2):103– 130, 2005
2005
-
[26]
M. A. Garcıa-P´erez. Forced-choice staircases with fixed step sizes: asymp- totic and small-sample properties. Vision Research, 38(12):1861–1881, 1998
1998
-
[27]
Gleicher, M
M. Gleicher, M. Correll, C. Nothelfer, and S. Franconeri. Perception of Av- erage Value in Multiclass Scatterplots.IEEE Transactions on Visualization and Computer Graphics, 19(12):2316–2325, 2013
2013
-
[28]
Gutwin, A
C. Gutwin, A. Cockburn, and A. Coveney. Peripheral Popout: The In- fluence of Visual Angle and Stimulus Intensity on Popout Effects. In Proceedings of the 2017 CHI Conference on Human Factors in Computing Systems, pp. 208–219. ACM, 2017
2017
-
[29]
Gutwin and C
C. Gutwin and C. Fedak. Interacting with Big Interfaces on Small Screens: a Comparison of Fisheye, Zoom, and Panning Techniques. In Proceedings of Graphics Interface 2004 , pp. 145–152. Canadian Human-Computer Communications Society, 2004
2004
-
[30]
Harrison, K
L. Harrison, K. Reinecke, and R. Chang. Infographic aesthetics: Design- ing for the first impression. In Proceedings of the 33rd Annual ACM Conference on Human Factors in Computing Systems , pp. 1187–1190. ACM, 2015
2015
-
[31]
Harrison, F
L. Harrison, F. Yang, S. Franconeri, and R. Chang. Ranking Visualizations of Correlation Using Weber’s Law.IEEE Transactions on Visualization and Computer Graphics, 20(12):1943–1952, 2014
1943
-
[32]
Healey and J
C. Healey and J. Enns. Attention and Visual Memory in Visualization and Computer Graphics. IEEE Transactions on Visualization and Computer Graphics, 18(7):1170–1188, 2012
2012
-
[33]
Heer and M
J. Heer and M. Agrawala. Multi-Scale Banking to 45 Degrees. IEEE Transactions on Visualization and Computer Graphics, 12(5):701–708, 2006
2006
-
[34]
Jerit and J
J. Jerit and J. Barabas. Partisan Perceptual Bias and the Information Environment. The Journal of Politics, 74(3):672–684, 2012
2012
-
[35]
Kandogan
E. Kandogan. Just-in-time Annotation of Clusters, Outliers, and Trends in Point-based Data Visualizations. In Proceedings of the 2012 IEEE Symposium on Visual Analytics Science and Technology (VAST), pp. 73–
2012
-
[36]
Kay and J
M. Kay and J. Heer. Beyond Weber’s Law: A Second Look at Ranking Visualizations of Correlation. IEEE Transactions on Visualization and Computer Graphics, 22(1):469–478, 2016
2016
-
[37]
S. Kim, M. Al-Haj, S. Chen, S. Fuller, U. Jain, M. Carrasco, and R. Tan- nock. Colour vision in ADHD: Part 1-Testing the retinal dopaminergic hypothesis. Behavioral and Brain Functions, 10(1):38, 2014
2014
-
[38]
O.-H. Kwon, C. Muelder, K. Lee, and K.-L. Ma. A Study of Layout, Rendering, and Interaction Methods for Immersive Graph Visualization. IEEE Transactions on Visualization and Computer Graphics, 22(7):1802– 1815, 2016
2016
-
[39]
Li, J.-B
J. Li, J.-B. Martens, and J. J. Van Wijk. Judging correlation from scatter- plots and parallel coordinate plots. Information Visualization, 9(1):13–30, 2010
2010
-
[40]
J. Li, J. J. van Wijk, and J.-B. Martens. A Model of Symbol Lightness Discrimination in Sparse Scatterplots. In Proceedings of the 2010 IEEE Symposium on Pacific Visualization (PacificVis), pp. 105–112. IEEE, 2010
2010
-
[41]
H. Liao, Y . Wu, L. Chen, and W. Chen. Cluster-based visual abstraction for multivariate scatterplots. IEEE Transactions on Visualization and Computer Graphics, 24(9):2531–2545, 2017
2017
-
[42]
P. Lv, Z. Zhang, C. Li, Y . Guo, B. Zhou, and M. Xu. Crowd behavior evolution with emotional contagion in political rallies. IEEE Transactions on Computational Social Systems, 6(2):377–386, 2018
2018
-
[43]
Y . Ma, A. K. Tung, W. Wang, X. Gao, Z. Pan, and W. Chen. Scatternet: A deep subjective similarity model for visual analysis of scatterplots. IEEE Transactions on Visualization and Computer Graphics, pp. 1–1, 2018
2018
-
[44]
Matejka, F
J. Matejka, F. Anderson, and G. Fitzmaurice. Dynamic Opacity Optimiza- tion for Scatter Plots. In Proceedings of the 33rd Annual ACM Conference on Human Factors in Computing Systems, pp. 2707–2710. ACM, 2015
2015
-
[45]
H. Mei, Y . Ma, Y . Wei, and W. Chen. The design space of construction tools for information visualization: A survey. Journal of Visual Languages & Computing, 44:120–132, 2018
2018
-
[46]
T. Ni, G. S. Schmidt, O. G. Staadt, M. A. Livingston, R. Ball, and R. May. 10 © 2019 IEEE. This is the author’s version of the article that has been published in IEEE Transactions on Visualization and Computer Graphics. The final version of this record is available at: 10.1109/...
2019
-
[47]
Ondov, N
B. Ondov, N. Jardine, N. Elmqvist, and S. Franconeri. Face to Face: Evaluating Visual Comparison. IEEE Transactions on Visualization and Computer Graphics, 25(1):861–871, 2019
2019
-
[48]
W. Peng, M. O. Ward, and E. A. Rundensteiner. Clutter Reduction in Multi-Dimensional Data Visualization Using Dimension Reordering. In Proceedings of the 2004 IEEE Symposium on Information Visualization, pp. 89–96. IEEE, 2004
2004
-
[49]
A. M. Reach and C. North. Smooth, Efficient, and Interruptible Zooming and Panning. IEEE Transactions on Visualization and Computer Graphics, 25(2):1421–1434, 2019
2019
-
[50]
K. Reda, A. E. Johnson, M. E. Papka, and J. Leigh. Effects of Display Size and Resolution on User Behavior and Insight Acquisition in Visual Exploration. In Proceedings of the 33rd Annual ACM Conference on Human Factors in Computing Systems, pp. 2759–2768. ACM, 2015
2015
-
[51]
R. A. Rensink. The nature of correlation perception in scatterplots. Psy- chonomic Bulletin & Review, 24(3):776–797, 2017
2017
-
[52]
R. A. Rensink and G. Baldridge. The Perception of Correlation in Scatter- plots. Computer Graphics Forum, 29(3):1203–1210, 2010
2010
-
[53]
Ross and D
J. Ross and D. C. Burr. Vision senses number directly. Journal of vision, 10(2):10–10, 2010
2010
-
[54]
Saket, A
B. Saket, A. Endert, and J. Stasko. Beyond Usability and Performance: A Review of User Experience-focused Evaluations in Visualization. In Proceedings of the Sixth Workshop on Beyond Time and Errors on Novel Evaluation Methods for Visualization, pp. 133–142. ACM, 2016
2016
-
[55]
Saket, A
B. Saket, A. Srinivasan, E. D. Ragan, and A. Endert. Evaluating Interac- tive Graphical Encodings for Data Visualization. IEEE Transactions on Visualization and Computer Graphics, 24(3):1316–1330, 2018
2018
-
[56]
Sarikaya and M
A. Sarikaya and M. Gleicher. Scatterplots: Tasks, Data, and Designs.IEEE Transactions on Visualization and Computer Graphics, 24(1):402–412, 2018
2018
-
[57]
Schulz, T
H.-J. Schulz, T. Nocke, M. Heitzler, and H. Schumann. A Design Space of Visualization Tasks. IEEE Transactions on Visualization and Computer Graphics, 19(12):2366–2375, 2013
2013
-
[58]
Sedlmair and M
M. Sedlmair and M. Aupetit. Data-driven Evaluation of Visual Quality Measures. Computer Graphics Forum, 34(3):201–210, 2015
2015
-
[59]
Sedlmair, T
M. Sedlmair, T. Munzner, and M. Tory. Empirical Guidance on Scatterplot and Dimension Reduction Technique Choices. IEEE Transactions on Visualization and Computer Graphics, 19(12):2634–2643, 2013
2013
-
[60]
Sedlmair, A
M. Sedlmair, A. Tatu, T. Munzner, and M. Tory. A Taxonomy of Visual Cluster Separation Factors. Computer Graphics Forum, 31(3):1335–1344, 2012
2012
-
[61]
Y . Shi, Y . Zhao, F. Zhou, R. Shi, and Y . Zhang. A novel radial visualization of intrusion detection alerts. IEEE Computer Graphics and Applications, 38(6):83–95, 2018
2018
-
[62]
M. Sips, B. Neubert, J. P. Lewis, and P. Hanrahan. Selecting good views of high-dimensional data using class consistency. Computer Graphics Forum, 28(3):831–838, 2009
2009
-
[63]
Sophian and Y
C. Sophian and Y . Chu. How do people apprehend large numerosities? Cognition, 107(2):460–478, 2008
2008
-
[64]
Steichen, G
B. Steichen, G. Carenini, and C. Conati. User-adaptive information visual- ization: using eye gaze data to infer visualization tasks and user cognitive abilities. In Proceedings of the 2013 international conference on Intelligent user interfaces, pp. 317–328. ACM, 2013
2013
-
[65]
S. S. Stevens and G. Stevens. Psychophysics: Introduction to its perceptual, neural, and social prospects. New Brunswick, 1986
1986
-
[66]
D. A. Szafir. Modeling Color Difference for Visualization Design. IEEE Transactions on Visualization and Computer Graphics, 24(1):392–401, 2018
2018
-
[67]
A. Tatu, G. Albuquerque, M. Eisemann, J. Schneidewind, H. Theisel, M. Magnork, and D. Keim. Combining automated analysis and visual- ization techniques for effective exploration of high-dimensional data. In Proceedings of the 2009 IEEE Symposium on Visual Analytics Science and...
2009
-
[68]
A. Tatu, P. Bak, E. Bertini, D. Keim, and J. Schneidewind. Visual quality metrics and human perception: an initial study on 2D projections of large multidimensional data. In Proceedings of the International Conference on Advanced Visual Interfaces, pp. 49–56. ACM, 2010
2010
-
[69]
M. S. Tibber, J. A. Greenwood, and S. C. Dakin. Number and density discrimination rely on a common metric: Similar psychophysical effects of size, contrast, and divided attention. Journal of Vision, 12(6):1–19, 2012
2012
-
[70]
M. S. Tibber, G. S. Manasseh, R. C. Clarke, G. Gagin, S. N. Swanbeck, B. Butterworth, R. B. Lotto, and S. C. Dakin. Sensitivity to numerosity is not a unique visuospatial psychophysical predictor of mathematical ability. Vision Research, 89:1–9, 2013
2013
-
[71]
Tokita and A
M. Tokita and A. Ishiguchi. How might the discrepancy in the effects of perceptual variables on numerosity judgment be reconciled? Attention, Perception, & Psychophysics, 72(7):1839–1853, 2010
2010
-
[72]
M. Tory, D. Sprague, F. Wu, W. Y . So, and T. Munzner. Spatialization Design: Comparing Points and Landscapes. IEEE Transactions on Visual- ization and Computer Graphics, 13(6):1262–1269, 2007
2007
-
[73]
A. C. Valdez, M. Ziefle, and M. Sedlmair. Priming and Anchoring Ef- fects in Visualization. IEEE Transactions on Visualization and Computer Graphics, 24(1):584–594, 2018
2018
-
[74]
H. Wang, M. Xu, F. Zhu, Z. Deng, Y . Li, and B. Zhou. Shadow traffic: A unified model for abnormal traffic behavior simulation. Computers & Graphics, 70:235–241, 2018
2018
-
[75]
Y . Wang, X. Chen, T. Ge, C. Bao, M. Sedlmair, C.-W. Fu, O. Deussen, and B. Chen. Optimizing color assignment for perception of class separa- bility in multiclass scatterplots. IEEE Transactions on Visualization and Computer Graphics, 25(1):820–829, 2019
2019
-
[76]
Y . Wang, Z. Wang, C. W. Fu, H. Schmauder, O. Deussen, and D. Weiskopf. Image-based aspect ratio selection. IEEE Transactions on Visualization and Computer Graphics, 25(1):840–849, 2019
2019
-
[77]
C. Ware. Information Visualization: Perception for Design . Elsevier, 2012
2012
-
[78]
J. Xia, L. Gao, K. Kong, Y . Zhao, Y . Chen, X. Kui, and Y . Liang. Exploring linear projections for revealing clusters, outliers, and trends in subsets of multi-dimensional datasets. Journal of Visual Languages & Computing, 48:52–60, 2018
2018
-
[79]
J. Xia, F. Ye, W. Chen, Y . Wang, W. Chen, Y . Ma, and A. K. Tung. Ldsscanner: exploratory analysis of low-dimensional structures in high- dimensional datasets. IEEE Transactions on Visualization and Computer Graphics, 24(1):236–245, 2017
2017
-
[80]
M. Xu, C. Li, P. Lv, N. Lin, R. Hou, and B. Zhou. An efficient method of crowd aggregation computation in public areas. IEEE Transactions on Circuits and Systems for Video Technology, 28(10):2814–2825, 2017
2017
-
[81]
F. Yang, L. T. Harrison, R. A. Rensink, S. L. Franconeri, and R. Chang. Correlation Judgment and Visualization Features: A Comparative Study. IEEE Transactions on Visualization and Computer Graphics, 25(3):1474– 1488, 2019
2019
-
[82]
Yost and C
B. Yost and C. North. The Perceptual Scalability of Visualization. IEEE Transactions on Visualization and Computer Graphics, 12(5):837–844, 2006
2006
-
[83]
Y . Zhao, F. Luo, M. Chen, Y . Wang, J. Xia, F. Zhou, Y . Wang, Y . Chen, and W. Chen. Evaluating Multi-Dimensional Visualizations for Understand- ing Fuzzy Clusters. IEEE Transactions on Visualization and Computer Graphics, 25(1):12–21, 2019
2019
-
[84]
F. Zhou, X. Lin, C. Liu, Y . Zhao, P. Xu, L. Ren, T. Xue, and L. Ren. A survey of visualization for smart manufacturing. Journal of Visualization, 22(2):419–435, 2019
2019
-
[85]
Z. Zhou, L. Meng, C. Tang, Y . Zhao, Z. Guo, M. Hu, and W. Chen. Visual abstraction of large scale geospatial origin-destination movement data. IEEE Transactions on Visualization and Computer Graphics, 25(1):43–53, 2018
2018
-
[86]
Zimmermann and G
E. Zimmermann and G. R. Fink. Numerosity perception after size adapta- tion. Scientific Reports, 6(1):32810–32817, 2016. 11
2016
Reviewed August 14, 2026 · model on record in the stance chip above.
Discussion (0). Continue with ORCID to comment.