REVIEW 3 major objections 6 minor 42 references
CloudSat-inferred vertical structure of precipitation over the Antarctic continent
T0 review · 3 major / 6 minor · reviewed 2026-08-14 · deepseek-v4-flash
Pith's one-line read Antarctic precipitation is largely orographic: the new 3D CloudSat climatology shows air lifted up the ice-sheet slopes at about 0.02 m/s.
desk verdict A genuinely useful 3D Antarctic precipitation climatology whose headline 0.02 m/s vertical wind claim is a visually fitted parameter, not an independently estimated physical quantity. read the letter →
The pith
A machine-rendered reading of the paper's core claim, the machinery that carries it, and where it could break.
The reading
What carries the argument
The load-bearing object is Equation 1, the saturation-forced-lifting relation $$ \mathrm{Pr}=-\frac{w}{\rho_{\mathrm{water}}}\int_z \rho_{\mathrm{atm}}\frac{L\,q_{\mathrm{sat}}(T,p)}{R_{\mathrm{vap}}$T^{2}$}\Gamma_{\mathrm{sat}}\,dz, $$ derived in Appendix B from a moisture budget by assuming steady, saturated air, zero evaporation, and purely vertical motion, so that precipitation equals the column-integrated condensation produced by lifting at vertical speed $w$. The paper overlays curves for $w=0.0001$ to $1\ \mathrm{m\,s^{-1}}$ on the observed precipitation-temperature scatter plots; the dense part of the observations tracks the $0.01\ \mathrm{m\,s^{-1}}$ curve, with the 0.02 m/s average cited in the abstract, and the deviations are attributed to steep local topography.
What would settle it
Compute a full column moisture budget over the Antarctic margin from high-resolution reanalysis or a regional model, retaining the horizontal advection terms $u\,\partial q/\partial x+v\,\partial q/\partial y$, and compare the diagnosed condensation profile to CloudSat's measured precipitation. If the full-budget condensation does not reproduce the observed precipitation-temperature scatter, or if direct wind measurements show vertical velocities far from 0.01 to 0.02 m/s over the slopes, then Equation 1 is not the controlling mechanism.
Extended reading notes
Core claim
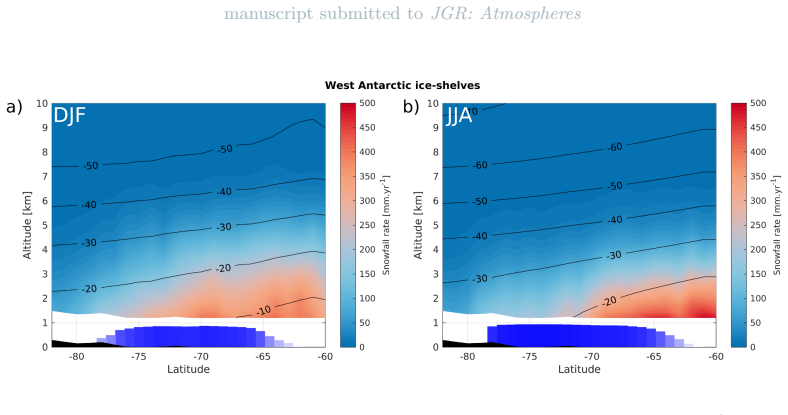
The paper's central claim is that the vertical structure of Antarctic precipitation is governed by forced orographic lifting of near-saturated marine air over the ice-sheet margins, with an average vertical velocity of about $0.02\ \mathrm{m\,s^{-1}}$. To establish this, the authors regrid the CloudSat 2C-SNOW-PROFILE snowfall retrievals onto a $1^{\circ}\times2^{\circ}$ horizontal grid with 240 m vertical bins from roughly 1200 m to 10 km above ground, and compare the precipitation-temperature histograms at each level with an analytical relation for condensation by steady saturated ascent. The observed distributions sit between the curves for $w=0.01$ and $w=0.1\ \mathrm{m\,s^{-1}}$, close to the $0.01\ \mathrm{m\,s^{-1}}$ curve over the periphery and slightly above it over the plateau, and the paper interprets the spread at fixed temperature as the variety of slopes and horizontal wind strengths that set the local vertical wind. The same dataset yields the regional contrasts: high, weakly seasonal snowfall over the coasts and peninsula, low and rare snowfall on the plateau, and a strong dependence of ice-shelf precipitation on sea-ice coverage.
Load-bearing premise
The load-bearing premise is that horizontal moisture advection can be neglected, so the column condensation is simply $w\,\partial q_{\mathrm{sat}}/\partial z=-\mathrm{Pr}$; if horizontal transport of moisture is as important as vertical lifting over Antarctic slopes, the inferred vertical wind of 0.01 to 0.02 m/s is not a real physical wind.
Editorial extensions
If this is right
- Climate-model evaluation can move from surface snowfall totals to three-dimensional precipitation-temperature distributions: a model that places its snowfall off the observed $w\approx0.01$ to $0.02\ \mathrm{m\,s^{-1}}$ envelope has a transport, thermodynamics, or microphysics bias.
- The periphery/plateau contrast implies that model skill must be assessed separately for the two regimes, since on the plateau, where the seasonal swing is ±143%, a few large events dominate and mean-state comparisons over short periods can mislead.
- Over the ice shelves, summer versus winter precipitation differences and their link to sea-ice coverage give a direct test of coupled sea-ice-atmosphere behavior in models.
- The analytical relation turns the average Antarctic slope and horizontal wind into a predicted snowfall rate, so the paper's diagnostic can be applied without retuning.
Reading between the lines
- Not pursued in the paper: a direct computation of the same precipitation-temperature scatter from a full-physics model that retains horizontal moisture advection would test whether the $w\approx0.02\ \mathrm{m\,s^{-1}}$ relation is a causal mechanism or a curve fit.
- A testable extension would be to predict interannual snowfall from the product of near-surface wind speed and slope, $u\,dz/dx$, times saturation humidity; if the relation is causal, years with stronger onshore flow should show proportionally more peripheral precipitation.
- Because ground clutter hides the lowest roughly 1200 m, the inferred vertical wind applies aloft; an observational follow-up using ground-based micro rain radars at coastal East Antarctic stations could show where the lifting curve breaks as sublimation and katabatic winds take over.
Signed reviews
Editorial analysis
A structured set of objections, weighed in public.
Referee Report
Summary. The manuscript constructs the first multi-year, three-dimensional CloudSat snowfall climatology over Antarctica (2007–2010) on a 1° latitude × 2° longitude grid with 240 m vertical bins, using the 2C-SNOW-PROFILE product and co-located ECMWF-AUX temperatures. It documents strong contrasts between peripheral areas and the plateau, regional zonal structures, sea-ice influence over western ice shelves, and histograms/scatterplots of precipitation versus temperature at multiple heights. The paper then derives a saturated-lifting analytical relation (Eq. 1) and, by visual comparison of the curve family to the observed scatter, concludes that precipitation is largely controlled by topographic advection with an average vertical wind of 0.01–0.02 m/s. This mechanism claim is the stated central finding.
Significance. The three-dimensional climatology itself is a valuable community resource: it extends the existing 2D Palerme climatologies, provides vertical-profile diagnostics, and is accompanied by uncertainty estimates from ground-radar comparisons. If the 0.02 m/s result were rigorously established, it would be a compact and useful diagnostic for evaluating model precipitation processes over Antarctica. However, the mechanism claim is currently much weaker than the dataset description: the physical derivation omits horizontal advection without justification, and the agreement is assessed visually rather than quantitatively. The paper therefore needs either a substantial reanalysis-based budget analysis or a careful reframing of Eq. (1) as a conditional-mean diagnostic rather than a retrieved vertical velocity.
major comments (3)
- [Appendix B, Eqs. (B3)–(B5)] The reduction from the full steady-state moisture budget to w ∂q_sat/∂z = −Pr silently drops the horizontal advection terms u∂q/∂x + v∂q/∂y. The text justifies this as “assuming a purely vertical motion”, but the proposed mechanism is topographic lifting of air that is advected horizontally; if u = v = 0 there is no horizontal airflow to be deflected upslope, so the reduced equation is not the limit described. Along the Antarctic coastal margin, synoptic systems and cold-air outbreaks produce strong horizontal moisture gradients, and u·∇q can plausibly be comparable to w∂q_sat/∂z. Without a scale analysis or a quantitative evaluation using collocated reanalysis winds and moisture, Eq. (1) is not demonstrated to be the governing relation for the observed precipitation–temperature distributions. This is the load-bearing step for the abstract’s 0.02 m/s claim, and it needs either a defended derivation (for example, in terrain-following coordinates with an explicit slope term) or an explicit statement that Eq. (1) is a heuristic diagnostic rather than a retrieved physical vertical velocity.
- [Section 4.2, Figs. 10–11] There is no quantitative measure of agreement between the observed scatter and the analytical curves. The manuscript states that the distribution “follows” or “evolves just over the line with triangle markers” (w = 0.01–0.02 m/s), but no skill score, correlation, likelihood, regression, or residual statistics are reported. Because Eq. (1) is integrated using the CloudSat-observed column temperatures, the fitted w absorbs all retrieval biases, unrepresented microphysical processes, and the neglected advection and pressure terms. The circularity also matters: a multi-curve family is drawn and w is selected by eye so that the curves align with the data, and the same w is then reported as the average vertical wind. I ask the authors to add a formal fit with uncertainty (for example, maximum-likelihood estimation of w per region and height with confidence intervals), or to reposition Eq. (1) as a purely descriptive scaling relation and remove the physical 0.02 m/s wording from the abstract.
- [Section 4.2, Eq. (1) and the 0.2 m/s threshold] The plausibility estimate w = u dz/dx uses a representative u = 5 m/s and a zonally averaged slope; this is not an observational determination of w, and dz/dx should be evaluated along the actual air trajectory rather than on the zonal-mean cross-section. The text also introduces a 0.2 m/s exceedance threshold without stating how it was chosen or what uncertainty it carries; Fig. 12 then uses it to classify extreme events. Finally, Eq. (B8) computes ∂q_sat/∂z from the Clausius–Clapeyron relation at constant pressure while the integral in Eq. (B9) is taken over a finite depth with varying pressure and temperature; the pressure dependence of q_sat is not accounted for. Please state the additional approximations explicitly and provide a sensitivity test of Eq. (1) to the pressure term. These issues do not affect the climatological maps, but they directly affect the magnitude of the inferred w.
minor comments (6)
- [Appendix B heading] The heading “demonstation” should be “demonstration”.
- [Figure 4 caption] In the caption of Fig. 4, “Antartic plateau” should be “Antarctic plateau”.
- [Table A2, 2160 m row] The 2160 m row lists the temperature interval as “-17.1429 – -36.8571”, the reverse order of the other rows; correct it for readability.
- [Abstract and Section 3.1] The abstract and Section 3.1 use “relative seasonal variation” of ±11% and ±143%; please define this statistic explicitly (for example, half of the annual range divided by the annual mean).
- [Eq. (1) and Section 4.2] The lower limit of the integral in Eq. (1) is not specified, and the text states that Γ_sat is the moist adiabatic lapse rate while using a constant value of −6.5 K/km; clarify the integration bounds and note the constant-lapse-rate approximation.
- [Figures 10–11 captions] The white contours labelled “σ standard deviation of the distributions” are not defined; state whether σ is computed on precipitation rate, on log precipitation, or on observation counts.
Circularity Check
No significant circularity: Eq. 1 is an independent analytical curve family, and the 0.01-0.02 m/s vertical wind is inferred from CloudSat/ECMWF data, not forced by construction.
full rationale
The paper's central mechanism claim is that observed precipitation-temperature distributions follow an analytical orographic-lifting relationship with vertical wind w near 0.01-0.02 m/s. This is not circular. Equation 1 is derived in Appendix B from the moisture budget (Eqs. B3-B9) under explicit assumptions: steady state, saturation, no evaporation, and purely vertical motion. The compared observations are CloudSat 2C-SNOW-PROFILE precipitation rates and ECMWF-AUX temperatures, both independent of Eq. 1. The w values are trial parameters of the analytical family, and the paper's identification of the triangle-marker (0.01 m/s) or slightly-above-triangle (about 0.02 m/s) curve is an inverse inference from the data, not a quantity defined by the data in a way that guarantees agreement. The main vulnerability is the reduction from Eq. B4 to Eq. B5, which drops u dq/dx + v dq/dy without a quantitative scale analysis; if horizontal advection is comparable to vertical advection in coastal Antarctica, the inferred w may not be a physically meaningful vertical wind. That is a modeling-assumption and correctness risk, not a circularity: the paper does not use Eq. 1 to generate the data it claims to explain. Self-citations to Palerme et al. (2014, 2019) and Lemonnier et al. (2019) concern data provenance, retrieval validation, and uncertainty estimates for an externally available CloudSat product; none is used as a uniqueness theorem, a forbidden alternative, or an ansatz that smuggles in the orographic conclusion. No step in the derivation reduces by construction to its own inputs, so the circularity score is 0.
Assumptions & free parameters
free parameters (2)
- vertical wind speed w =
~0.01-0.02 m.s-1 (by visual match to observed precipitation-temperature distributions)
- 0.2 m.s-1 exceedance threshold =
0.2 m.s-1
assumptions (5)
- domain assumption Air parcels advected over Antarctica are at saturation (q = q_sat) with no evaporation (Ev = 0)
- domain assumption The moisture budget can be reduced to a purely vertical advection term, dropping u*dq/dx + v*dq/dy (Eq. B3 to B5)
- standard math Steady state (dq/dt = 0)
- domain assumption The vertical temperature profile is moist adiabatic with Gamma_sat = -6.5 K/km
- domain assumption CloudSat retrievals at 1200 m a.g.l. and above are representative of the precipitation profile, with ground clutter not biasing the climatological means
Cite this review
Pith. "Pith review of CloudSat-inferred vertical structure of precipitation over the Antarctic continent." pith.science (2026). https://pith.science/paper/VXB7PRIS
@misc{pith2026190800457,
  author       = {Pith},
  title        = {Pith review of: CloudSat-inferred vertical structure of precipitation over the Antarctic continent},
  year         = {2026},
  howpublished = {\url{https://pith.science/paper/VXB7PRIS}},
  note         = {Machine review of arXiv:1908.00457}
}
read the original abstract
Current global warming is causing significant changes in snowfall in polar regions, directly impacting the mass balance of the ice caps. The only water supply in Antarctica, precipitation, is poorly estimated from surface measurements. The onboard cloud-profiling radar of the CloudSat satellite provided the first real opportunity to estimate precipitation at continental scale. Based on CloudSat observations, we propose to explore the vertical structure of precipitation in Antarctica over the 2007-2010 period. A first division of this dataset following a topographical approach (continent versus peripheral regions, with a 2250m topographical criterion) shows a high precipitation rate (275mm/yr at 1200meters above ground level) with low relative seasonal variation (+/-11%) over the peripheral areas. Over the plateau, the precipitation rate is low (34mm/yr at 1200m.a.g.l.) with a much larger relative seasonal variation (+/-143%). A second study that follows a geographical division highlights the average vertical structure of precipitation and temperature depending on the regions and their interactions with topography. In particular, over ice-shelves, we see a strong dependence of the distribution of precipitation on the sea-ice coverage. Finally, the relationship between precipitation and temperature is analyzed and compared with a simple analytical relationship. This study highlights that precipitation is largely dependent on the advection of air masses along the topographic slopes with an average vertical wind of 0.02m/s. This provides new diagnostics to evaluate climate models with a three-dimensional approach of the atmospheric structure of precipitation.
Figures


Figures from the paper (13 more)




Reference graph
Works this paper leans on
-
[1]
apacite url apacite =6pt Acknowledgments. 6pt 1sp \@dates Received \@recvdate\@empty\@rcvaccrule \@recvdate \@revisedate\@empty ; revised \@revisedate; \@accptdate\@empty \@revisedate\@empty; accepted \@accptdate \@pubdate\@empty. ; published \@pubdate. -2pt \@authaddrs @list\@empty =.15in @list 1sp @list =9pt plus 2pt minus 6pt \@sluginfo width 4pc =3000...
2001
-
[2]
\@ifstar \@figbox \@figbox \@figbox#1#2#3 to !#1! #3 [#1][c] !#2!#3 \@tempdima#2 \@tempdima by2 \@tempdima by- \@tempdima by- \@height\@tempdima\@depth\@tempdima\@width @ to @ #3 Bib ??? ??? ??? =0 =0 = @figure=0 @table=0 #1 --#1 -24pt -2ex #1 0= #1 to 0 #1 I NDEX T ERMS: #1 #1 Citation: #1 Feb 9, 2009 Changed name and references to name from agu2001 to a...
work page Pith review arXiv 2009
-
[3]
bromwich1988snowfall APACrefauthors Bromwich, D H. APACrefauthors \ 1988 . Snowfall in high southern latitudes Snowfall in high southern latitudes . Reviews of Geophysics 26 1 149--168
work page 1988
-
[4]
bromwich1998meteorology APACrefauthors Bromwich, D H. \ Parish, T R. APACrefauthors \ 1998 . Meteorology of the Antarctic Meteorology of the antarctic . Meteorology of the Southern Hemisphere Meteorology of the southern hemisphere \ ( \ 175--200). Springer
work page 1998
-
[5]
church2013sea APACrefauthors Church, J A. , Clark, P U. , Cazenave, A. , Gregory, J M. , Jevrejeva, S. , Levermann, A. others APACrefauthors \ 2013 . Sea-level rise by 2100 Sea-level rise by 2100 . Science 342 6165 1445--1445
work page 2013
-
[6]
duranalarcon2018VPR APACrefauthors Dur\'an-Alarc\'on, C. , Boudevillain, B. , Genthon, C. , Grazioli, J. , Souverijns, N. , van Lipzig, N P M. Berne, A. APACrefauthors \ 2019 . The vertical structure of precipitation at two stations in East Antarctica derived from micro rain radars The vertical structure of precipitation at two stations in east antarctica...
work page 2019
-
[7]
dye1974mechanism APACrefauthors Dye, J E. , Knight, C A. , Toutenhoofd, V. \ Cannon, T W. APACrefauthors \ 1974 . The mechanism of precipitation formation in northeastern Colorado cumulus III. Coordinated microphysical and radar observations and summary The mechanism of precipitation formation in northeastern colorado cumulus iii. coordinated microphysica...
work page 1974
-
[8]
eisen2008ground APACrefauthors Eisen, O. , Frezzotti, M. , Genthon, C. , Isaksson, E. , Magand, O. , van den Broeke, M R. others APACrefauthors \ 2008 . Ground-based measurements of spatial and temporal variability of snow accumulation in East Antarctica Ground-based measurements of spatial and temporal variability of snow accumulation in east antarctica ...
work page 2008
Show all 42 references
-
[9]
, Volken, E
findeisen2015colloidal APACrefauthors Findeisen, W. , Volken, E. , Giesche, A M. \ Br \"o nnimann, S. APACrefauthors \ 2015 . Colloidal meteorological processes in the formation of precipitation Colloidal meteorological processes in the formation of precipitation . Meteorologi...
2015
-
[10]
\ Abe, O
fujita2006stable APACrefauthors Fujita, K. \ Abe, O. APACrefauthors \ 2006 . Stable isotopes in daily precipitation at Dome Fuji, East Antarctica Stable isotopes in daily precipitation at dome fuji, east antarctica . Geophysical research letters 33 18
2006
-
[11]
, Krinner, G
genthon2009antarctic APACrefauthors Genthon, C. , Krinner, G. \ Castebrunet, H. APACrefauthors \ 2009 . Antarctic precipitation and climate-change predictions: horizontal resolution and margin vs plateau issues Antarctic precipitation and climate-change predictions: horizontal...
2009
-
[12]
, Tsukernik, M
gorodetskaya2014role APACrefauthors Gorodetskaya, I V. , Tsukernik, M. , Claes, K. , Ralph, M F. , Neff, W D. \ Van Lipzig, N P. APACrefauthors \ 2014 . The role of atmospheric rivers in anomalous snow accumulation in East Antarctica The role of atmospheric rivers in anomalous...
2014
-
[13]
, Genthon, C
grazioli2017measurements APACrefauthors Grazioli, J. , Genthon, C. , Boudevillain, B. , Duran-Alarcon, C. , Del Guasta, M. , Jean-Baptiste, M. \ Berne, A. APACrefauthors \ 2017 . Measurements of precipitation in Dumont d'Urville, Ad \'e lie Land, East Antarctica Measurements o...
2017
-
[14]
, Madeleine, J B
grazioli2017katabatic APACrefauthors Grazioli, J. , Madeleine, J B. , Gall \'e e, H. , Forbes, R M. , Genthon, C. , Krinner, G. \ Berne, A. APACrefauthors \ 2017 . Katabatic winds diminish precipitation contribution to the Antarctic ice mass balance Katabatic winds diminish pr...
2017
-
[15]
, Gwyther, D E
greene2017antarctic APACrefauthors Greene, C A. , Gwyther, D E. \ Blankenship, D D. APACrefauthors \ 2017 . Antarctic mapping tools for MATLAB Antarctic mapping tools for matlab . Computers & Geosciences 104 151--157
2017
-
[16]
, Porter, C
howat2019reference APACrefauthors Howat, I M. , Porter, C. , Smith, B E. , Noh, M J. \ Morin, P. APACrefauthors \ 2019 . The Reference Elevation Model of Antarctica The reference elevation model of antarctica . The Cryosphere 13 2 665--674
2019
-
[17]
\ Turner, J
king2007antarctic APACrefauthors King, J C. \ Turner, J. APACrefauthors \ 2007 . Antarctic meteorology and climatology Antarctic meteorology and climatology . Cambridge University Press
2007
-
[18]
, Tripoli, G J
knuth2010influence APACrefauthors Knuth, S L. , Tripoli, G J. , Thom, J E. \ Weidner, G A. APACrefauthors \ 2010 . The influence of blowing snow and precipitation on snow depth change across the Ross Ice Shelf and Ross Sea regions of Antarctica The influence of blowing snow an...
2010
-
[19]
, Milani, L
kulie2016shallow APACrefauthors Kulie, M S. , Milani, L. , Wood, N B. , Tushaus, S A. , Bennartz, R. \ L’Ecuyer, T S. APACrefauthors \ 2016 . A shallow cumuliform snowfall census using spaceborne radar A shallow cumuliform snowfall census using spaceborne radar . Journal of Hy...
2016
-
[20]
, Ladkin, R
lachlan2001observations APACrefauthors Lachlan-Cope, T. , Ladkin, R. , Turner, J. \ Davison, P. APACrefauthors \ 2001 . Observations of cloud and precipitation particles on the Avery Plateau, Antarctic Peninsula Observations of cloud and precipitation particles on the avery pl...
2001
-
[21]
, Baker, B A
lawson2006microphysical APACrefauthors Lawson, R P. , Baker, B A. , Zmarzly, P. , O’Connor, D. , Mo, Q. , Gayet, J F. \ Shcherbakov, V. APACrefauthors \ 2006 . Microphysical and optical properties of atmospheric ice crystals at South Pole Station Microphysical and optical prop...
2006
-
[22]
, Madeleine, J
lemonnier2018evaluation APACrefauthors Lemonnier, F. , Madeleine, J. , Claud, C. , Genthon, C. , Dur \'a n-Alarc \'o n, C. , Palerme, C. others APACrefauthors \ 2019 . Evaluation of CloudSat snowfall rate profiles by a comparison with in-situ micro rain radars observations in ...
2019 doi
-
[23]
, Fyke, J
lenaerts2018signature APACrefauthors Lenaerts, J T. , Fyke, J. \ Medley, B. APACrefauthors \ 2018 . The signature of ozone depletion in recent Antarctic precipitation change: A study with the Community Earth System Model The signature of ozone depletion in recent antarctic pre...
2018
-
[24]
, Zipser, E J
liu2008cloud APACrefauthors Liu, C. , Zipser, E J. , Cecil, D J. , Nesbitt, S W. \ Sherwood, S. APACrefauthors \ 2008 . A cloud and precipitation feature database from nine years of TRMM observations A cloud and precipitation feature database from nine years of trmm observatio...
2008
-
[25]
, Burgard, C
maahn2014 APACrefauthors Maahn, M. , Burgard, C. , Crewell, S. , Gorodetskaya, I V. , Kneifel, S. , Lhermitte, S. van Lipzig, N P. APACrefauthors \ 2014 . How does the spaceborne radar blind zone affect derived surface snowfall statistics in polar regions? How does the spacebo...
2014
-
[26]
, Kulie, M S
milani2018cloudsat APACrefauthors Milani, L. , Kulie, M S. , Casella, D. , Dietrich, S. , L’Ecuyer, T S. , Panegrossi, G. Wood, N B. APACrefauthors \ 2018 . CloudSat snowfall estimates over Antarctica and the Southern Ocean: An assessment of independent retrieval methodologies...
2018
-
[27]
\ Bromwich, D H
nicolas2011climate APACrefauthors Nicolas, J P. \ Bromwich, D H. APACrefauthors \ 2011 . Climate of West Antarctica and influence of marine air intrusions Climate of west antarctica and influence of marine air intrusions . Journal of Climate 24 1 49--67
2011
-
[28]
, Claud, C
palerme2018groundclutter APACrefauthors Palerme, C. , Claud, C. , Wood, N. , L'Ecuyer, T. \ Genthon, C. APACrefauthors \ 2019 . How does ground clutter affect CloudSat snowfall retrievals over ice sheets? How does ground clutter affect cloudsat snowfall retrievals over ice she...
2019
-
[29]
, Genthon, C
palerme2017evaluation APACrefauthors Palerme, C. , Genthon, C. , Claud, C. , Kay, J E. , Wood, N B. \ L Ecuyer, T. APACrefauthors \ 2017 . Evaluation of current and projected Antarctic precipitation in CMIP5 models Evaluation of current and projected antarctic precipitation in...
2017
-
[30]
, Kay, J
palerme2014much APACrefauthors Palerme, C. , Kay, J. , Genthon, C. , L'Ecuyer, T. , Wood, N. \ Claud, C. APACrefauthors \ 2014 . How much snow falls on the Antarctic ice sheet? How much snow falls on the antarctic ice sheet? The Cryosphere 8 4 1577--1587
2014
-
[31]
, Ligtenberg, S
pritchard2012antarctic APACrefauthors Pritchard, H. , Ligtenberg, S. , Fricker, H. , Vaughan, D. , Van den Broeke, M. \ Padman, L. APACrefauthors \ 2012 . Antarctic ice-sheet loss driven by basal melting of ice shelves Antarctic ice-sheet loss driven by basal melting of ice sh...
2012
-
[32]
, Mouginot, J
rignot2019four APACrefauthors Rignot, E. , Mouginot, J. , Scheuchl, B. , van den Broeke, M. , van Wessem, M J. \ Morlighem, M. APACrefauthors \ 2019 . Four decades of Antarctic Ice Sheet mass balance from 1979--2017 Four decades of antarctic ice sheet mass balance from 1979--2...
2019
-
[33]
APACrefauthors \ 2000
rodgers2000inverse APACrefauthors Rodgers, C D. APACrefauthors \ 2000 . Inverse methods for atmospheric sounding: theory and practice Inverse methods for atmospheric sounding: theory and practice \ ( 2). World scientific
2000
-
[34]
, Lindsay, R W
schweiger2008relationships APACrefauthors Schweiger, A J. , Lindsay, R W. , Vavrus, S. \ Francis, J A. APACrefauthors \ 2008 . Relationships between Arctic sea ice and clouds during autumn Relationships between arctic sea ice and clouds during autumn . Journal of Climate 21 18...
2008
-
[35]
, Ivins, E
shepherd2018mass APACrefauthors Shepherd, A. , Ivins, E. , Rignot, E. , Smith, B. , Van Den Broeke, M. , Velicogna, I. others APACrefauthors \ 2018 . Mass balance of the Antarctic Ice Sheet from 1992 to 2017 Mass balance of the antarctic ice sheet from 1992 to 2017 . Nature 55...
2018
-
[36]
, Ivins, E R
shepherd2012reconciled APACrefauthors Shepherd, A. , Ivins, E R. , Geruo, A. , Barletta, V R. , Bentley, M J. , Bettadpur, S. others APACrefauthors \ 2012 . A reconciled estimate of ice-sheet mass balance A reconciled estimate of ice-sheet mass balance . Science 338 6111 1183--1189
2012
-
[37]
, Gossart, A
souverijns2018cloudsatgrid APACrefauthors Souverijns, N. , Gossart, A. , Lhermitte, S. , Gorodetskaya, I V. , Grazioli, J. , Berne, A. van Lipzig, N P M. APACrefauthors \ 2018 . Evaluation of the CloudSat surface snowfall product over Antarctica using ground-based precipitatio...
2018
-
[38]
\ Ellis, T D
stephens2008controls APACrefauthors Stephens, G L. \ Ellis, T D. APACrefauthors \ 2008 . Controls of global-mean precipitation increases in global warming GCM experiments Controls of global-mean precipitation increases in global warming gcm experiments . Journal of Climate 21 ...
2008
-
[39]
, Phillips, T
turner2019dominant APACrefauthors Turner, J. , Phillips, T. , Thamban, M. , Rahaman, W. , Marshall, G J. , Wille, J D. others APACrefauthors \ 2019 . The Dominant Role of Extreme Precipitation Events in Antarctic Snowfall Variability The dominant role of extreme precipitation ...
2019
-
[40]
, Van den Broeke, M
van2007heat APACrefauthors Van de Berg, W. , Van den Broeke, M. \ Van Meijgaard, E. APACrefauthors \ 2007 . Heat budget of the East Antarctic lower atmosphere derived from a regional atmospheric climate model Heat budget of the east antarctic lower atmosphere derived from a re...
2007
-
[41]
APACrefauthors \ 2011
wood2011estimation APACrefauthors Wood, N B. APACrefauthors \ 2011 . Estimation of snow microphysical properties with application to millimeter-wavelength radar retrievals for snowfall rate (PhD thesis) Estimation of snow microphysical properties with application to millimeter...
2011
-
[42]
, L'Ecuyer, T S
wood2014estimating APACrefauthors Wood, N B. , L'Ecuyer, T S. , Heymsfield, A J. , Stephens, G L. , Hudak, D R. \ Rodriguez, P. APACrefauthors \ 2014 . Estimating snow microphysical properties using collocated multisensor observations Estimating snow microphysical properties u...
2014
Reviewed August 14, 2026 · model on record in the stance chip above.
Discussion (0). Continue with ORCID to comment.