REVIEW 30 references
Measuring the Clustering Strength of a Network via the Normalized Clustering Coefficient
T0 review · reviewed 2026-08-14 · deepseek-v4-flash
Pith's one-line read The normalized clustering coefficient converges to a quantity that depends only on the community in-out ratio under the degree-corrected block model, enabling inference of community strength without community detection.
desk verdict Promising new network statistic with a sound DCBM core, but the LCD asymptotics are off by a factor that breaks the claimed model-separation rule. read the letter →
The pith
A machine-rendered reading of the paper's core claim, the machinery that carries it, and where it could break.
The reading
The authors define a normalized version: they take the density of triangles, divide by the cube of the ratio of edge density to connected-triple density, and cancel out the effects of density and degree variation. Under the degree-corrected block model, a common generative model for networks with communities, the normalized value converges to a known expression that depends only on the ratio of within-community to between-community connection probabilities. Thus one can read off community strength directly from the statistic, without running a community-detection algorithm.
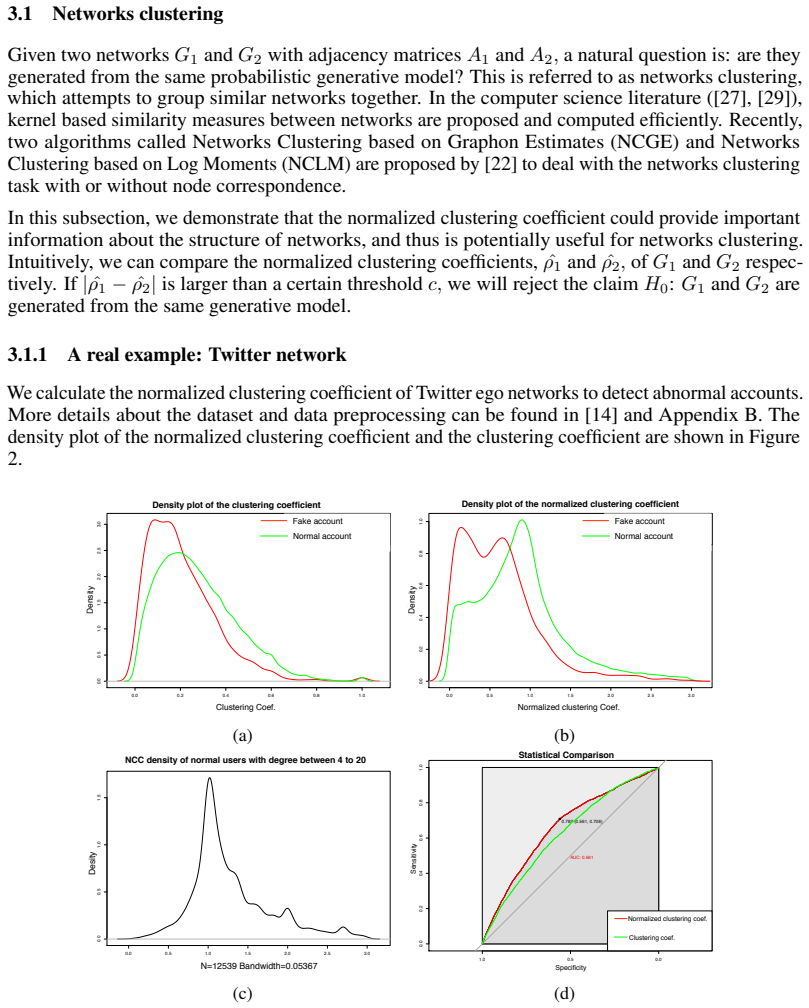
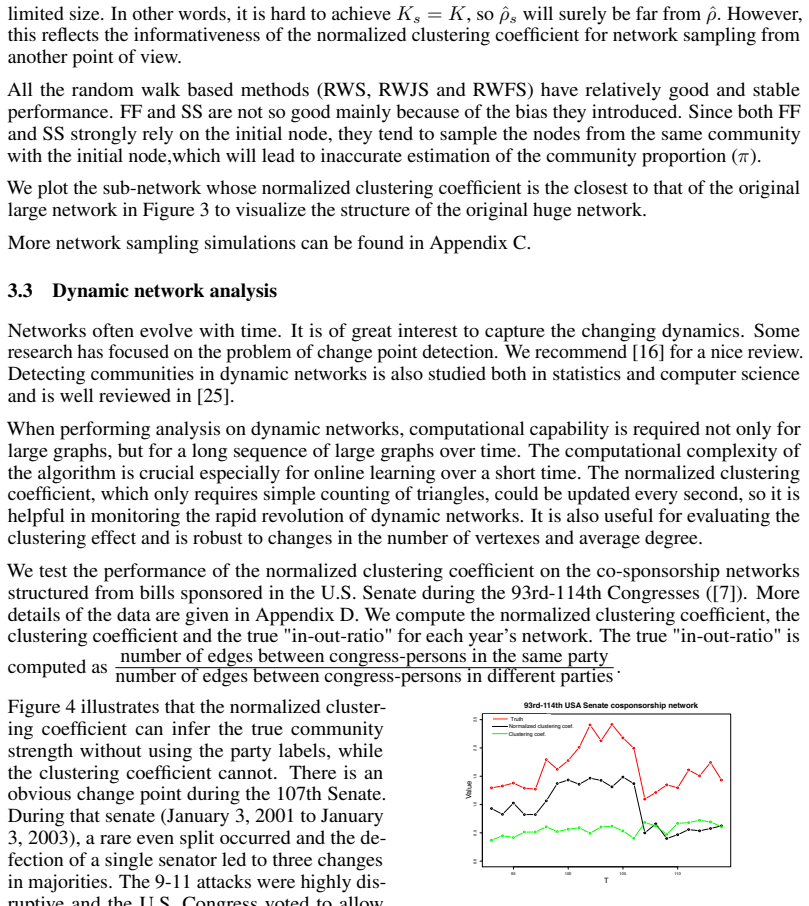
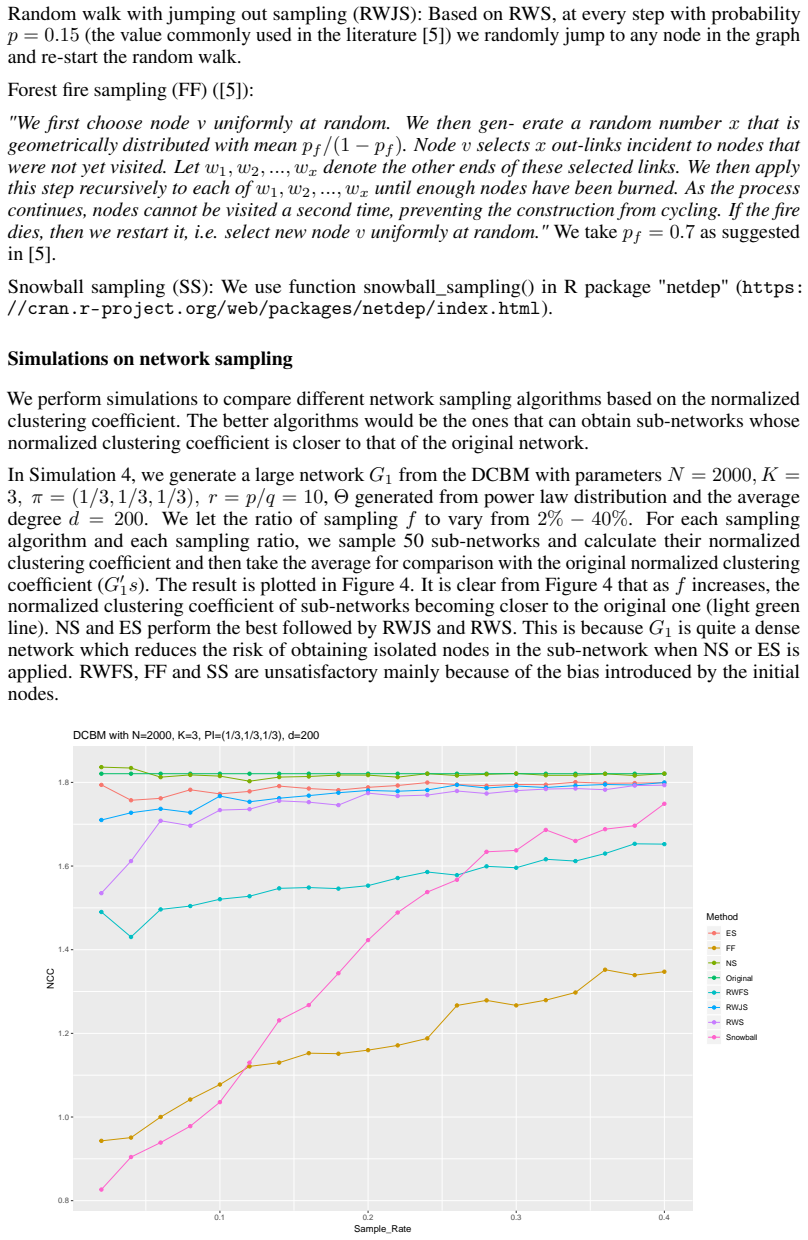
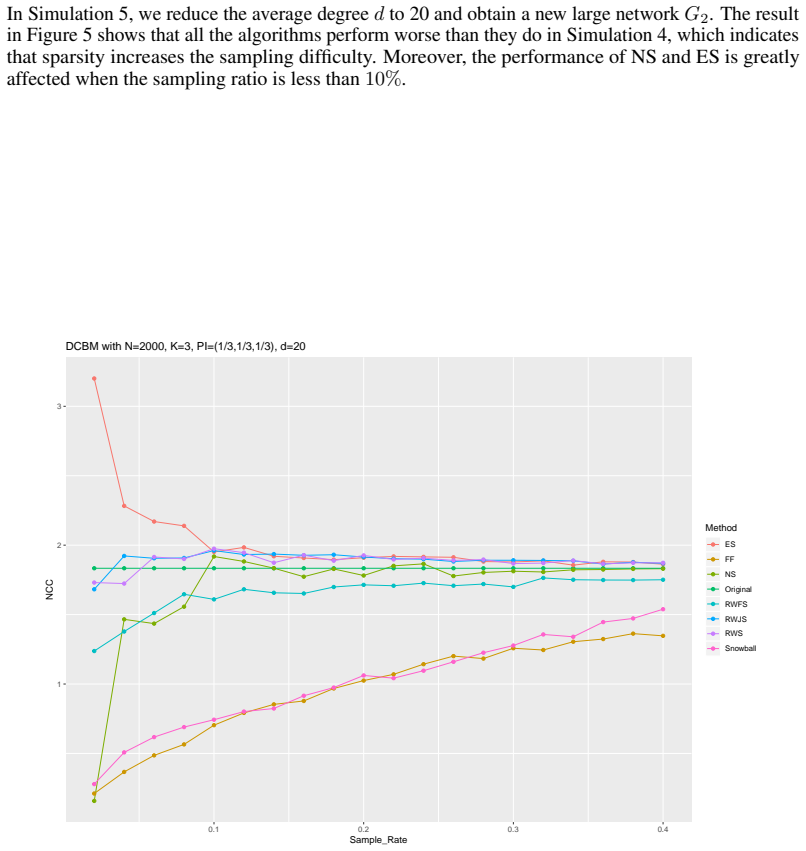
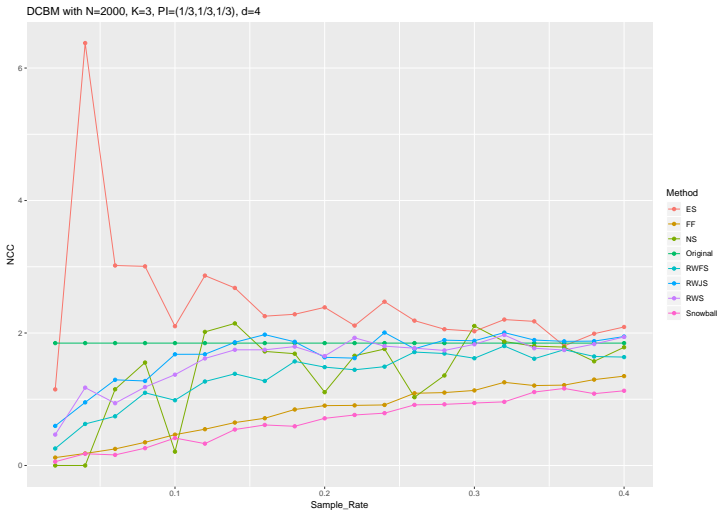
The paper derives asymptotic normality for this estimator and applies it to detect fake Twitter accounts, to choose among network sampling methods, and to track partisan polarization in U.S. Senate cosponsorship networks over time. The Twitter and Senate examples suggest the statistic behaves as claimed, though the theoretical treatment of the scale-free model is underdeveloped and some empirical choices are ad hoc.
Extended reading notes
Core claim
Under the degree-corrected block model with balanced class sizes, common within-block probability p, common between-block probability q, and E(θ^2)=1, the normalized clustering coefficient ρ̂ converges to ρ = [K r^3 + 3K(K-1)r + K(K-1)(K-2)]/(r+K-1)^3, a strictly increasing function of the in-out ratio r=p/q (Section 2.2, Eq. 7). Theorem 1 states that sqrt(C(N,3) T)(ρ̂-ρ)/ρ converges in distribution to N(0,1), so the in-out ratio can be inferred from the statistic without running community detection. The paper further claims this statistic is robust to network size, density, and degree heterogeneity, and that its value falls in (1,K) for DCBM, near 1 for Erdős-Rényi, and below 3/4 for the LCD model.
Load-bearing premise
The clean mapping from ρ̂ to the in-out ratio r holds only for the restricted DCBM submodel defined in Section 2.2: all communities have the same within-community probability p and the same between-community probability q, class sizes are balanced (π_i=1/K), and the degree-correction parameters satisfy E(θ^2)=1. Under a general DCBM with heterogeneous block probabilities or unbalanced community sizes, the normalized clustering coefficient also depends on those nuisance parameters, and the displayed monotone relation to r fails. This restriction is stated in the paper ('we reduce the parameter domain to B_ii=p>q=B_ij' and 'we also set π_i=1/K'), but it directly limits the scope of the headline claim that the statistic reveals community strength.
Signed reviews
Editorial analysis
A structured set of objections, weighed in public.
Assumptions & free parameters
free parameters (2)
- Threshold c in networks clustering
- Number of communities K in the test threshold
assumptions (4)
- domain assumption Lemmas 1 and 2 from Gao and Lafferty (2017) providing variance bounds and CLT for triangle counts under DCBM
- domain assumption Lemmas 3 and 4 from Bollobás and Riordan (2003) on triangle and triplet counts in the LCD model
- domain assumption The DCBM submodel restricts to B_ii=p>q=B_ij for all blocks, balanced class sizes π_i=1/K, and constraint E(θ^2)=1
- domain assumption The network is simple and undirected; self-loops and multi-edges are excluded
Cite this review
Pith. "Pith review of Measuring the Clustering Strength of a Network via the Normalized Clustering Coefficient." pith.science (2026). https://pith.science/paper/ANUNOO3V
@misc{pith2026190800523,
  author       = {Pith},
  title        = {Pith review of: Measuring the Clustering Strength of a Network via the Normalized Clustering Coefficient},
  year         = {2026},
  howpublished = {\url{https://pith.science/paper/ANUNOO3V}},
  note         = {Machine review of arXiv:1908.00523}
}
read the original abstract
In this paper, we propose a novel statistic of networks, the normalized clustering coefficient, which is a modified version of the clustering coefficient that is robust to network size, network density and degree heterogeneity under different network generative models. In particular, under the degree corrected block model (DCBM), the "in-out-ratio" could be inferred from the normalized clustering coefficient. Asymptotic properties of the proposed indicator are studied under three popular network generative models. The normalized clustering coefficient can also be used for networks clustering, network sampling as well as dynamic network analysis. Simulations and real data analysis are carried out to demonstrate these applications.
Figures
Figures from the paper (2 more)
Reference graph
Works this paper leans on
-
[1]
K., Neville, J., and Kompella, R
Ahmed, N. K., Neville, J., and Kompella, R. (2014). Network sampling: From static to streaming graphs. ACM Transactions on Knowledge Discovery from Data (TKDD), 8(2), 7
work page 2014
-
[2]
Barabási, A. L., and Albert, R. (1999). Emergence of scaling in random networks. science, 286(5439), 509-512
work page 1999
-
[3]
Barrat, A., Barthelemy, M., and Vespignani, A. (2004). The architecture of complex weighted networks. Proceedings of the National Academy of Sciences of the United States of America, 101(11), 3747
work page 2004
-
[4]
Bollobás, B., and Riordan, O. (2003). Mathematical results on scale-free random graphs. Handbook of graphs and networks: from the genome to the internet, 1-34
work page 2003
-
[5]
Bollobás, B., and Riordan, O. (2004). The diameter of a scale-free random graph. Combinatorica, 24(1), 5-34
work page 2004
-
[6]
Clemente, G. P., and Grassi, R. (2018). Directed clustering in weighted networks: A new perspective. Chaos, Solitons and Fractals , 107, 26-38
work page 2018
-
[7]
Fowler, J. H. (2006). Legislative cosponsorship networks in the US House and Senate. Social Networks, 28(4), 454-465
work page 2006
-
[8]
Gao, C., and Lafferty, J. (2017). Testing for global network structure using small subgraph statistics. arXiv preprint arXiv:1710.00862
arXiv 2017
Show all 30 references
-
[9]
Y., and Zhou, H
Gao, C., Ma, Z., Zhang, A. Y., and Zhou, H. H. (2018). Community detection in degree-corrected block models. The Annals of Statistics, 46(5), 2153-2185
2018
-
[10]
H., Kirkland, J
Gross, J. H., Kirkland, J. H., and Shalizi, C. (2012). Cosponsorship in the US Senate: A multilevel two-mode approach to detecting subtle social predictors of legislative support
2012
-
[11]
W., Laskey, K
Holland, P. W., Laskey, K. B., and Leinhardt, S. (1983). Stochastic blockmodels: First steps. Social networks, 5(2), 109-137
1983
-
[12]
Jin, J. (2015). Fast community detection by SCORE. The Annals of Statistics. 43(1), 57-89
2015
-
[13]
T., and Luo, S
Jin, J., Ke, Z. T., and Luo, S. (2018, July). Network Global Testing by Counting Graphlets. In International Conference on Machine Learning, (pp. 2338-2346)
2018
-
[14]
Kagan, D., Elovichi, Y., and Fire, M. (2018). Generic anomalous vertices detection utilizing a link prediction algorithm. Social Network Analysis and Mining, 8(1), 27
2018
-
[15]
and Newman, M
Karrer, B. and Newman, M. E. (2011). Stochastic blockmodels and community structure in networks. Physical Review E, 83(1), 016107
2011
-
[16]
and Gabrys, B
Kendrick, L., Musial, K. and Gabrys, B. (2018). Change point detection in social networks—Critical review with experiments. Computer Science Review, 29, 1-13
2018
-
[17]
Latapy, M., Magnien, C., and Del Vecchio, N. (2008). Basic notions for the analysis of large two-mode networks. Social Networks , 30(1), 31-48
2008
-
[18]
H., Kim, P
Lee, S. H., Kim, P. J., and Jeong, H. (2006). Statistical properties of sampled networks. Physical Review E, 73(1), 016102
2006
-
[19]
and Rinaldo, A
Lei, J. and Rinaldo, A. (2015). Consistency of spectral clustering in stochastic block models. The Annals of Statistics, 43(1), 215-237
2015
-
[20]
(2006, August)
Leskovec, J., and Faloutsos, C. (2006, August). Sampling from large graphs. In Proceedings of the 12th ACM SIGKDD international conference on Knowledge discovery and data mining, (pp. 631-636). ACM
2006
-
[21]
D., and Perry, A
Luce, R. D., and Perry, A. D. (1949). A method of matrix analysis of group structure. Psychometrika , 14(2), 95-116
1949
-
[22]
S., Sarkar, P., and Lin, L
Mukherjee, S. S., Sarkar, P., and Lin, L. (2017). On clustering network-valued data. In Advances in neural information processing systems, pp. 7071-7081
2017
-
[23]
Opsahl, T., and Panzarasa, P. (2009). Clustering in weighted networks. Social Networks , 31(2), 155-163
2009
-
[24]
Rezvanian, A., Moradabadi, B., Ghavipour, M., Khomami, M. M. D., and Meybodi, M. R. (2019). Social Network Sampling. In Learning Automata Approach for Social Networks, (pp. 91-149). Springer, Cham
2019
-
[25]
Rossetti, G., and Cazabet, R. (2018). Community discovery in dynamic networks: a survey. ACM Computing Surveys (CSUR), 51(2), 35
2018
-
[26]
Schank, T., and Wagner, D. (2004). Approximating clustering-coefficient and transitivity. Journal of Graph Algorithms and Applications, 9(2), 265-275
2004
-
[27]
Shervashidze, SVN
N. Shervashidze, SVN. Vishwanathan, TH. Petri, K. Mehlhorn, and KM. Borgwardt. (2009) Efficient graphlet kernels for large graph comparison. In Artificial Intelligence and Statistics (pp. 488-495)
2009
-
[28]
J., and Strogatz, S
Watts, D. J., and Strogatz, S. H. (1998). Collective dynamics of small-world networks. Nature, 393(6684), 440
1998
-
[29]
J., and Olhede, S
Wolfe, P. J., and Olhede, S. C. (2013). Nonparametric graphon estimation. arXiv preprint arXiv:1309.5936
2013 arXiv
-
[30]
Zhao, Y., Levina, E., and Zhu, J. (2012). Consistency of community detection in networks under degree-corrected stochastic block models. The Annals of Statistics. 40(4), 2266-2292
2012
Reviewed August 14, 2026 · model on record in the stance chip above.
Discussion (0). Continue with ORCID to comment.