REVIEW 4 major objections 6 minor 58 references
Evaluating an Immersive Space-Time Cube Geovisualization for Intuitive Trajectory Data Exploration
T0 review · 4 major / 6 minor · reviewed 2026-08-14 · deepseek-v4-flash
Pith's one-line read VR space-time cube matches desktop speed, wins on usability
desk verdict A well-executed but underpowered study: the subjective benefits of an immersive space-time cube are solid, while the 'similar performance' claim is inferred from null results and needs softer language. read the letter →
The pith
A machine-rendered reading of the paper's core claim, the machinery that carries it, and where it could break.
The reading
What carries the argument
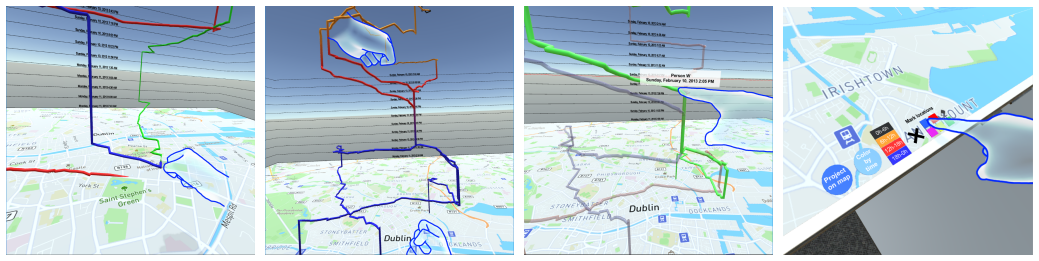
The load-bearing mechanism is the virtual desk metaphor paired with one-to-one gesture mapping: the STC's base map rests on a virtual reproduction of the analyst's real desk, time flows downward so the current instant sits at the desk surface, and the user grabs, stretches, scales, or taps the trajectories with tracked hands while physically touching tangible buttons on the desk. This design replaces the mouse-based rotate-pan-dolly navigation of the desktop condition, and it explains both main findings: comparing distances and depths becomes easier through stereopsis and head motion, so fewer cube rotations are needed, while manipulation feels more direct, so users interact more often without added mental workload. The paper's design choices—downward time direction, moving trajectories rather than the map, color-coded time periods, and trajectory footprints—are presented as reusable recommendations for future immersive STC systems.
What would settle it
A controlled replication with the same seven tasks in which the desktop condition is denied the extra birds-eye rotation (or the immersive condition is given an equivalent viewpoint range) would settle the fairness issue: if desktop performance then falls, or immersion no longer matches it, the paper's central comparison is biased. Alternatively, testing trained domain experts after several sessions in each condition could reveal whether the SUS and workload differences shrink to non-significance, which would indicate the usability advantage is a novelty effect rather than a durable property of the metaphor.
Extended reading notes
Core claim
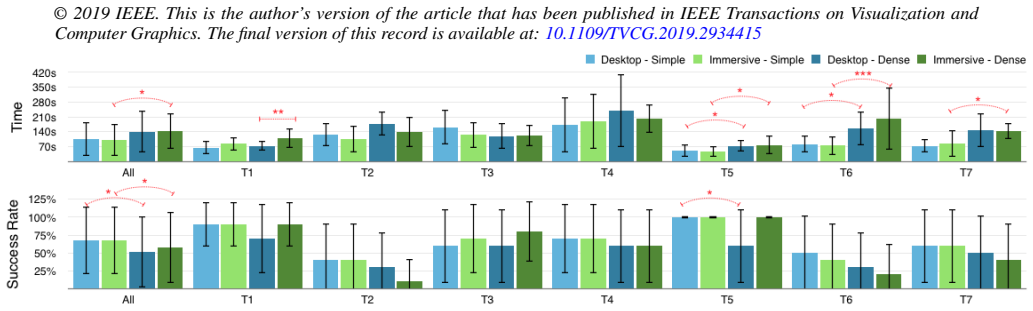
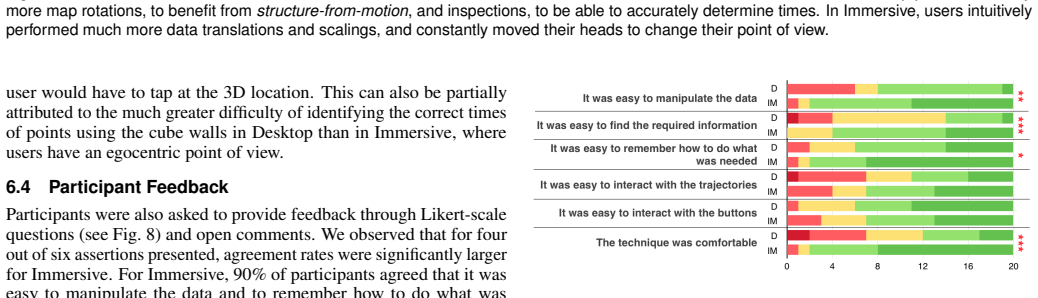
The paper's central claim is that an immersive Space-Time Cube built on a virtual-desk metaphor can make trajectory exploration more intuitive and comfortable than a desktop STC without sacrificing quantitative performance. In a mixed-design study with 20 novice users, no significant differences were found in success rates or completion times for six of seven tasks; the only exception was the simplest position-identification task, which was slightly slower in immersive because users had to reach into the scene and tap the data. The decisive differences were in subjective measures: the System Usability Scale average was 82.3 for immersive versus 62.1 for desktop, mental workload and frustration were significantly lower, engagement and intuitiveness ratings were much higher, and simulator sickness was negligible after sessions averaging 25 minutes. The paper also reports that interaction patterns diverged sharply: immersive users relied on head motion, grabbing, and scaling the data, while desktop users compensated for weaker depth perception by rotating the cube and hovering over trajectories to read times.
Load-bearing premise
The load-bearing premise is that the desktop baseline fairly represents a typical desktop space-time cube, even though it could rotate around the cube's horizontal axis—something the immersive version could not do.
Editorial extensions
If this is right
- Immersive STCs can be offered to trajectory analysts without expecting slower or less accurate work: task performance was statistically indistinguishable on six of seven tasks.
- The higher SUS score and lower mental workload suggest that the known steep learning curve of the STC is at least partially a desktop-interaction problem, not an inherent property of the 3D representation.
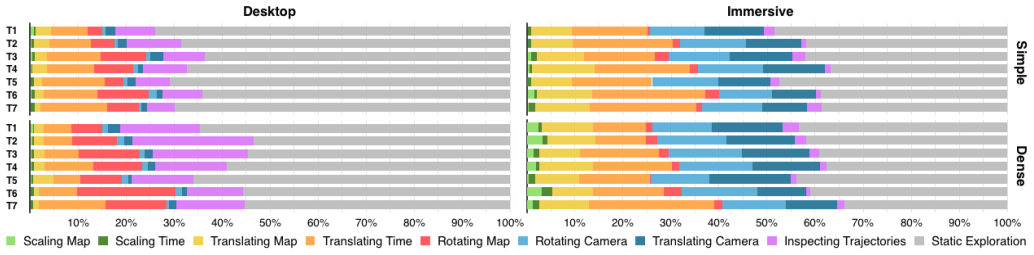
- Because immersive and desktop users distribute their time across different interactions—head motion and scaling versus cube rotation and hovering—interaction log analysis can serve as a diagnostic tool in future STC evaluations.
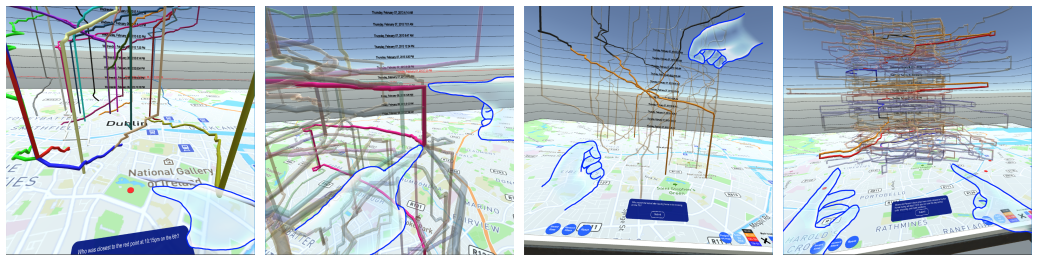
- On the instant-distance comparison task, increased data clutter hurt accuracy in the desktop condition but not in the immersive condition, hinting that immersion may help when many trajectories overlap.
- The negligible simulator sickness scores support the seated desk-based metaphor as a viable configuration for VR data-analysis sessions of roughly 25 minutes.
Reading between the lines
- If the usability gap persists with domain experts and longer exposure, immersive desk-based STCs could become a practical on-ramp for organizations that already analyze movement data but avoid the STC because of its learning curve.
- One could test the mechanism directly by running the same seven tasks with the desktop baseline's extra rotation freedom removed: the paper's fairness assumption predicts immersive performance would then be equal or better, while a performance drop for desktop would indicate the immersive advantage is partly about interaction design rather than depth perception.
- The gesture constraints and precision complaints suggest hybrid interfaces—mid-air gestures plus fine-grained tangible sliders on the desk—as a natural next iteration, and the paper's own data already indicate that precision, not speed, is the weak point of the immersive approach.
- The much higher inspection count in desktop suggests users relied on tooltip readouts to compensate for poor depth and time estimation, which implies that adding prominent time labels directly on immersive trajectories might close the remaining gap in the simplest task.
Signed reviews
Editorial analysis
A structured set of objections, weighed in public.
Referee Report
Summary. The paper reports a controlled mixed-design user study (20 participants; 7 tasks; two between-subjects data-density scenarios) comparing an immersive Space-Time Cube system built on the VirtualDesk metaphor with a desktop STC baseline. The immersive condition uses mid-air gestures and tangible desk controls; the desktop condition uses a conventional Rotate-Pan-Dolly mouse/keyboard mapping. The central claims are that task completion times and accuracy are similar for most tasks, that the immersive system has substantially higher System Usability Scale scores and lower mental workload, that users strongly prefer it, and that it does not induce significant simulator sickness in roughly 25-minute sessions. The paper also analyzes logged interaction patterns to explain exploratory behaviour and offers design recommendations for future immersive STCs.
Significance. If the reported benefits reproduce, this is a useful contribution to immersive analytics and geovisualization: it is one of the first controlled evaluations of an immersive STC for full trajectory data, uses standard validated instruments (SUS, NASA-TLX, SSQ), tasks have objectively verifiable answers, and the study covers two clutter conditions. The design recommendations (e.g., gesture constraints, double-tap precision, remote selection) are actionable. However, the strength of the performance-parity claim and the interaction-analysis claims is currently undermined by inferential weaknesses; with revision, the subjective-results contribution should stand.
major comments (4)
- [§6.1 / Abstract] The statement that quantitative performance was 'similar for the majority of tasks' (Abstract; §6.1) is not supported by the reported analyses. The paper relies on non-significant Wilcoxon tests with n=20 overall and n=10 per between-subjects scenario to conclude parity. Absence of significant difference is not evidence of similarity, especially with small samples; no equivalence margins, confidence intervals, or power/achieved-power values are given. The results are also not uniformly null: T1 Dense was significantly slower in Immersive (p=.005) and T3 Simple was near-significant (p=.08). The authors should either perform equivalence tests (e.g., TOST with pre-specified bounds) or explicitly rephrase all such conclusions as 'no significant difference was detected' and discuss the sensitivity of the comparison.
- [§6.1] The paper reports a large number of pairwise comparisons (7 tasks × 2 scenarios × time and accuracy, plus TLX and SUS components) without any correction for multiple comparisons, and §6.1 presents selected p-values. With 28+ tests, the sparse significant results (T1 Dense time, T5 Dense success rate) may be false positives; at least one significant result would be expected by chance. Please report all tests, apply a multiplicity adjustment or justify a pre-registered exploratory framework, and interpret individual p-values accordingly.
- [§6.3 / Fig. 7] The claims that users in the immersive condition interacted more frequently (H4) and rotated less (H5) are supported only by descriptive stacked-bar plots; no inferential statistics are reported for interaction durations or counts. If these claims appear in the abstract ('large differences appear when we analyze the patterns of interaction'), they need formal tests (e.g., mixed-effects models on log-transformed durations, or permutation tests) or should be downgraded to observational findings.
- [§5.2] The fairness of the performance comparison rests on the assumption that the immersive metaphor's benefits compensate for the extra rotational degree of freedom available to desktop users. The direction of the potential bias is not quantified: if the extra DOF helped desktop (as the authors suspect), the parity result is conservative for the immersive condition, but if it hindered desktop, the comparison is unfair in the opposite direction. The manuscript should at least explicitly bound this bias, for example by reporting a follow-up comparison with a rotation-constrained desktop variant or by presenting a sensitivity analysis, to make the parity claim defensible.
minor comments (6)
- [§7.1] The statement that mental workload was '32% smaller' is inconsistent with the reported means (41.6 vs 32.4, a reduction of about 22%); please correct or clarify the calculation.
- [§5.4] The participant description says 13 reported no or low VR experience and only 5 were very experienced, which does not sum to 20; please clarify the remaining categories.
- [Fig. 5 / Fig. 7] Consider plotting individual participant values (e.g., raincloud or strip plots) rather than only means and standard deviations, especially with n=10 per scenario, and add significance annotations where tests are performed.
- [§6.4] The ranking data (e.g., 13/20 deemed Immersive fastest) are reported without any test of whether these proportions differ from chance; a binomial test would be a simple addition.
- [§7.3] The discussion of T2 contamination appears only in the results; consider moving this design/pilot observation to the methods or limitations section.
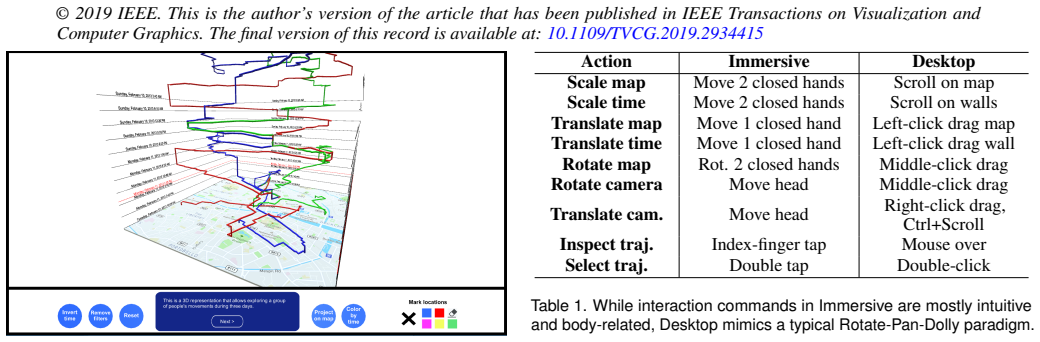
- [§3.3 / Table 1] The text 'Rot. 2 closed hands' and 'Move 2 closed hands' would benefit from a one-line explanation of the gesture-to-DOF mapping to avoid ambiguity for readers.
Circularity Check
No significant circularity: the paper is an empirical comparative user study whose claims are supported by observed measurements, not by self-referential definitions or fitted predictions.
full rationale
This is an empirical user study comparing an immersive Space-Time Cube prototype against a desktop baseline. The central claims (similar quantitative performance for most tasks, higher SUS, lower mental workload, low simulator sickness) are supported by observed data from standardized instruments (task completion times, success rates, SUS, NASA-TLX, SSQ) with no fitted parameters that are then renamed as predictions. The immersive design does build on the authors' prior VirtualDesk metaphor, cited as [51], but that citation is used as design rationale for choosing a desk-based interaction metaphor, not as evidence for the study's outcome claims; the results themselves come from the new user study. The acknowledged baseline asymmetry in Section 5.2 is an explicitly stated fairness assumption, not a definitional identity between the two conditions. The skeptic's concern that non-significant p-values with n=20 do not establish equivalence is an inferential and statistical-power issue, which the circularity criteria explicitly exclude from scoring unless accompanied by a demonstrated reduction of a prediction to its inputs. No such reduction, self-citation chain, or ansatz-smuggling pattern is present, so the appropriate finding is no significant circularity.
Assumptions & free parameters
assumptions (4)
- domain assumption The Space-Time Cube is an appropriate representation for the target spatio-temporal analysis tasks.
- domain assumption SUS, NASA-TLX, and SSQ capture the intended constructs in this VR setting.
- domain assumption The simulated Dublin trajectories from Amini et al. are representative enough for comparing exploration environments.
- domain assumption Novice participants with 3D game familiarity are an appropriate population for detecting perceptual and usability differences.
Cite this review
Pith. "Pith review of Evaluating an Immersive Space-Time Cube Geovisualization for Intuitive Trajectory Data Exploration." pith.science (2026). https://pith.science/paper/2ORRN4JS
@misc{pith2026190800580,
  author       = {Pith},
  title        = {Pith review of: Evaluating an Immersive Space-Time Cube Geovisualization for Intuitive Trajectory Data Exploration},
  year         = {2026},
  howpublished = {\url{https://pith.science/paper/2ORRN4JS}},
  note         = {Machine review of arXiv:1908.00580}
}
read the original abstract
A Space-Time Cube enables analysts to clearly observe spatio-temporal features in movement trajectory datasets in geovisualization. However, its general usability is impacted by a lack of depth cues, a reported steep learning curve, and the requirement for efficient 3D navigation. In this work, we investigate a Space-Time Cube in the Immersive Analytics domain. Based on a review of previous work and selecting an appropriate exploration metaphor, we built a prototype environment where the cube is coupled to a virtual representation of the analyst's real desk, and zooming and panning in space and time are intuitively controlled using mid-air gestures. We compared our immersive environment to a desktop-based implementation in a user study with 20 participants across 7 tasks of varying difficulty, which targeted different user interface features. To investigate how performance is affected in the presence of clutter, we explored two scenarios with different numbers of trajectories. While the quantitative performance was similar for the majority of tasks, large differences appear when we analyze the patterns of interaction and consider subjective metrics. The immersive version of the Space-Time Cube received higher usability scores, much higher user preference, and was rated to have a lower mental workload, without causing participants discomfort in 25-minute-long VR sessions.
Figures

Figures from the paper (5 more)

Reference graph
Works this paper leans on
-
[1]
F. Amini, S. Rufiange, Z. Hossain, Q. Ventura, P. Irani, and M. J. McGuffin. The impact of interactivity on comprehending 2D and 3D visualizations of movement data. IEEE Transactions on Visualization and Computer Graphics, 21(1):122–135, 2015. doi: 10.1109/TVCG.2014.2329308
-
[3]
N. Andrienko, G. Andrienko, and P. Gatalsky. Exploratory spatio-temporal visualization: An analytical review. Journal of Visual Languages & Computing, 14(6):503–541, 2003. doi: 10.1016/S1045-926X(03)00046-6
-
[4]
B. Bach, P. Dragicevic, D. Archambault, C. Hurter, and S. Carpendale. A review of temporal data visualizations based on space-time cube operations. In R. Borgo, R. Maciejewski, and I. Viola, eds., Eurographics Conference on Visualization - STARs. The Eurographics Association, 2014. doi: 10. 2312/eurovisstar.20141171
work page 2014
-
[5]
J. Bertin. Semiology of Graphics: Diagrams, Networks, Maps . ESRI Press, 2011
work page 2011
-
[6]
J. Brooke. SUS – A quick and dirty usability scale. In P. W. Jordan, B. Thomas, I. L. McClelland, and B. Weerdmeester, eds., Usability Evalu- ation in Industry. Taylor & Francis, 1996
work page 1996
-
[7]
F. Calabrese, L. Ferrari, and V . D. Blondel. Urban sensing using mobile phone network data: A survey of research. ACM Computing Surveys, 47(2):25:1–25:20, 2015. doi: 10.1145/2655691
-
[8]
T. Chandler, M. Cordeil, T. Czauderna, T. Dwyer, J. Glowacki, C. Goncu, M. Klapperstueck, K. Klein, K. Marriott, F. Schreiber, et al. Immersive analytics. In 2015 Big Data Visual Analytics (BDVA) , pp. 1–8. IEEE, September 2015. doi: 10.1109/BDV A.2015.7314296
arXiv 2015
-
[9]
J. Chen, S.-L. Shaw, H. Yu, F. Lu, Y . Chai, and Q. Jia. Exploratory data analysis of activity diary data: A space–time GIS approach. Journal of Transport Geography, 19(3):394–404, 2011. doi: 10.1016/j.jtrangeo.2010 .11.002
Show all 58 references
-
[10]
Cockburn, A
A. Cockburn, A. Karlson, and B. B. Bederson. A review of overview+detail, zooming, and focus+context interfaces. ACM Computing Surveys, 41(1):2:1–2:31, Jan. 2009. doi: 10.1145/1456650.1456652
2009
-
[11]
Coffey, N
D. Coffey, N. Malbraaten, T. Le, I. Borazjani, F. Sotiropoulos, and D. F. Keefe. Slice wim: A multi-surface, multi-touch interface for overview+detail exploration of volume datasets in virtual reality. In Sym- posium on Interactive 3D Graphics and Games, pp. 191–198. ACM, New ...
2011
-
[12]
Cordeil, B
M. Cordeil, B. Bach, Y . Li, E. Wilson, and T. Dwyer. Design space for spatio-data coordination: Tangible interaction devices for immersive information visualisation. In Proceedings of IEEE Pacific Visualization Symposium (PacificVis), pp. 46–50. IEEE, April 2017. doi: 10.1109/ ...
2017
-
[13]
Demˇsar and K
U. Demˇsar and K. Virrantaus. Space–time density of trajectories: Ex- ploring spatio-temporal patterns in movement data. International Journal of Geographical Information Science, 24(10):1527–1542, 2010. doi: 10. 1080/13658816.2010.511223
2010
-
[14]
Drouhard, C
M. Drouhard, C. A. Steed, S. Hahn, T. Proffen, J. Daniel, and M. Math- eson. Immersive visualization for materials science data analysis using the oculus rift. In 2015 IEEE International Conference on Big Data (Big Data), pp. 2453–2461. IEEE, October 2015. doi: 10.1109/BigData...
2015 doi
-
[15]
J. A. W. Filho, C. M. D. S. Freitas, and L. Nedel. Comfortable immersive analytics with the virtualdesk metaphor. IEEE Computer Graphics and Applications, 39(3):41–53, May 2019. doi: 10.1109/MCG.2019.2898856
2019
-
[16]
Gatalsky, N
P. Gatalsky, N. Andrienko, and G. Andrienko. Interactive analysis of event data using space-time cube. In International Conference on Information Visualisation (IV), pp. 145–152. IEEE, July 2004. doi: 10.1109/IV.2004. 1320137
2004 doi
-
[17]
Gonc ¸alves, A
T. Gonc ¸alves, A. P. Afonso, and B. Martins. Cartographic visualization of human trajectory data: Overview and analysis. Journal of Location Based Services, 9(2):138–166, 2015. doi: 10.1080/17489725.2015.1074736
2015
-
[18]
Gonc ¸alves, A
T. Gonc ¸alves, A. P. Afonso, and B. Martins. Why not both?: Combining 2D maps and 3D space-time cubes for human trajectory data visualization. In Proceedings of the 30th International BCS Human Computer Inter- action Conference: Fusion!, HCI ’16, pp. 22:1–22:10. BCS Learning ...
-
[19]
H¨agerstraand
T. H¨agerstraand. What about people in regional science? Papers in Regional Science, 24(1):7–24, 1970
1970
-
[20]
S. G. Hart. Nasa-task load index (NASA-TLX); 20 years later. In Pro- ceedings of the Human Factors and Ergonomics Society Annual Meeting, vol. 50, pp. 904–908. Sage Publications Sage CA: Los Angeles, CA, 2006
2006
-
[21]
Hurter, N
C. Hurter, N. H. Riche, S. M. Drucker, M. Cordeil, R. Alligier, and R. Vuillemot. Fiberclay: Sculpting three dimensional trajectories to reveal structural insights. IEEE Transactions on Visualization and Computer Graphics, 25(1):704–714, Jan 2019. doi: 10.1109/TVCG.2018.2865191
2019
-
[22]
Jankowski and M
J. Jankowski and M. Hachet. Advances in interaction with 3D environ- ments. Computer Graphics Forum, 34(1):152–190, 2015. doi: 10.1111/cgf .12466
2015 doi
-
[23]
Kapler and W
T. Kapler and W. Wright. Geotime information visualization. In IEEE Symposium on Information Visualization, pp. 25–32. IEEE, Oct 2004. doi: 10.1109/INFVIS.2004.27
2004 doi
-
[24]
R. S. Kennedy, J. M. Drexler, D. E. Compton, K. M. Stanney, D. S. Lanham, and D. L. Harm. Configural scoring of simulator sickness, cybersickness and space adaptation syndrome: Similarities and differences. In L. J. Hettinger and M. W. Haas, eds.,Virtual and adaptive environmen...
2003
-
[25]
Kjellin, L
A. Kjellin, L. W. Pettersson, S. Seipel, and M. Lind. Different levels of 3D: An evaluation of visualized discrete spatiotemporal data in space-time cubes. Information Visualization, 9(2):152–164, 2010. doi: 10.1057/ivs. 2009.8
2010 doi
-
[26]
Kjellin, L
A. Kjellin, L. W. Pettersson, S. Seipel, and M. Lind. Evaluating 2D and 3D visualizations of spatiotemporal information. ACM Transactions on Applied Perception (TAP), 7(3):19:1–19:23, 2010. doi: 10.1145/1773965. 1773970
2010 doi
-
[27]
M.-J. Kraak. The space-time cube revisited from a geovisualization per- spective. In Proc. 21st International Cartographic Conference, pp. 1988–
1988
-
[28]
M.-J. Kraak. Visualization viewpoints: Beyond geovisualization. IEEE Computer Graphics and Applications, 26(4):6–9, July 2006. doi: 10.1109/ MCG.2006.74
2006
-
[29]
M.-J. Kraak. Geovisualization and time – new opportunities for the space- time cube. Geographic visualization: Concepts, tools and applications, pp. 293–306, 2008. doi: 10.1002/9780470987643.ch15
2008 doi
-
[30]
P. O. Kristensson, N. Dahlback, D. Anundi, M. Bjornstad, H. Gillberg, J. Haraldsson, I. Martensson, M. Nordvall, and J. Stahl. An evaluation of space time cube representation of spatiotemporal patterns. IEEE Transac- tions on Visualization and Computer Graphics, 15(4):696–702,...
2009 doi
-
[31]
Kveladze, M
I. Kveladze, M. Kraak, and C. van Elzakker. Researching the usability of a geovisual analytics environment for the exploration and analysis of different datasets. In The 28th International Cartographic Conference, 2-7 July 2017, Washington DC, USA, 2017
2017
-
[32]
Kveladze and M.-J
I. Kveladze and M.-J. Kraak. What do we know about the space-time cube from cartographic and usability perspective. Columbus, Ohio, USA: Proceedings of Autocarto, pp. 16–18, 2012
2012
-
[33]
Kveladze, M.-J
I. Kveladze, M.-J. Kraak, and C. P. van Elzakker. A methodological framework for researching the usability of the space-time cube. The Cartographic Journal, 50(3):201–210, 2013. doi: 10.1179/1743277413Y. 0000000061
2013 doi
-
[34]
Kveladze, M.-J
I. Kveladze, M.-J. Kraak, and C. P. Van Elzakker. The space-time cube as part of a geovisual analytics environment to support the understanding of movement data. International Journal of Geographical Information Science, 29(11):2001–2016, 2015. doi: 10.1080/13658816.2015.1058386
2001
-
[35]
Kveladze, M.-J
I. Kveladze, M.-J. Kraak, and C. P. van Elzakker. Cartographic design and the space-time cube. The Cartographic Journal, 56(1):73–90, 2019. doi: 10.1080/00087041.2018.1495898
2019
-
[36]
Kveladze, S
I. Kveladze, S. van der Spek, and M.-J. Kraak. The recognition of temporal patterns in pedestrian behaviour using visual exploration tools. In 7th In- ternational Conference, GIScience 2012, Columbus, OH, USA, September, Proceedings 7478 (Paperback), 2012
2012
-
[37]
O.-H. Kwon, C. Muelder, K. Lee, and K.-L. Ma. A study of layout, rendering, and interaction methods for immersive graph visualization. IEEE Transactions on Visualization and Computer Graphics, 22(7):1802– 1815, July 2016. doi: 10.1109/TVCG.2016.2520921
2016
-
[38]
X. Li, A. C ¸¨oltekin, and M.-J. Kraak. Visual exploration of eye move- ment data using the space-time-cube. In International Conference on Geographic Information Science, pp. 295–309. Springer, 2010. doi: 10. 1007/978-3-642-15300-6 21
2010
-
[39]
Marriott, F
K. Marriott, F. Schreiber, T. Dwyer, K. Klein, N. H. Riche, T. Itoh, W. Stuerzlinger, and B. H. Thomas, eds. Immersive Analytics, vol. 11190 10 © 2019 IEEE. This is the author’s version of the article that has been published in IEEE Transactions on Visualization and Computer G...
2019
-
[40]
M. R. Mine, F. P. Brooks Jr, and C. H. Sequin. Moving objects in space: Exploiting proprioception in virtual-environment interaction. In Proceed- ings of the 24th Annual Conference on Computer Graphics and Interactive Techniques, pp. 19–26. ACM Press/Addison-Wesley Publishing ...
1997
-
[41]
J. D. Morgan. A visual time-geographic approach to crime mapping. The Florida State University, 2010
2010
-
[42]
Nguyen, F
H. Nguyen, F. Wang, R. Williams, U. Engelke, A. Kruger, and P. d. Souza. Immersive visual analysis of insect flight behaviour. InIEEE VIS Workshop on Immersive Analytics: Exploring Future Interaction and Visualization Technologies for Data Analytics. IEEE, 2017
2017
-
[43]
Noulas, S
A. Noulas, S. Scellato, C. Mascolo, and M. Pontil. An empirical study of geographic user activity patterns in foursquare. In Fifth International AAAI Conference on Weblogs and Social Media. AAAI, 2011
2011
-
[44]
Okada, M
K. Okada, M. Yoshida, T. Itoh, T. Czauderna, and K. Stephens. VR system for spatio-temporal visualization of tweet data. In International Conference Information Visualisation (IV), pp. 91–95, July 2018. doi: 10. 1109/iV.2018.00026
2018
-
[45]
J. Pallant. SPSS survival manual. McGraw-Hill Education (UK), 2013
2013
-
[46]
D. J. Peuquet. It’s about time: A conceptual framework for the representa- tion of temporal dynamics in geographic information systems. Annals of the Association of American Geographers, 84(3):441–461, 1994. doi: 10. 1111/j.1467-8306.1994.tb01869.x
1994
-
[47]
Saenz, A
M. Saenz, A. Baigelenov, Y .-H. Hung, and P. Parsons. Reexamining the cognitive utility of 3D visualizations using augmented reality holograms. In IEEE VIS Workshop on Immersive Analytics: Exploring Future Interac- tion and Visualization Technologies for Data Analytics. IEEE, 2017
2017
-
[48]
K. A. Satriadi, B. Ens, M. Cordeil, T. Czauderna, W. Willett, and B. Jenny. Augmented reality map navigation with freehand gestures. In Proceedings of the 26th IEEE Conference on Virtual Reality and 3D User Interfaces. IEEE, March 2019
2019
-
[49]
S. Y . Ssin, J. A. Walsh, R. T. Smith, A. Cunningham, and B. H. Thomas. Geogate: Correlating geo-temporal datasets using an augmented reality space-time cube and tangible interactions. In Proceedings of the 26th IEEE Conference on Virtual Reality and 3D User Interfaces, March 2019
2019
-
[50]
J. Theuns. Visualising origin-destination data with virtual reality: Func- tional prototypes and a framework for continued VR research at the itc faculty. B.S. thesis, University of Twente, 2017
2017
-
[51]
J. A. Wagner Filho, C. M. Freitas, and L. Nedel. VirtualDesk: A Com- fortable and Efficient Immersive Information Visualization Approach. Computer Graphics Forum, 37(3):415–426, 2018. doi: 10.1111/cgf.13430
2018 doi
-
[52]
J. A. Wagner Filho, M. F. Rey, C. M. D. S. Freitas, and L. Nedel. Immersive visualization of abstract information: An evaluation on dimensionally- reduced data scatterplots. In Proceedings of the 25th IEEE Conference on Virtual Reality and 3D User Interfaces. IEEE, March 2018
2018
-
[53]
Walsh, A
J. Walsh, A. Cunningham, R. Smith, and B. Thomas. Tangible braille plot: Tangibly exploring geo-temporal data in virtual reality. In 2018 International Symposium on Big Data Visual and Immersive Analytics (BDVA), pp. 1–6. IEEE, 2018
2018
-
[54]
J. A. Walsh, J. Zucco, R. T. Smith, and B. H. Thomas. Temporal-geospatial cooperative visual analysis. In 2016 Big Data Visual Analytics (BDVA), pp. 1–8, Nov 2016. doi: 10.1109/BDV A.2016.7787050
2016
-
[55]
C. Ware. Information Visualization: Perception for Design . Morgan Kaufmann Publishers Inc., San Francisco, CA, USA, 2nd ed., 2004. doi: 10.1016/B978-155860819-1/50001-7
2004 doi
-
[56]
Wilcoxon
F. Wilcoxon. Individual comparisons by ranking methods. Biometrics Bulletin, 1(6):80–83, 1945
1945
-
[57]
Willems, H
N. Willems, H. Van De Wetering, and J. J. Van Wijk. Evaluation of the visibility of vessel movement features in trajectory visualizations. Computer Graphics Forum, 30(3):801–810, June 2011. doi: 10.1111/j. 1467-8659.2011.01929.x
2011
-
[58]
R. Yao, T. Heath, A. Davies, T. Forsyth, N. Mitchell, and P. Hoberman. Oculus VR best practices guide. Oculus VR, 2014
2014
-
[59]
Zielasko, B
D. Zielasko, B. Weyers, M. Bellgardt, S. Pick, A. Meibner, T. Vierjahn, and T. W. Kuhlen. Remain seated: Towards fully-immersive desktop VR. In IEEE 3rd Workshop on Everyday Virtual Reality (WEVR), pp. 1–6. IEEE, March 2017. doi: 10.1109/WEVR.2017.7957707 11
2017
Reviewed August 14, 2026 · model on record in the stance chip above.
Discussion (0). Continue with ORCID to comment.