REVIEW 3 major objections 4 minor 92 references
Color Crafting: Automating the Construction of Designer Quality Color Ramps
T0 review · 3 major / 4 minor · reviewed 2026-08-14 · deepseek-v4-flash
Pith's one-line read A design-mining pipeline turns a single seed color into color ramps that match expert-crafted ramps on accuracy and aesthetics.
desk verdict A genuinely new design-mining method for color ramps with a solid user study, but the headline parity-with-designers claim is not fully tested because the evaluation is partly in-sample. read the letter →
The pith
A machine-rendered reading of the paper's core claim, the machinery that carries it, and where it could break.
The reading
What carries the argument
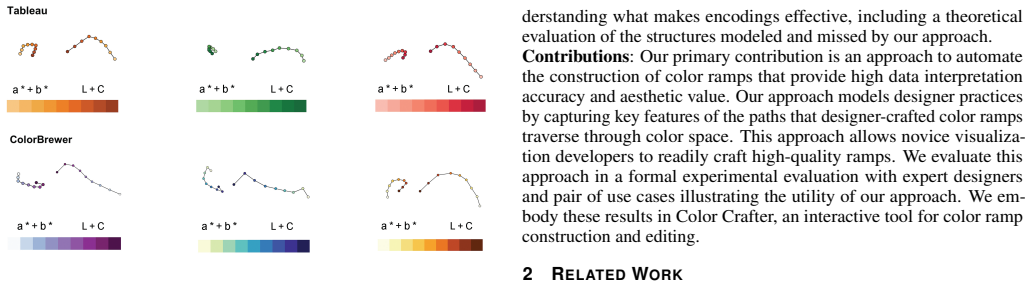
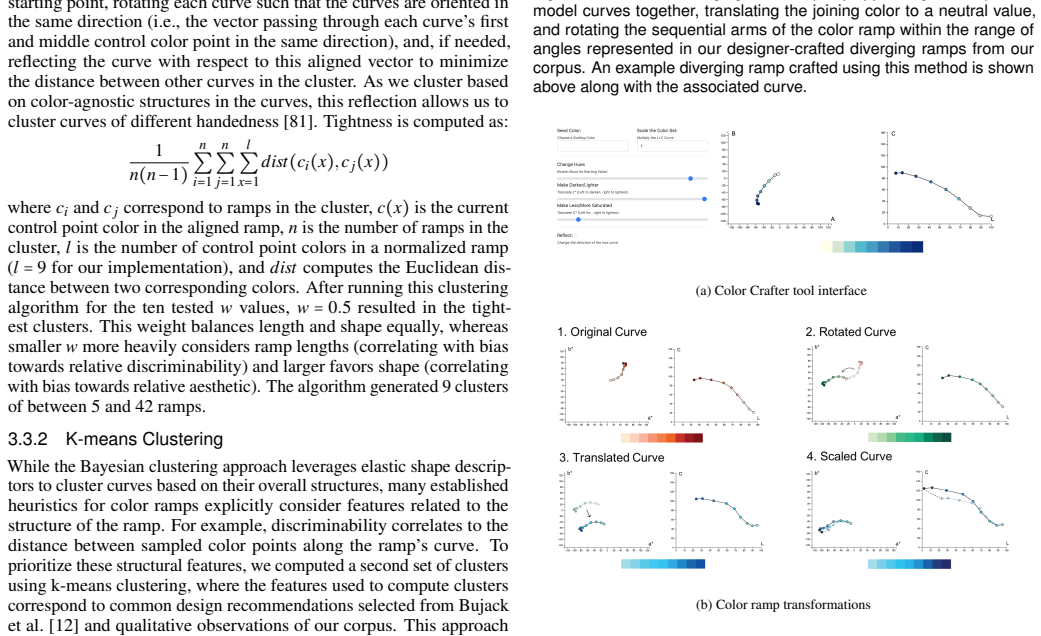
The load-bearing object is the model curve: an interpolating cubic B-spline fitted through a designer ramp's colors in CIELAB, resampled to nine equally spaced control points, then clustered by shape. Bayesian clustering uses the square-root velocity function, a scale-invariant elastic shape metric, augmented with a curve-length term weighted 0.5 after a tightness search. K-means clustering uses eight hand-selected features (local angles, summed angles, discriminability, length, speed, acceleration, curvature, turning points), and an exhaustive feature selection settles on nine clusters. Each cluster's mean curve becomes a reusable structural template. Seeding translates the template in $L^*$ to match the seed's luminance and in the $a^*$–$b^*$ plane to land exactly on the seed color, so all other ramp colors inherit the designer pattern's relative geometry.
What would settle it
Sample seed colors uniformly across CIELAB instead of within $\Delta E=3$ of the corpus colors, rerun the same reading task with the same 31-participant protocol, and check whether k-means ramps still beat linear ramps on error and aesthetics; if the advantage disappears, the structural models only reproduce the corpus rather than general designer practice.
Extended reading notes
Core claim
The central discovery is that the relative structure of the path a color ramp traverses in CIELAB — how luminance, chroma, and hue twist along the sequence — carries most of what makes a ramp effective, more so than the specific colors used. The authors formalize this by fitting cubic B-splines to 222 handcrafted ramps, resampling each to nine control points, clustering the curves with Bayesian and k-means methods, and averaging each cluster into a representative model curve. A single seed color anchors a representative curve in color space via luminance alignment and $a^*$–$b^*$ translation, and affine edits let users tune the result. In their crowdsourced study, k-means ramps yielded lower value-estimation error than linear ramps ($\mu=0.495$ vs $0.649$, $p<.05$), and both generated ramp types received significantly higher pleasantness ratings than linear ramps, with no significant difference from designer ramps.
Load-bearing premise
The method and its evaluation rest on the assumption that the 222 collected ramps (180 sequential ones used for the main models) fairly represent high-quality designer practice and the color choices novices actually make; if that corpus is narrow or idiosyncratic, the claimed parity with designer ramps will not generalize to arbitrary seed colors.
Editorial extensions
If this is right
- A novice can enter one brand or semantic color and receive a ramp with value-reading accuracy and pleasantness comparable to handcrafted ramps.
- Diverging ramps can be assembled by pairing two sequential model curves with arm angles near the 115-degree average measured in the corpus.
- Because relative structure, not absolute colors, drives the result, the same templates produce reasonable ramps even from conventionally 'ugly' seed colors.
- The 18 discovered design patterns form a taxonomy of designer ramp structures that can seed generative tools and future theory of color encoding design.
- Expanding or reweighting the ramp corpus could extend the approach to high-variance structures such as rainbow or cubehelix maps without manual tuning.
Reading between the lines
- A natural next step the paper does not take is to treat the model curves as a prior and generate on demand, letting downstream constraints such as color-vision deficiency, mark size, or task type filter or re-rank patterns before presentation.
- The same design-mining recipe — collect expert artifacts, fit continuous curves in a perceptual space, cluster by shape, seed with one parameter — could apply to other nuanced visual channels such as shape or texture.
- If relative structure is what matters, ramp quality might one day be scored directly from curve statistics like length, curvature, and hue twists rather than from user tests, though the paper stops short of claiming this.
- The lightness-first seeding convention is an implicit design choice; ramps where hue rather than lightness carries the order could require different seeding rules, which the paper leaves unexplored.
Signed reviews
Editorial analysis
A structured set of objections, weighed in public.
Referee Report
Summary. This paper proposes Color Crafter, a design-mining approach that constructs color ramps by clustering expert-designed ramps and generating representative curves in CIELAB, which can be anchored to a single user-selected seed color. The authors build a corpus of 222 designer ramps, normalize them as B-spline curves, cluster them with Bayesian and k-means methods, and evaluate the resulting ramps in a crowdsourced user study with design practitioners. The results show that k-means ramps significantly outperformed linear ramps on value-reading accuracy and that k-means and Bayesian ramps were rated significantly more aesthetically pleasing than linear ramps; non-significant differences favored generated ramps over designer ramps. The paper also presents replication and 'ugly color' use cases and releases the corpus and study data.
Significance. If the claims hold, the work is practically valuable: it offers a simple single-seed workflow for generating sequential and diverging ramps, it reframes ramp design as a data-driven modeling problem, and it provides an open corpus and study data that others can build on. The empirical study is a notable strength: it uses designers as participants, multiple visualization types, and both accuracy and aesthetic measures. The k-means versus linear comparison is a meaningful result. However, the headline claim of parity with designer ramps is currently supported only for seeds sampled near the training corpus, and the model-selection procedure does not use held-out data. The central contribution is therefore defensible but requires either a narrowing of the claim or additional out-of-sample evaluation.
major comments (3)
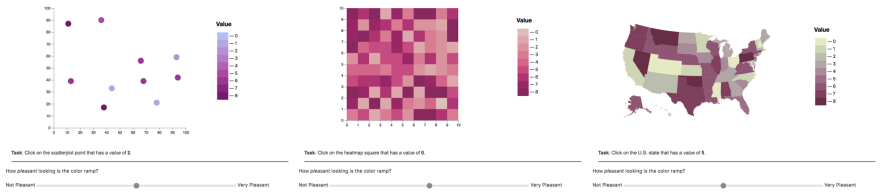
- [§4.1, Stimuli; §3.5] The comparison to designer ramps is in-sample. The designer baseline ramps are 'randomly selected from the corpus of 180 sequential ramps used to guide our models,' and the seed colors for k-means, Bayesian, and linear ramps are drawn from 'all integer colors within ΔE=3 of each color in our corpus' (§4.1). Because the model curves in §3.4 are averages of clustered training curves, the generated ramps are anchored near the same colors that defined the models and are compared against the same ramps used for training. The significant k-means-vs-linear advantage is valid for that seed distribution, but the abstract's claim that the models produce ramps 'at least as well as designer ramps' for the general case of a user's arbitrary seed color is not tested. Please either restrict the claim to near-corpus seed colors or add a held-out evaluation with seeds outside the corpus and designer ramps excluded from the training set.
- [§3.3.1, §3.3.2] The choices of w=0.5, k=9, and the k-means feature subset are selected by minimizing tightness computed on the full corpus without any holdout. Because the same 180 ramps later provide both the designer baselines and the seed-color distribution in §4.1, the tightness criterion is not independent evidence that the cluster structure generalizes. Report cross-validated or held-out model-selection results, or explicitly acknowledge that the model parameters are fitted to the evaluation corpus and that the user study therefore tests a partially in-sample configuration.
- [§4.1, Results; §5] The claim that generated ramps are 'at least as good as' designer ramps is based on non-significant differences: k-means error (μ=0.495) and Bayesian aesthetic ratings are numerically better than designer ramps but the differences are not significant. A non-significant difference in a study designed to detect differences cannot by itself establish equivalence or non-inferiority. Please provide an equivalence or non-inferiority analysis with a pre-specified margin, or soften the wording to 'no significant difference was found' wherever the 'at least as well' claim appears, including the abstract and Section 5.
minor comments (4)
- [§4.2] The replication case study uses manual affine transformations and selection of the model 'most similar' to the original ramp, and the match is assessed visually. Report a quantitative color-difference metric (e.g., mean ΔE between the reconstructed and original ramps) so readers can judge how close the matches are, and clarify that this use case demonstrates editability rather than unedited automatic reproduction.
- [§5, Discussion] The random-seed pilot is cited as supporting evidence with means and standard errors but no procedural details. Either provide the full methodology in the supplement or present the pilot as anecdotal rather than as a formal result.
- [§5.1, Limitations] The text says 'Generalized Adversarial Networks (GANs)'; the standard term is 'Generative Adversarial Networks.'
- [§2.2, Related Work] The tool name 'PRAVDAColor' is rendered with an erroneous space as 'PRA VDAColor' in the text; fix the rendering.
Circularity Check
In-sample evaluation: designer baselines and seed colors both derive from the 180-ramp training corpus, so the parity claim partly reduces to a cluster-average reconstruction of the training ramps.
-
fitted input called prediction
[Section 3.4 (Model Construction) and Section 4.1 (Empirical Study, Stimuli)]
"We then construct a representative curve for each cluster that we can then use to generate ramps reflecting each pattern. ... We compute the mean curve as the mean relative position of each control point: c′(x)= ∑n i=1 ci(x) n ... Our designer ramps were randomly selected from the corpus of 180 sequential ramps used to guide our models. ... Seeding colors in the k-means, Bayesian, and linear conditions were drawn from a set of 15,581 colors. This color set contains all integer colors within ∆E= 3 of each color in our corpus of 180 designer ramps to avoid confounds from hue preferences."
The representative model is defined, in Eq. c′(x)=..., as the mean of the aligned training curves; generated ramps are these mean curves anchored to a seed. The designer baseline is randomly drawn from the same 180 sequential ramps that produced the clusters, and the seeds are sampled within ∆E=3 of those same ramps' colors. The abstract's claim that generated ramps work 'at least as well as designer ramps' therefore compares cluster-averaged reconstructions against the very training examples used to build them, so that leg of the claim reduces to a reconstruction check on the training corpus rather than a test of generalization to held-out designers or arbitrary seed colors.
full rationale
No self-citation chain or imported uniqueness theorem is load-bearing; the Bayesian clustering algorithm is cited to prior external work (Zhang et al. [91]) and the evaluation is an independent human-subject experiment. The central issue is that the designer-quality benchmark is in-sample: the model curves are averages of the training corpus, the designer baseline ramps are sampled from that same corpus, and the generator seeds are restricted to a small chromatic neighborhood of corpus colors. Consequently, the parity result demonstrates that a cluster mean can approximate its own training members, not that the method generalizes to arbitrary novice seed colors or to designer practice outside the collection. The paper itself flags this dependence in Section 5.1 ('The performance of our approach is determined by the quality of the designer-crafted color ramps that we collect'; 'Future work should explore how sensitive our approach is to the training ramp distribution'). The linear-interpolation comparison and the raw accuracy/aesthetic measurements retain independent evidential value, which is why the overall circularity is partial rather than total.
Assumptions & free parameters
free parameters (7)
- w (SRVF length-weight) =
0.5
- k (number of k-means clusters) =
9
- k-means feature subset =
sum of angles, length, curvature, turning points
- normalized ramp length =
9 colors
- diverging arm angle =
115 degrees
- diverging hue rotation bounds =
±60 degrees
- seed color translation rule =
translate to nearest control point in L*, then match a*-b*
assumptions (6)
- domain assumption The 222-ramp corpus (180 sequential) is representative of high-quality designer color ramp practice.
- domain assumption CIELAB is an adequate perceptual space for measuring color differences and curve structure.
- domain assumption The tightness metric (mean pairwise Euclidean distance between aligned control points) measures cluster quality relevant to ramp quality.
- domain assumption Interpolating cubic B-splines resampled by arc length preserve the structure of designer ramps.
- domain assumption Mean curves of aligned clusters are valid representative models of designer practice.
- domain assumption Point estimation accuracy and pleasantness ratings in the crowdsourced study measure ramp quality.
Cite this review
Pith. "Pith review of Color Crafting: Automating the Construction of Designer Quality Color Ramps." pith.science (2026). https://pith.science/paper/WQMZY4SR
@misc{pith2026190800629,
  author       = {Pith},
  title        = {Pith review of: Color Crafting: Automating the Construction of Designer Quality Color Ramps},
  year         = {2026},
  howpublished = {\url{https://pith.science/paper/WQMZY4SR}},
  note         = {Machine review of arXiv:1908.00629}
}
read the original abstract
Visualizations often encode numeric data using sequential and diverging color ramps. Effective ramps use colors that are sufficiently discriminable, align well with the data, and are aesthetically pleasing. Designers rely on years of experience to create high-quality color ramps. However, it is challenging for novice visualization developers that lack this experience to craft effective ramps as most guidelines for constructing ramps are loosely defined qualitative heuristics that are often difficult to apply. Our goal is to enable visualization developers to readily create effective color encodings using a single seed color. We do this using an algorithmic approach that models designer practices by analyzing patterns in the structure of designer-crafted color ramps. We construct these models from a corpus of 222 expert-designed color ramps, and use the results to automatically generate ramps that mimic designer practices. We evaluate our approach through an empirical study comparing the outputs of our approach with designer-crafted color ramps. Our models produce ramps that support accurate and aesthetically pleasing visualizations at least as well as designer ramps and that outperform conventional mathematical approaches.
Figures


Figures from the paper (6 more)




Reference graph
Works this paper leans on
-
[1]
https://github.com/gka/chroma.js/
chroma.js. https://github.com/gka/chroma.js/
-
[2]
http://tristen.ca/hcl-picker
Color picker for data. http://tristen.ca/hcl-picker
-
[3]
http://tools.medialab.sciences-po.fr/iwanthue
iwanthue. http://tools.medialab.sciences-po.fr/iwanthue
-
[4]
https://www.susielu.com/data-viz/viz-palette
Vizpalettes. https://www.susielu.com/data-viz/viz-palette
-
[5]
G. Aisch. Chroma.js color scale helper
-
[6]
Bartram, A
L. Bartram, A. Patra, and M. Stone. Affective color in visualization. In Proceedings of the 2017 CHI Conference on Human Factors in Computing Systems, pp. 1364–1374. ACM, 2017
2017
-
[7]
Behrisch, M
M. Behrisch, M. Blumenschein, N. W. Kim, L. Shao, M. El-Assady, J. Fuchs, D. Seebacher, A. Diehl, U. Brandes, H. Pfister, et al. Quality metrics for information visualization. In Computer Graphics Forum , vol. 37, pp. 625–662. Wiley Online Library, 2018
2018
-
[8]
L. D. Bergman, B. E. Rogowitz, and L. A. Treinish. A rule-based tool for assisting colormap selection. In Proceedings of Visualization ’95, pp. 118–125. IEEE, 1995
1995
Show all 92 references
-
[9]
J. Birch. Worldwide prevalence of red-green color deficiency. J. Opt. Soc. Am. A, 29(3):313–320, Mar 2012. doi: 10.1364/JOSAA.29.000313
2012 doi
-
[10]
C. A. Brewer. Color use guidelines for data representation. In Proceedings of the Section on Statistical Graphics, American Statistical Association, pp. 55–60. American Statistical Association Alexandria, V A, 1999
1999
-
[11]
T. Brown. Colorpicker for data
-
[12]
Bujack, T
R. Bujack, T. L. Turton, F. Samsel, C. Ware, D. H. Rogers, and J. Ahrens. The good, the bad, and the ugly: A theoretical framework for the assess- ment of continuous colormaps. IEEE transactions on visualization and computer graphics, 24(1):923–933, 2018
2018
-
[13]
Cie publication no
CIE. Cie publication no. 15.2. Commission Internationale de leclairage, Vienna, pp. 19–20, 1986
1986
-
[14]
J. Clark. The ishihara test for color blindness. American Journal of Physiological Optics, 1924
1924
-
[15]
W. S. Cleveland and R. McGill. Graphical perception: Theory, experimen- tation, and application to the development of graphical methods. Journal of the American Statistical Association, 79(387):531–554, 1984
1984
-
[16]
Correll, D
M. Correll, D. Moritz, and J. Heer. Value-suppressing uncertainty palettes. In Proceedings of the 2018 CHI Conference on Human Factors in Com- puting Systems, p. 642. ACM, 2018
2018
-
[17]
Dasgupta, J
A. Dasgupta, J. Poco, B. Rogowitz, K. Han, E. Bertini, and C. T. Silva. The effect of color scales on climate scientists’ objective and subjective perfor- mance in spatial data analysis tasks. IEEE transactions on visualization and computer graphics, 2018
2018
-
[18]
Demiralp, M
C ¸. Demiralp, M. S. Bernstein, and J. Heer. Learning perceptual kernels for visualization design. IEEE transactions on visualization and computer graphics, 20(12):1933–1942, 2014
1933
-
[19]
Dragicevic
P. Dragicevic. Fair statistical communication in hci. In Modern Statistical Methods for HCI, pp. 291–330. Springer, 2016
2016
-
[20]
El-Said, G
M. El-Said, G. Fischer, S. Gamalel-Din, and M. Zaki. Addi: A tool for automating the design of visual interfaces. Computers & Graphics, 21(1):79–87, 1997
1997
-
[21]
M. D. Fairchild. Color Appearance Models. John Wiley & Sons, 2013
2013
-
[22]
Filonik and D
D. Filonik and D. Baur. Measuring aesthetics for information visualization. In 2009 13th International Conference Information Visualisation, pp. 579–
2009
-
[23]
J. D. Foley, F. D. Van, A. Van Dam, S. K. Feiner, J. F. Hughes, J. HUGHES, and E. ANGEL. Computer graphics: principles and practice, vol. 12110. Addison-Wesley Professional, 1996
1996
-
[24]
Ford and A
A. Ford and A. Roberts. Colour space conversions.Westminster University, London, 1998:1–31, 1998
1998
-
[25]
I. J. Goodfellow, J. Shlens, and C. Szegedy. Explaining and harnessing adversarial examples. arXiv preprint arXiv:1412.6572, 2014
2014 arXiv
-
[26]
C. C. Gramazio, D. H. Laidlaw, and K. B. Schloss. Colorgorical: Creating discriminable and preferable color palettes for information visualization. IEEE transactions on visualization and computer graphics, 23(1):521–530, 2017
2017
-
[27]
Harrower and C
M. Harrower and C. A. Brewer. Colorbrewer. org: an online tool for selecting colour schemes for maps. The Cartographic Journal, 40(1):27– 37, 2003
2003
-
[28]
Heer and M
J. Heer and M. Stone. Color naming models for color selection, image editing and palette design. In Proceedings of the SIGCHI Conference on Human Factors in Computing Systems, pp. 1007–1016. ACM, 2012
2012
-
[29]
A. C. Hurlbert and Y . Ling. Biological components of sex differences in color preference. Current Biology, 17(16):R623–R625, 2007
2007
-
[30]
Jahanian, S
A. Jahanian, S. Keshvari, S. Vishwanathan, and J. P. Allebach. Colors– messengers of concepts: Visual design mining for learning color semantics. ACM Transactions on Computer-Human Interaction (TOCHI), 24(1):2, 2017
2017
-
[31]
Jahanian, S
A. Jahanian, S. Vishwanathan, and J. P. Allebach. Learning visual balance from large-scale datasets of aesthetically highly rated images. In Human Vision and Electronic Imaging XX, vol. 9394, p. 93940Y . International Society for Optics and Photonics, 2015
2015
-
[32]
D. Koop, C. E. Scheidegger, S. P. Callahan, J. Freire, and C. T. Silva. Viscomplete: Automating suggestions for visualization pipelines. IEEE Transactions on Visualization and Computer Graphics, 14(6):1691–1698, 2008
2008
-
[33]
P. Kovesi. Good colour maps: How to design them. arXiv preprint arXiv:1509.03700, 2015
2015 arXiv
-
[34]
Kumar, A
R. Kumar, A. Satyanarayan, C. Torres, M. Lim, S. Ahmad, S. R. Klemmer, and J. O. Talton. Webzeitgeist: design mining the web. In Proceedings of the SIGCHI Conference on Human Factors in Computing Systems, pp. 3083–3092. ACM, 2013
2013
-
[35]
E. R. Landa and M. D. Fairchild. Charting color from the eye of the beholder: A century ago, artist albert henry munsell quantified colors based on how they appear to people; specializations of his system are still in wide scientific use. American Scientist, 93(5):436–443, 2005
2005
-
[36]
A. Lang. Aesthetics in information visualization. Trends in Information Visualization, 8, 2009
2009
-
[37]
Lau and A
A. Lau and A. V . Moere. Towards a model of information aesthetics in information visualization. In 2007 11th International Conference Infor- mation Visualization (IV’07), pp. 87–92. IEEE, 2007
2007
-
[38]
S. Lee, M. Sips, and H.-P. Seidel. Perceptually driven visibility optimiza- tion for categorical data visualization. IEEE Transactions on Visualization and Computer Graphics, 19(10):1746–1757, 2013
2013
-
[39]
Levkowitz
H. Levkowitz. Perceptual steps along color scales. International Journal of Imaging Systems and Technology, 7(2):97–101, 1996
1996
-
[40]
Levkowitz and G
H. Levkowitz and G. T. Herman. Color scales for image data. IEEE Computer Graphics and Applications, (1):72–80, 1992
1992
-
[41]
S. Lin, J. Fortuna, C. Kulkarni, M. Stone, and J. Heer. Selecting semantically-resonants for data visualization. In Computer Graphics Forum, vol. 32, pp. 401–410. Wiley Online Library, 2013
2013
-
[42]
S. Lin, D. Ritchie, M. Fisher, and P. Hanrahan. Probabilistic color-by- numbers: Suggesting pattern colorizations using factor graphs. ACM Transactions on Graphics (TOG), 32(4):37, 2013
2013
-
[43]
Ling and A
Y . Ling and A. C. Hurlbert. A new model for color preference: Universality and individuality. In Color and Imaging Conference, vol. 2007, pp. 8–11. Society for Imaging Science and Technology, 2007
2007
-
[44]
Liu and J
Y . Liu and J. Heer. Somewhere over the rainbow: An empirical assessment of quantitative colormaps. In Proceedings of the 2018 CHI Conference on Human Factors in Computing Systems, p. 598. ACM, 2018
2018
-
[45]
A. M. MacEachren, R. E. Roth, J. O’Brien, B. Li, D. Swingley, and M. Gahegan. Visual semiotics & uncertainty visualization: An empiri- cal study. IEEE Transactions on Visualization and Computer Graphics, 18(12):2496–2505, 2012
2012
-
[46]
Mackinlay
J. Mackinlay. Automating the design of graphical presentations of rela- tional information. Acm Transactions On Graphics (Tog), 5(2):110–141, 1986
1986
-
[47]
McDonald and K
R. McDonald and K. J. Smith. Cie94-a new colour-difference formula. Journal of the Society of Dyers and Colourists, 111(12):376–379, 1995
1995
-
[48]
B. J. Meier, A. M. Spalter, and D. B. Karelitz. Interactive color palette tools. IEEE Computer Graphics and Applications, 24(3):64–72, 2004
2004
-
[49]
G. W. Meyer and D. P. Greenberg. Perceptual color spaces for computer graphics. ACM SIGGRAPH Computer Graphics, 14(3):254–261, 1980
1980
-
[50]
Mittelst¨adt, J
S. Mittelst¨adt, J. Bernard, T. Schreck, M. Steiger, J. Kohlhammer, and D. A. Keim. Revisiting perceptually optimized color mapping for high- dimensional data analysis. In EuroVis 2014: the Eurographics Conference on Visualization, pp. 91–95, 2014
2014
-
[51]
Mittelst¨adt, D
S. Mittelst¨adt, D. J¨ackle, F. Stoffel, and D. A. Keim. Colorcat: Guided design of colormaps for combined analysis tasks. In Eurographics Confer- ence on Visualization (EuroVis)-Short Papers. The Eurographics Associa- tion, 2015
2015
-
[52]
Mittelst¨adt and D
S. Mittelst¨adt and D. A. Keim. Efficient contrast effect compensation with personalized perception models. In Computer Graphics Forum, vol. 34, pp. 211–220. Wiley Online Library, 2015
2015
-
[53]
Moreland
K. Moreland. Diverging color maps for scientific visualization. In Inter- national Symposium on Visual Computing, pp. 92–103. Springer, 2009
2009
-
[54]
Moritz, C
D. Moritz, C. Wang, G. L. Nelson, H. Lin, A. M. Smith, B. Howe, and J. Heer. Formalizing visualization design knowledge as constraints: Ac- tionable and extensible models in draco. IEEE transactions on visualiza- tion and computer graphics, 25(1):438–448, 2019
2019
-
[55]
Moroney, M
N. Moroney, M. D. Fairchild, R. W. Hunt, C. Li, M. R. Luo, and T. New- man. The ciecam02 color appearance model. In Color and Imaging Conference, vol. 2002, pp. 23–27. Society for Imaging Science and Tech- nology, 2002
2002
-
[56]
Moshagen and M
M. Moshagen and M. T. Thielsch. Facets of visual aesthetics.International Journal of Human-Computer Studies, 68(10):689–709, 2010
2010
-
[57]
Padilla, P
L. Padilla, P. S. Quinan, M. Meyer, and S. H. Creem-Regehr. Evaluating the impact of binning 2d scalar fields. IEEE transactions on visualization and computer graphics, 23(1):431–440, 2017
2017
-
[58]
S. E. Palmer and K. B. Schloss. Ecological valence and human color preference. New Directions in Colour Studies, pp. 361–76, 2011
2011
-
[59]
S. E. Palmer, K. B. Schloss, and J. Sammartino. Visual aesthetics and human preference. Annual Review of Psychology, 64:77–107, 2013
2013
-
[60]
J. Pitman. Combinatorial Stochastic Processes: Ecole d’Et´e de Proba- bilit´es de Saint-Flour XXXII-2002. Springer, 2006
2002
-
[61]
S. M. Pizer. Intensity mappings to linearize display devices. Computer Graphics and Image Processing, 17(3):262–268, 1981
1981
-
[62]
J. Poco, A. Mayhua, and J. Heer. Extracting and retargeting color mappings from bitmap images of visualizations. IEEE transactions on visualization and computer graphics, 24(1):637–646, 2018
2018
-
[63]
Samsel, L
F. Samsel, L. Bartram, Annie, and Bares. Art, affect and color: Creating engaging expressive scientific visualization. In VISAP: Proceedings of the IEEE VIS Arts Program, 2018
2018
-
[64]
Samsel, S
F. Samsel, S. Klaassen, and D. H. Rogers. Colormoves: Real-time inter- active colormap construction for scientific visualization. IEEE computer graphics and applications, 38(1):20–29, 2018
2018
-
[65]
Samsel, M
F. Samsel, M. Petersen, T. Geld, G. Abram, J. Wendelberger, and J. Ahrens. Colormaps that improve perception of high-resolution ocean data. In Proceedings of the 33rd Annual ACM Conference Extended Abstracts on Human Factors in Computing Systems, pp. 703–710. ACM, 2015
-
[66]
K. B. Schloss, C. C. Gramazio, A. T. Silverman, M. L. Parker, and A. S. Wang. Mapping color to meaning in colormap data visualizations. IEEE transactions on visualization and computer graphics , 25(1):810–819, 2019
2019
-
[67]
K. B. Schloss and S. E. Palmer. Aesthetic response to color combi- nations: preference, harmony, and similarity. Attention, Perception, & Psychophysics, 73(2):551–571, 2011
2011
-
[68]
Sereda, A
P. Sereda, A. Vilanova, and F. A. Gerritsen. Automating transfer function design for volume rendering using hierarchical clustering of material boundaries. In Computer Graphics Forum, pp. 243–250, 2006
2006
-
[69]
Silva, B
S. Silva, B. S. Santos, and J. Madeira. Using color in visualization: A survey. Computers & Graphics, 35(2):320–333, 2011
2011
-
[70]
K. R. Sloan Jr and C. M. Brown. Color map techniques. Computer Graphics and Image Processing, 10(4):297–317, 1979
1979
-
[71]
Smart and D
S. Smart and D. A. Szafir. Measuring the separability of shape, size, and color in scatterplots. In Proceedings of the SIGCHI Conference on Human Factors in Computing Systems. ACM, 2019
2019
-
[72]
Srivastava, E
A. Srivastava, E. Klassen, S. H. Joshi, and I. H. Jermyn. Shape analysis of elastic curves in euclidean spaces. IEEE Transactions on Pattern Analysis and Machine Intelligence, 33(7):1415–1428, 2011
2011
-
[73]
Stone, D
M. Stone, D. A. Szafir, and V . Setlur. An engineering model for color difference as a function of size. In Color and Imaging Conference, vol. 2014, pp. 253–258. Society for Imaging Science and Technology, 2014
2014
-
[74]
D. A. Szafir. Modeling color difference for visualization design. IEEE transactions on visualization and computer graphics , 24(1):392–401, 2018
2018
-
[75]
J. Tajima. Uniform color scale applications to computer graphics. Com- puter Vision, Graphics, and Image Processing, 21(3):305–325, 1983
1983
-
[76]
Tennekes and E
M. Tennekes and E. de Jonge. Tree colors: color schemes for tree- structured data. IEEE transactions on visualization and computer graphics, 20(12):2072–2081, 2014
2014
-
[77]
Tominski, G
C. Tominski, G. Fuchs, and H. Schumann. Task-driven color coding. In 2008 12th International Conference Information Visualisation, pp. 373–
2008
-
[78]
B. E. Trumbo. A theory for coloring bivariate statistical maps. The American Statistician, 35(4):220–226, 1981
1981
-
[79]
Wainer and C
H. Wainer and C. M. Francolini. An empirical inquiry concerning human understanding of two-variable color maps. The American Statistician , 34(2):81–93, 1980
1980
-
[80]
Y . Wang, F. Han, L. Zhu, O. Deussen, and B. Chen. Line graph or scatter plot? automatic selection of methods for visualizing trends in time series. IEEE transactions on visualization and computer graphics, 24(2):1141– 1154, 2018
2018
-
[81]
C. Ware. Color sequences for univariate maps: Theory, experiments and principles. IEEE Computer Graphics and Applications, 8(5):41–49, 1988
1988
-
[82]
C. Ware, T. L. Turton, F. Samsel, R. Bujack, D. H. Rogers, K. Lawonn, N. Smit, and D. Cunningham. Evaluating the perceptual uniformity of color sequences for feature discrimination. In EuroVis Workshop on Reproducibility, Verification, and Validation in Visualization (EuroRV3)....
2017
-
[83]
Wijffelaars, R
M. Wijffelaars, R. Vliegen, J. J. Van Wijk, and E.-J. Van Der Linden. Gen- erating color palettes using intuitive parameters. In Computer Graphics Forum, vol. 27, pp. 743–750. Wiley Online Library, 2008
2008
-
[84]
Wongsuphasawat, D
K. Wongsuphasawat, D. Moritz, A. Anand, J. Mackinlay, B. Howe, and J. Heer. Towards a general-purpose query language for visualization recommendation. In Proceedings of the Workshop on Human-In-the-Loop Data Analytics, p. 4. ACM, 2016
2016
-
[85]
Wongsuphasawat, D
K. Wongsuphasawat, D. Moritz, A. Anand, J. Mackinlay, B. Howe, and J. Heer. V oyager: Exploratory analysis via faceted browsing of visualiza- tion recommendations. IEEE transactions on visualization and computer graphics, 22(1):649–658, 2016
2016
-
[86]
Wongsuphasawat, Z
K. Wongsuphasawat, Z. Qu, D. Moritz, R. Chang, F. Ouk, A. Anand, J. Mackinlay, B. Howe, and J. Heer. V oyager 2: Augmenting visual analysis with partial view specifications. In Proceedings of the 2017 CHI Conference on Human Factors in Computing Systems , pp. 2648–2659. ACM, 2017
2017
-
[87]
Zeileis, J
A. Zeileis, J. C. Fisher, K. Hornik, R. Ihaka, C. D. McWhite, P. Murrell, R. Stauffer, and C. O. Wilke. colorspace: A toolbox for manipulating and assessing colors and palettes. arXiv preprint arXiv:1903.06490, 2019
1903 arXiv
-
[88]
Zeileis, K
A. Zeileis, K. Hornik, and P. Murrell. Escaping rgbland: Selecting col- ors for statistical graphics. Computational Statistics & Data Analysis , 53(9):3259–3270, 2009
2009
-
[89]
Zeyen, T
M. Zeyen, T. Post, a. A. Hans Hagen, D. Rogers, and R. Bujack. Color Interpolation for Non-Euclidean Color Spaces. In IEEE Scientific Visual- ization Conference (SciVis) Short Papers. IEEE, 2018
2018
-
[90]
Zhang and E
H. Zhang and E. Montag. Perceptual color scales for univariate and bivariate data display. The Society for Imaging Science and Technology (IS&T), 2006
2006
-
[91]
Zhang, D
Z. Zhang, D. Pati, and A. Srivastava. Bayesian clustering of shapes of curves. Journal of Statistical Planning and Inference, 166:171–186, 2015
2015
-
[92]
Zhou and C
L. Zhou and C. D. Hansen. A survey of colormaps in visualization. IEEE transactions on visualization and computer graphics, 22(8):2051–2069, 2016
2016
Reviewed August 14, 2026 · model on record in the stance chip above.
Discussion (0). Continue with ORCID to comment.