REVIEW 4 major objections 6 minor 29 references
FeatureExplorer: Interactive Feature Selection and Exploration of Regression Models for Hyperspectral Images
T0 review · 4 major / 6 minor · reviewed 2026-08-14 · deepseek-v4-flash
Pith's one-line read FeatureExplorer shows interactive expert feature selection can beat automatic selection and cut 36 hyperspectral indices to 10.
desk verdict A useful visual analytics system with a clear workflow, but the claim that human-in-the-loop selection improves prediction rests on a single uncontrolled case study with no reported numbers. read the letter →
The pith
A machine-rendered reading of the paper's core claim, the machinery that carries it, and where it could break.
The reading
What carries the argument
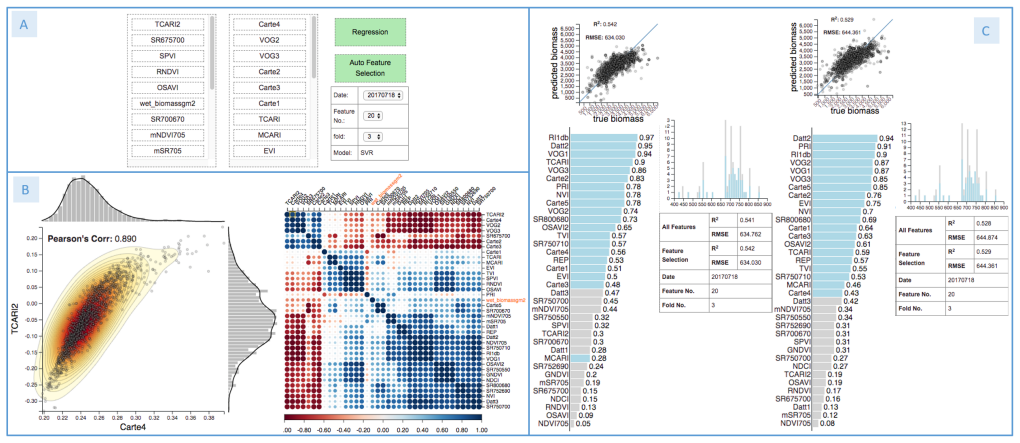
The mechanism is the closed loop among four coordinated views. A Pearson correlation matrix with hierarchical clustering groups redundant indices so an expert can diversify the subset; a KDE-augmented scatterplot exposes distributions and outliers; SVR+RFE produces a $[0,1]$ importance score for each feature by averaging normalized RFE ranks across cross-validation folds (Equation 1); and the evaluation panel shows predicted versus ground truth, $R^2$, RMSE, feature importance, and a histogram of underlying wavelengths. Drag-and-drop feature lists connect these views, allowing iterative refinement and immediate retraining.
What would settle it
Compare the same experts selecting ten features with FeatureExplorer against a non-interactive ranked list on the same images; if $R^2$ improves equally in both conditions, the claim that interactivity improves prediction is falsified. The paper would also be more directly testable if it reported the numeric $R^2$ and RMSE for the manual 10-feature versus automatic 10-feature subsets instead of only stating the manual subset performed better.
Extended reading notes
Core claim
The paper's central claim is that a visual analytics system built around jointly viewing correlation structure and model-based importance enables a domain expert to select a smaller, better-performing feature subset than automatic selection alone. In the sorghum case, the expert started from SVR+RFE ranking, used the correlation matrix to choose features from different clusters, and built a 10-index model whose performance was nearly equal to the 20-index automatic model; when directly compared at 10 features, the manual subset outperformed the automatic subset. The system also records the reflectance wavelengths underlying each selected index, letting the expert see which spectral regions matter at each growth stage. The paper concludes from this case that the human-in-the-loop improves predictive performance.
Load-bearing premise
The case study's conclusion assumes the improvement comes from the interactive system rather than from the expert's existing domain knowledge, from chance, or from the particular features he chose, because the paper reports no control condition in which the same task is done without the system.
Editorial extensions
If this is right
- A 10-index subset chosen by an expert can match the performance of a 20-index automatic subset, so the workflow can shrink the feature space without sacrificing accuracy.
- Features selected from one date partially transfer to a nearby date; the July 18 subset did not collapse on July 30 data, and revising it with new correlation information improved results.
- The system's wavelength histogram maps each selected index to its constituent reflectance bands, enabling future data collection to focus on pertinent wavelength regions at each growth stage.
- The workflow applies to other high-dimensional, correlated feature sets (multispectral or LiDAR features) and other regression targets, since the regression model is pluggable.
Reading between the lines
- My inference: the reported gain is not yet attributable to interface interactivity; a controlled experiment with and without the system is required before 'human-in-the-loop improves predictions' can be separated from expert knowledge.
- My inference: the successful heuristic of picking one feature per correlation cluster suggests a promising automated extension that recommends diverse, high-importance subsets rather than only top-ranked features.
- My inference: if wavelength tracing proves reliable across more dates and varieties, it could guide sensor design to fewer bands, but the paper does not quantify the cost savings or verify that the traced wavelengths are causally important.
Signed reviews
Editorial analysis
A structured set of objections, weighed in public.
Referee Report
Summary. The paper presents FeatureExplorer, an interactive visual analytics system for feature selection and exploration in regression models for hyperspectral images. The system combines a correlation matrix with hierarchical clustering, KDE-enhanced scatterplots, SVR+RFE feature importance ranking, and a model evaluation panel that reports R2 and RMSE for user-selected feature subsets. The authors describe design goals derived from collaborations with remote sensing experts, the system workflow and interface, and a case study in which an expert reduced 36 hyperspectral indices to 10 and achieved better performance than automatic feature selection. The paper concludes in Section 6 that the human-in-the-loop can improve predictive performance. The contributions claimed are the system itself, a comparison of several regression models, a workflow for tracing indices to underlying wavelengths, and the case study.
Significance. The manuscript addresses a genuine problem: hyperspectral data sets have many derived, correlated features, and domain experts need to identify interpretable, predictive subsets. The design of FeatureExplorer is well motivated, and the combination of automatic SVR+RFE ranking with interactive correlation and distribution views is sensible and potentially useful for remote sensing applications. The paper also provides a design process grounded in expert needs and a concrete workflow for tracing selected indices back to wavelengths, which is valuable for future data collection. However, the central claim that human-in-the-loop interaction improves predictive performance rests on a single case study with no reported numeric results, no control condition, and a potential risk of test-set leakage. The model comparison in Table 1 is also reported without variance or significance measures. These issues are load-bearing for the stated conclusions, though they are fixable with a more rigorous evaluation. If the system is meant as a practical tool, the paper would be strengthened by making the evaluation reproducible and statistically grounded.
major comments (4)
- [Section 6, final paragraph] The conclusion that "the human-in-the-loop can improve the predictive performance of the regression model" is not quantitatively supported. The case study reports only qualitative comparisons ("slightly better," "improved," "outperformed") and never gives the actual R2 or RMSE values for the manually selected 10-feature subset versus the automatic 10-feature subset. Without numeric results, the reader cannot assess the magnitude of the improvement or its stability. Please report the exact performance values, ideally with standard deviations over repeated cross-validation trials.
- [Section 5.2, evaluation panel; Section 6] The evaluation panel in Figure 2 displays the scatterplot of ground truth versus predicted values along with R2 and RMSE for the current feature subset while the user is selecting features. If these displayed metrics are computed on the same test partition that is later used for the final comparison, the expert's manual selection is effectively fitting the feature subset to the test data, and the observed improvement may be selection bias rather than a benefit of the interface. The manuscript should clarify which data partition is used for the interactive evaluation metrics and should reserve a truly held-out test set that is never shown during the interactive session.
- [Section 6, case study] The case study provides no control condition. The manual selection was performed by one expert using the system's own rankings and correlation matrix, so the comparison with automatic selection cannot separate the contribution of the interface from the expert's prior domain knowledge or from chance among the many possible 10-feature subsets. To support the central claim, the authors should add a controlled comparison, such as expert selection without the system, automatic selection with the same feature count, and ideally repeated trials with multiple experts or multiple datasets, with statistical measures of variability.
- [Section 5.3, Table 1] Table 1 reports average R2 values over 100 trials for six regression models across ten dates, but no standard deviations, confidence intervals, or significance tests are provided. Several rows contain ties (e.g., 0.20, 0.27, 0.51, 0.52), so the claim that "SVR outperforms other models" is not supported by the evidence as presented. Either add measures of variance and appropriate significance tests, or soften the claim to a descriptive statement about the observed mean values.
minor comments (6)
- [Section 2] The text says "UA Vs" for unmanned aerial vehicles; this should be "UAVs".
- [Section 5.3, Table 1 caption] The caption contains a typo: "10 datesets" should be "10 datasets".
- [Section 5.2] The paper states that R2 and RMSE are "highly correlated," which is imprecise; R2 and RMSE are functionally related for a fixed data set, but the phrase "highly correlated" suggests an empirical relationship that is not demonstrated. Consider rephrasing.
- [Section 5.2, Equation 1] The notation in Equation 1 could be clarified by explicitly noting that the ranking score maps the most important feature (rank 1) to score 1 and the least important (rank d) to score 0; this is not immediately obvious from the expression.
- [Figure 3] The subfigures in Figure 3 are referenced as Figure 3(1) through Figure 3(6), but the figure as printed does not clearly label each subimage with these numbers; please add visible subfigure labels.
- [Section 2, feature list] The paper refers to the 36 hyperspectral vegetation indices listed in reference [16], but the actual list of indices is not provided in the manuscript. Including the index names and formulas in an appendix or supplementary material would make the study more reproducible.
Circularity Check
No significant circularity: the system's importance scores are diagnostic model outputs and the case-study conclusion is an empirical observation, not a fitted target.
full rationale
FeatureExplorer does not present a derivation chain in which a predicted quantity is defined in terms of the inputs it supposedly predicts. The feature importance scores are computed from the SVR+RFE model (Equation 1 is only a normalized average of cross-validation ranks) and are diagnostic outputs, not fitted parameters renamed as predictions. The Section 6 case study reports an expert's interactive selection and compares it with automatic selection; the claim that the human-in-the-loop can improve predictive performance is an empirical observation about one session, not a result forced by construction. The only author self-citations ([9, 18, 27]) point to data collection, pre-processing, and feature extraction details; they are not load-bearing for the system's core claims and do not constitute circularity. The lack of a control condition and the absence of reported numeric R2/RMSE values are evaluation limitations, not circular reasoning. No equation equates an output to an input, no uniqueness theorem is imported from prior work, and no ansatz is smuggled in via citation.
Assumptions & free parameters
free parameters (3)
- SVR hyperparameters (C, gamma) =
Not reported (selected by grid search per fold)
- Number of features selected in the case study =
20, 3, 10
- Number of cross-validation folds =
User-adjustable, not specified in experiments
assumptions (5)
- domain assumption The 36 hyperspectral vegetation indices from [16] are a sufficient feature representation for predicting sorghum wet biomass.
- domain assumption RFE combined with SVR provides meaningful feature importance scores for non-linear relationships.
- domain assumption R2 is an adequate performance metric and is highly correlated with RMSE.
- domain assumption A single domain expert's successful session is sufficient evidence of system utility.
- domain assumption Regression models trained on hyperspectral images from one date can predict end-of-season wet biomass.
Cite this review
Pith. "Pith review of FeatureExplorer: Interactive Feature Selection and Exploration of Regression Models for Hyperspectral Images." pith.science (2026). https://pith.science/paper/VEUJAYSN
@misc{pith2026190800671,
  author       = {Pith},
  title        = {Pith review of: FeatureExplorer: Interactive Feature Selection and Exploration of Regression Models for Hyperspectral Images},
  year         = {2026},
  howpublished = {\url{https://pith.science/paper/VEUJAYSN}},
  note         = {Machine review of arXiv:1908.00671}
}
read the original abstract
Feature selection is used in machine learning to improve predictions, decrease computation time, reduce noise, and tune models based on limited sample data. In this article, we present FeatureExplorer, a visual analytics system that supports the dynamic evaluation of regression models and importance of feature subsets through the interactive selection of features in high-dimensional feature spaces typical of hyperspectral images. The interactive system allows users to iteratively refine and diagnose the model by selecting features based on their domain knowledge, interchangeable (correlated) features, feature importance, and the resulting model performance.
Figures


Reference graph
Works this paper leans on
- [1]
-
[2]
S. Barlowe, T. Zhang, Y . Liu, J. Yang, and D. Jacobs. Multivariate visual explanation for high dimensional datasets. In IEEE Symposium on Visual Analytics Science and Technology (VAST ’08), pp. 147–154, Oct 2008. doi: 10.1109/VAST.2008.4677368
arXiv 2008
-
[3]
Z. N. Brand˜ao, V . Sofiatti, J. R. Bezerra, G. B. Ferreira, J. C. Medeiros, et al. Spectral reflectance for growth and yield assessment of irrigated cotton. Australian Journal of Crop Science, 9(1):75–84, Jan 2015
work page 2015
-
[4]
G. Chandrashekar and F. Sahin. A survey on feature selection methods. Computers & Electrical Engineering, 40(1):16–28, Jan 2014. doi: 10. 1016/j.compeleceng.2013.11.024
work page 2014
-
[5]
S. Das, D. Cashman, R. Chang, and A. Endert. BEAMES: Interactive multi-model steering, selection, and inspection for regression tasks
-
[6]
J. Ding, J. Shi, and F.-X. Wu. SVM-RFE based feature selection for tandem mass spectrum quality assessment. International Journal of Data Mining and Bioinformatics , 5(1):73–88, Feb 2011. doi: 10. 1504/IJDMB.2011.038578
work page Pith review arXiv 2011
-
[7]
D. Dingen, M. van’t Veer, P. Houthuizen, E. H. J. Mestrom, E. H. H. M. Korsten, A. R. A. Bouwman, and J. van Wijk. RegressionExplorer: Interactive exploration of logistic regression models with subgroup analysis. IEEE Transactions on Visualization and Computer Graphics, 25(1):246–255, Jan 2019. doi: 10.1109/TVCG.2018.2865043
arXiv 2019
- [8]
Show all 29 references
-
[9]
Elbahnasawy, T
M. Elbahnasawy, T. Shamseldin, R. Ravi, T. Zhou, Y .-J. Lin, A. Mas- jedi, E. Flatt, M. Crawford, and A. Habib. Multi-sensor integration onboard a UA V-based mobile mapping system for agricultural man- agement. In IEEE International Geoscience and Remote Sensing Sym- posium (I...
2018
-
[10]
Elmqvist, P
N. Elmqvist, P. Dragicevic, and J.-D. Fekete. Rolling the dice: Multidi- mensional visual exploration using scatterplot matrix navigation. IEEE Transactions on Visualization and Computer Graphics, 14(6):1539– 1148, Nov 2008. doi: 10.1109/TVCG.2008.153
2008 doi
-
[11]
Friendly
M. Friendly. Corrgrams: Exploratory displays for correlatigon ma- trices. American Statistician , 56(4):316–324, 2002. doi: 10.1198/ 000313002533
2002
-
[12]
Gerik, B
T. Gerik, B. Bean, and R. Vanderlip. Sorghum growth and development. Texas AgriLife Extension publication, 2003
2003
-
[13]
Z. Guo, M. O. Ward, and E. A. Rundensteiner. Model space visual- ization for multivariate linear trend discovery. In IEEE Symposium on Visual Analytics Science and Technology (VAST ’09), pp. 75–82, Oct
-
[14]
Johansson and J
S. Johansson and J. Johansson. Interactive dimensionality reduction through user-defined combinations of quality metrics. IEEE Transac- tions on Visualization and Computer Graphics, 15(6):993–1000, Nov
-
[15]
Krause, A
J. Krause, A. Perer, and E. Bertini. INFUSE: Interactive feature selec- tion for predictive modeling of high dimensional data. IEEE Trans- actions on Visualization and Computer Graphics, 20(12):1614–1623, Dec 2014. doi: 10.1109/TVCG.2014.2346482
2014
-
[16]
doi: 10.1109/TVCG.2009.153
2009 doi
-
[17]
Q. Liu, C. Chen, Y . Zhang, and Z. Hu. Feature selection for sup- port vector machines with RBF kernel. Artificial Intelligence Review, 36(2):99–115, Aug 2011. doi: 10.1007/s10462-011-9205-2
2011 doi
-
[18]
Liang, L
L. Liang, L. Di, L. Zhang, M. Deng, Z. Qin, S. Zhao, and H. Lin. Estimation of crop LAI using hyperspectral vegetation indices and a hybrid inversion method. Remote Sensing of Environment, 165:123– 134, 2015. doi: 10.1016/j.rse.2015.04.032
2015 doi
-
[19]
T. May, A. Bannach, J. Davey, T. Ruppert, and J. Kohlhammer. Guiding feature subset selection with an interactive visualization. In IEEE Conference on Visual Analytics Science and Technology (VAST ’11), pp. 111–120, Oct 2011. doi: 10.1109/VAST.2011.6102448
2011
-
[20]
Masjedi, J
A. Masjedi, J. Zhao, A. M. Thompson, K.-W. Yang, J. E. Flatt, M. M. Crawford, D. S. Ebert, M. R. Tuinstra, G. Hammer, and S. Chapman. Sorghum biomass prediction using UA V-based remote sensing data and crop model simulation. In IEEE International Geoscience and Remote Sensing ...
2018
-
[21]
Piringer, W
H. Piringer, W. Berger, and H. Hauser. Quantifying and comparing features in high-dimensional datasets. In 12th International Conference Information Visualisation (InfoVis ’08), pp. 240–245, July 2008. doi: 10.1109/IV.2008.17
2008 doi
-
[22]
Muhlbacher and H
T. Muhlbacher and H. Piringer. A partition-based framework for build- ing and validating regression models. IEEE Transactions on Visualiza- tion and Computer Graphics, 19(12):1962–1971, Dec 2013. doi: 10. 1109/TVCG.2013.125
1962
-
[23]
Sch¨olkopf and A
B. Sch¨olkopf and A. J. Smola. Learning with Kernels: Support Vector Machines, Regularization, Optimization, and Beyond . MIT press, Cambridge, MA, USA, 2002
2002
-
[24]
Piringer, W
H. Piringer, W. Berger, and J. Krasser. HyperMoVal: Interactive visual validation of regression models for real-time simulation. Computer Graphics Forum, 29(3):983–992, Aug 2010. doi: 10.1111/j.1467-8659. 2009.01684.x
2010 arXiv
-
[25]
Turkay, P
C. Turkay, P. Filzmoser, and H. Hauser. Brushing dimensions - A dual visual analysis model for high-dimensional data. IEEE Transactions on Visualization and Computer Graphics, 17(12):2591–2599, Dec 2011. doi: 10.1109/TVCG.2011.178
2011 doi
-
[26]
Seo and B
J. Seo and B. Shneiderman. A rank-by-feature framework for unsu- pervised multidimensional data exploration using low dimensional projections. In IEEE Symposium on Information Visualization (InfoVis ’04), pp. 65–72, Oct 2004. doi: 10.1109/INFVIS.2004.3
2004 doi
-
[27]
Zhang, A
Z. Zhang, A. Masjedi, J. Zhao, and M. M. Crawford. Prediction of sorghum biomass based on image based features derived from time series of UA V images. InIEEE International Geoscience and Remote Sensing Symposium (IGARSS ’17), pp. 6154–6157, July 2017. doi: 10. 1109/IGARSS.201...
2017
-
[28]
J. Yang, W. Peng, M. O. Ward, and E. A. Rundensteiner. Interactive hierarchical dimension ordering, spacing and filtering for exploration of high dimensional datasets. In IEEE Symposium on Information Visualization (InfoVis ’03), pp. 105–112, Oct 2003. doi: 10.1109/INFVIS. 2003.1249015
2003 arXiv
-
[2009]
doi: 10.1109/VAST.2009.5333431
2009
Reviewed August 14, 2026 · model on record in the stance chip above.
Discussion (0). Continue with ORCID to comment.