REVIEW 3 major objections 5 minor 1 cited by
Designing for Mobile and Immersive Visual Analytics in the Field
T0 review · 3 major / 5 minor · reviewed 2026-08-14 · deepseek-v4-flash
Pith's one-line read The paper argues that pairing mobile overviews with augmented-reality detail views lets field analysts validate and act on data in real time, closing the spatial and temporal gaps that separate fieldwork from analysis.
desk verdict A worthwhile formative design study that maps a design space for field visual analytics, but its recommendations are partly scaffolded by the authors' own prototype and have not been field-validated. read the letter →
The pith
A machine-rendered reading of the paper's core claim, the machinery that carries it, and where it could break.
The reading
What carries the argument
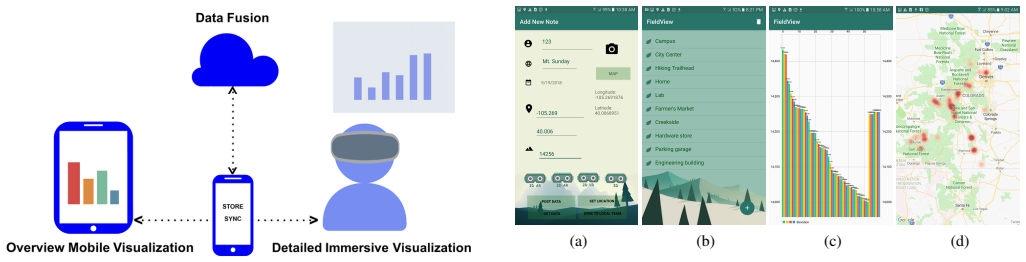
The load-bearing mechanism is the design probe: a working system that couples an Android data-collection app, a cloud datastore with two-phase offline caching, and immersive AR visualizations on a portable headset and phone camera, organized around an overview-plus-detail paradigm. The probe itself is the instrument of the study: it gives interview participants a concrete instantiation of the proposed workflow so they can react to capabilities rather than abstractions, and the four design considerations R1–R4 are the distilled constraints it was built to embody. The follow-on FieldView prototype extends this machinery with a lightweight local server and gridded, situated AR visualizations to demonstrate the three use cases.
What would settle it
One decisive check would be a field deployment in which teams collect and analyze data during a real operation, randomly assigned to either the proposed mobile-plus-AR system or their usual workflow; if teams using the system do not catch more data errors or make faster, better-informed decisions, the central claim fails. Alternatively, an interview study that asked about needs before any demonstration and compared the answers to those gathered after the probe would reveal whether the recommendations were created by the probe rather than discovered from analysts.
Extended reading notes
Core claim
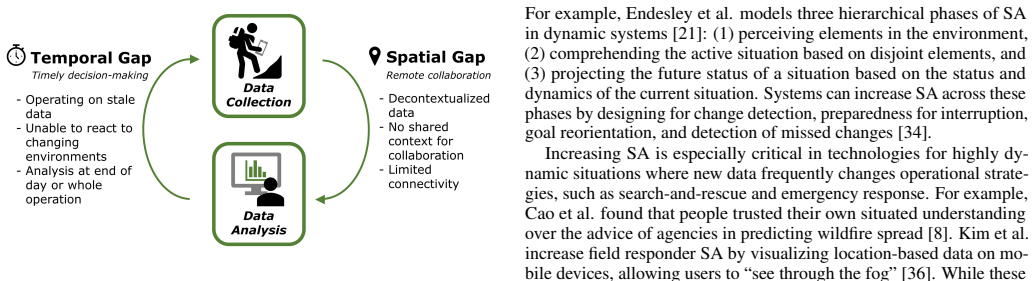
The paper's central claim is that visual analytics can be brought into the field by splitting the work across devices: mobile visualizations supply rapid overviews of an entire operation, while situated AR visualizations supply detail embedded in the physical environment the data describes. The authors argue that this combination resolves the two failure modes they identify in current fieldwork: spatial gaps, where remote analysts lack the physical context of data, and temporal gaps, where analysts cannot react to new data until after returning from the field. Interviews with ten experts led to four design recommendations for field analytics systems (R1–R4) and three target use cases, which FieldView demonstrates as a proof of concept. The paper presents this as preliminary, formative evidence that integrated mobile-plus-immersive analytics can increase situational awareness and improve data quality in field operations.
Load-bearing premise
The load-bearing premise is that the ten experts' replies reflect their real field needs rather than agreement with the interactive demonstration system, which was built from the authors' assumptions and never deployed in real field operations.
Editorial extensions
If this is right
- Field analytics systems should be built as paired mobile overviews and AR details rather than as single-device solutions.
- Offline and distributed collection needs a two-phase cache so teams can share data without connectivity.
- Data quality validation becomes a primary field task: embedded visualizations can flag missing or anomalous data while analysts are still on site.
- Archival data and autonomous sensor streams should be fused into the same situated views, with source separation preserved.
- Designers should expect field analysts to reject complex dashboards and prefer simple, at-a-glance representations.
Reading between the lines
- Editorial inference: the same mobile-overview/AR-detail split could be tested in controlled experiments measuring decision speed and error detection; the paper's evidence is qualitative, not comparative.
- Editorial inference: the four design considerations likely extend to other field domains such as archaeology, construction inspection, or disaster assessment, but the paper only samples five domains.
- Editorial inference: a natural next deployment would run FieldView or a successor system through a full season of real operations, comparing data-quality incident rates against the current notebook-and-post-hoc workflow.
- Editorial inference: if taken up, the approach would shift procurement priorities in public safety and earth science toward lightweight portable servers and AR-capable headsets, and would require solving glove-compatible input, which the paper explicitly leaves open.
Signed reviews
Editorial analysis
A structured set of objections, weighed in public.
Referee Report
Summary. The paper reports a formative design study for mobile and immersive visual analytics in field settings. The authors first conducted preliminary unstructured interviews with four field analysts, from which they derive four design considerations (R1–R4: offline/distributed collection, merging environmental context with analysis, mitigating information overload, and outdoor use). They then built a design probe coupling a mobile data-collection app, a cloud datastore, and AR visualizations, and used this probe to scaffold semi-structured interviews with ten experts from five domains. From the interviews they synthesize design recommendations and key tasks organized around location-based data, teaming under limited connectivity, data quality validation, and data fusion across perspectives. These findings are embodied in FieldView, an open-source prototype with three use cases: team coordination, data quality validation, and autonomous sensor fusion. The paper explicitly frames the contribution as preliminary design considerations and a proof-of-concept, and it acknowledges that FieldView was not deployed in the field.
Significance. If the qualitative synthesis is trustworthy, the paper provides useful early-stage guidance for an underexplored design space. The multi-domain expert sample, the concrete design probe, and the open-source FieldView prototype are substantive artifacts, and the four design considerations are plausible and actionable. The paper is also appropriately honest about the lack of field evaluation and about hardware limitations. The formal circularity concern raised in the stress-test note does not apply: there are no fitted parameters or predictive claims, and the self-citation in §6.2 is a routine reference to prior empirical work. The main risk is methodological rather than formal: the interview data are scaffolded by a probe that embodies the authors' own design assumptions, and the thematic analysis is reported in too little detail for the central design recommendations to be independently assessed. These issues are fixable with additional reporting and softened framing, so the contribution can be made sound within the scope of a revision.
major comments (3)
- [§5, Qualitative Study] The thematic analysis is under-specified. The text says only that transcripts were analyzed using thematic analysis, with no description of the coding procedure, the number of coders, the codebook, or how saturation was judged. Because the four design considerations and the design recommendations in §5 are the paper's central contribution, the reader cannot assess whether the themes are robust or whether they were selected to fit the authors' prior expectations. The authors should report the coding process in detail, provide the codebook and any coding artifacts in the supplemental materials, and state how disagreements or disconfirming evidence were handled.
- [§4–§5, design probe and interview procedure] The interview responses may be anchored by the design probe. The probe was built directly from R1–R4 and was demonstrated interactively to participants before the interview questions were asked, so positive responses to the probe cannot fully distinguish independently expressed field needs from agreement with a concrete artifact. This is a load-bearing concern because the paper claims the design considerations reflect field requirements. The authors should explicitly triangulate the probe-based interview findings with the preliminary interviews from §3, report instances where participants critiqued or disagreed with the probe, and clearly frame R1–R4 as provisional hypotheses to be tested in future deployments rather than as validated field requirements.
- [§6–§7, FieldView use cases] The three FieldView use cases are illustrative instantiations, not empirical evidence of task support. The paper states that the geocoordinates were retargeted to a local site and that synthetic data were used, and §7 concedes that FieldView could not be evaluated in the wild due to scientists' reluctance and legal restrictions. Statements in §6 such as "This use case addresses data quality assessment tasks" and "Analysts can validate field data" should be carefully qualified so that they describe demonstrated capabilities of the prototype rather than validated outcomes in the target environment. The current wording overstates what the demonstrations can establish, and a more explicit separation between design rationale and evaluation would strengthen the paper.
minor comments (5)
- [§1] The word "complimentary" is used twice where "complementary" is intended; the two words have different meanings and the typo is distracting in the introduction and contributions list.
- [§2.1] The text reads "Endesley et al." but the cited reference [21] is by Endsley; the author name should be corrected to "Endsley".
- [§2.3] The in-text citation "Schmalsteig & H¨ollerer" does not match the reference [55], which is "Schmalstieg and Hollerer"; the spelling should be made consistent.
- [§5.1 and §5.2] There are typographical errors: "stratefied samples" should be "stratified samples" in §5.1, and "partipants" should be "participants" in §5.2.
- [§5.2] The sentence beginning "None had solutions for sharing and collaboratively analyzing updated field data across teams in real time" is grammatically awkward; consider rephrasing to "None had solutions for sharing updated field data across teams in real time or for collaboratively analyzing such data."
Circularity Check
Design recommendations are partly probe-elicited: the probe was built from the authors' R1–R4 requirements and demonstrated before the interviews that yielded the final recommendations.
-
other
[§3–§5 (Preliminary Requirements Analysis → Design Probe Implementation → Qualitative Study)]
"Our design probe embodies these design considerations to elicit insight into how visual analytics can enhance field practices. ... Our implementation supports the requirements enumerated in initial interviews (§3) as follows: R1–Offline & Distributed Data Collection ... R2–Merge Environmental Context & Analysis ... R3–Mitigate Information Overload ... R4–Use in Outdoor Environments."
The final design recommendations in §5 are the output of interviews scaffolded by a probe the authors built from their own preliminary R1–R4 requirements. The probe was demonstrated to all ten participants before questions were asked, so affirmative responses and ensuing themes cannot independently confirm the design space; the recommendations partly re-import the probe's own design commitments. The paper itself states the probe was built 'to elicit insight,' not as a controlled needs-elicitation instrument, and §7 admits FieldView was not evaluated in the wild. This is a methodological circularity rather than an equation-level reduction: the target 'findings' are shaped by the artifact used to collect them.
full rationale
This is a qualitative design-study paper with no equations, fitted parameters, or uniqueness theorems, so no formal derivation can be circular in the narrow sense. The central claim is a formative design-space characterization based on ten expert interviews and thematic analysis. The most important caveat is that the interview probe was constructed from the authors' preliminary requirements and demonstrated to participants before questions, so the final recommendations are partly a reflection of the probe rather than an independent field validation; the authors acknowledge FieldView was never deployed in the wild (§7). This is a validity limitation rather than a forced by-construction result. The only self-citation, [57] for blue missing-data highlighting, is a minor design choice and not load-bearing. Because the final themes contain independent interview-derived content (e.g., data-quality validation, drone fusion, portable local servers), the circularity is minor; score 2.
Assumptions & free parameters
assumptions (4)
- domain assumption The interviewed experts' self-reported needs are representative of field analysts across the target domains.
- domain assumption Participant responses to the design probe reflect genuine field needs rather than demand effects from the demonstration.
- domain assumption Thematic analysis of the interviews was consistent and free of confirmation bias.
- domain assumption Situated AR visualization can increase contextual awareness without imposing excessive cognitive load in the field.
Cite this review
Pith. "Pith review of Designing for Mobile and Immersive Visual Analytics in the Field." pith.science (2026). https://pith.science/paper/P4X3AAHC
@misc{pith2026190800680,
  author       = {Pith},
  title        = {Pith review of: Designing for Mobile and Immersive Visual Analytics in the Field},
  year         = {2026},
  howpublished = {\url{https://pith.science/paper/P4X3AAHC}},
  note         = {Machine review of arXiv:1908.00680}
}
read the original abstract
Data collection and analysis in the field is critical for operations in domains such as environmental science and public safety. However, field workers currently face data- and platform-oriented issues in efficient data collection and analysis in the field, such as limited connectivity, screen space, and attentional resources. In this paper, we explore how visual analytics tools might transform field practices by more deeply integrating data into these operations. We use a design probe coupling mobile, cloud and immersive analytics components to guide interviews with ten experts from five domains to explore how visual analytics could support data collection and analysis needs in the field. The results identify shortcomings of current approaches and target scenarios and design considerations for future field analysis systems. We embody these findings in FieldView, an extensible, open-source prototype designed to support critical use cases for situated field analysis. Our findings suggest the potential for integrating mobile and immersive technologies to enhance data's utility for various field operations and new directions for visual analytics tools to transform fieldwork.
Figures

Figures from the paper (4 more)



Forward citations
Cited by 1 Pith paper
-
Augmented Reality User Interfaces for First Responders: A Scoping Literature Review
A scoping review of 90 papers proposes a six-facet taxonomy and identifies 12 interface elements for AR user interfaces used by first responders.
Reference graph
Works this paper leans on
-
[1]
B. Bach, R. Sicat, J. Beyer, M. Cordeil, and H. Pfister. The hologram in my hand: How effective is interactive exploration of 3d visualizations in im- mersive tangible augmented reality? IEEE Transactions on Visualization and Computer Graphics, 24(1):457–467, 2018
work page 2018
-
[2]
S. K. Badam and N. Elmqvist. Visfer: Camera-based visual data transfer for cross-device visualization. Information Visualization, p. 1473871617725907, 2017
work page 2017
-
[3]
B. Bell, T. H¨ollerer, and S. Feiner. An annotated situation-awareness aid for augmented reality. In Proceedings of the 15th Annual ACM symposium on User Interface Software and Technology, pp. 213–216. ACM, 2002
work page 2002
-
[4]
F. Bork, C. Schnelzer, U. Eck, and N. Navab. Towards efficient visual guid- ance in limited field-of-view head-mounted displays. IEEE Transactions on Visualization and Computer Graphics, 24(11):2983–2992, 2018
work page 2018
-
[5]
M. Brehmer, B. Lee, P. Isenberg, and E. K. Choe. Visualizing ranges over time on mobile phones: a task-based crowdsourced evaluation. IEEE Transactions on Visualization and Computer Graphics, 25(1):619–629, 2019
work page 2019
-
[6]
S. Burigat and L. Chittaro. Location-aware visualization of vrml models in gps-based mobile guides. In Proceedings of the Tenth International Conference on 3D Web Technology, pp. 57–64. ACM, 2005
work page 2005
-
[7]
S. Burigat and L. Chittaro. Geographical data visualization on mobile devices for users navigation and decision support activites. InSpatial Data on the Web, pp. 261–284. Springer, 2007
work page 2007
-
[8]
Y . Cao, B. J. Boruff, and I. M. McNeill. The smoke is rising but where is the fire? exploring effective online map design for wildfire warnings. Natural Hazards, 88(3):1473–1501, 2017
work page 2017
Show all 61 references
-
[9]
E. Chan, C. Anslow, T. Seyed, and F. Maurer.Envisioning the Emergency Operations Centre of the Future , pp. 349–372. Springer International Publishing, Cham, 2016. doi: 10.1007/978-3-319-45853-3 15
2016 doi
-
[10]
Z. Chen, Y . Su, Y . Wang, Q. Wang, H. Qu, and Y . Wu. Marvist: Authoring glyph-based visualization in mobile augmented reality. IEEE Transactions on Visualization and Computer Graphics, 2019
2019
-
[11]
Chittaro
L. Chittaro. Visualizing information on mobile devices. Computer, 39(3):40–45, 2006
2006
-
[12]
E. K. Choe, B. Lee, M. Kay, W. Pratt, and J. A. Kientz. Sleeptight: low-burden, self-monitoring technology for capturing and reflecting on sleep behaviors. In Proceedings of the 2015 ACM International Joint Conference on Pervasive and Ubiquitous Computing, pp. 121–132. ACM, 2015
2015
-
[13]
ˇCopiˇc Pucihar, M
K. ˇCopiˇc Pucihar, M. Kljun, and P. Coulton. Playing with the artworks: engaging with art through an augmented reality game. In Proceedings of the 2016 CHI Conference Extended Abstracts on Human Factors in Computing Systems, pp. 1842–1848. ACM, 2016
2016
-
[14]
S. L. Cutter. Gi science, disasters, and emergency management. Transac- tions in GIS, 7(4):439–446, 2003
2003
-
[15]
Dancu, M
A. Dancu, M. Fourgeaud, M. Obaid, M. Fjeld, and N. Elmqvist. Map navigation using a wearable mid-air display. In Proceedings of the 17th International Conference on Human-Computer Interaction with Mobile Devices and Services, pp. 71–76. ACM, 2015
2015
-
[16]
J. D. Dingell Jr. Conservation, management, and recreation act. 116th U.S. Congress, S.47, 2019
2019
-
[17]
D. B. Douglas, C. A. Wilke, J. D. Gibson, J. M. Boone, and M. Winter- mark. Augmented reality: Advances in diagnostic imaging. Multimodal Technologies and Interaction, 1(4):29, 2017
2017
-
[18]
M. V . D. Eeckhaut, J. Poesen, G. Verstraeten, V . Vanacker, J. Nyssen, J. Moeyersons, L. v. Beek, and L. Vandekerckhove. Use of lidar-derived images for mapping old landslides under forest. Earth Surface Processes and Landforms, 32(5):754–769, 2007
2007
-
[19]
Ellis and A
G. Ellis and A. Dix. A taxonomy of clutter reduction for information visualisation. IEEE Transactions on Visualization and Computer Graphics, 13(6):1216–1223, 2007
2007
-
[20]
Elmqvist and P
N. Elmqvist and P. Irani. Ubiquitous analytics: Interacting with big data anywhere, anytime. Computer, 46(4):86–89, 2013
2013
-
[21]
M. R. Endsley. Toward a theory of situation awareness in dynamic systems. Human Factors, 37(1):32–64, 1995
1995
-
[22]
Flentge, S
F. Flentge, S. G. Weber, A. Behring, and T. Ziegert. Designing context- aware hci for collaborative emergency management. In Intl Workshop on HCI for Emergencies in conjunction with CHI, vol. 8, p. 2008, 2008
2008
-
[23]
L. A. Fletcher, D. J. Erickson, T. L. Toomey, and A. C. Wagenaar. Hand- held computers: A feasible alternative to paper forms for field data collec- tion. Evaluation Review, 27(2):165–178, 2003
2003
-
[24]
R. K. Ganti, F. Ye, and H. Lei. Mobile crowdsensing: current state and future challenges. IEEE Communications Magazine, 49(11), 2011
2011
-
[25]
N. F. Gazc´on, J. M. T. Nagel, J. I. Larregui, M. L. Ganuza, E. A. Bjerg, and S. M. Castro. Immersive analytics for geology: Field sketch-like visualization to assist geological structure analysis during fieldwork. 2017
2017
-
[26]
Goubran, A
L. Goubran, A. Parush, and A. Whitehead. Modelling information flow and situational awareness in wild fire response operations. In International Conference on Human Interface and the Management of Information, pp. 11–19. Springer, 2016
2016
-
[27]
Gustafson, P
S. Gustafson, P. Baudisch, C. Gutwin, and P. Irani. Wedge: clutter- free visualization of off-screen locations. In Proceedings of the SIGCHI Conference on Human Factors in Computing Systems, pp. 787–796. ACM, 2008
2008
-
[28]
Hoang, M
T. Hoang, M. Reinoso, Z. Joukhadar, F. Vetere, and D. Kelly. Augmented studio: Projection mapping on moving body for physiotherapy educa- tion. In Proceedings of the 2017 CHI Conference on Human Factors in Computing Systems, pp. 1419–1430. ACM, 2017
2017
-
[29]
Horak, S
T. Horak, S. K. Badam, N. Elmqvist, and R. Dachselt. When david meets goliath: Combining smartwatches with a large vertical display for visual data exploration. In Proceedings of the 2018 CHI Conference on Human Factors in Computing Systems, p. 19. ACM, 2018
2018
-
[30]
Irizarry, M
J. Irizarry, M. Gheisari, G. Williams, and B. N. Walker. Infospot: A mobile augmented reality method for accessing building information through a situation awareness approach. Automation in Construction , 33:11–23, 2013
2013
-
[31]
M. Jahn, M. Jentsch, C. R. Prause, F. Pramudianto, A. Al-Akkad, and R. Reiners. The energy aware smart home. In 2010 5th International Conference on Future Information Technology, pp. 1–8, May 2010. doi: 10.1109/FUTURETECH.2010.5482712
2010
-
[32]
Jiang, N
X. Jiang, N. Y . Chen, J. I. Hong, K. Wang, L. Takayama, and J. A. Lan- day. Siren: Context-aware computing for firefighting. In International Conference on Pervasive Computing, pp. 87–105. Springer, 2004
2004
-
[33]
J. Jo, S. L’Yi, B. Lee, and J. Seo. Touchpivot: blending wimp & post- wimp interfaces for data exploration on tablet devices. In Proceedings of the 2017 CHI Conference on Human Factors in Computing Systems, pp. 2660–2671. ACM, 2017
2017
-
[34]
M. S. John and H. S. Smallman. Staying up to speed: Four design principles for maintaining and recovering situation awareness. Journal of Cognitive Engineering and Decision Making, 2(2):118–139, 2008
2008
-
[35]
Karstens, R
B. Karstens, R. Rosenbaum, and H. Schumann. Presenting large and complex information sets on mobile handhelds. E-commerce and M- commerce Technologies, pp. 32–56, 2005
2005
-
[36]
S. Kim, R. Maciejewski, K. Ostmo, E. J. Delp, T. F. Collins, and D. S. Ebert. Mobile analytics for emergency response and training. Information Visualization, 7(1):77–88, 2008
2008
-
[37]
Kulyk, G
O. Kulyk, G. van der Veer, and B. van Dijk. Situational awareness support to enhance teamwork in collaborative environments. In Proceedings of the 15th European Conference on Cognitive Ergonomics: the Ergonomics of Cool Interaction, p. 5. ACM, 2008
2008
-
[38]
Lamble, T
D. Lamble, T. Kauranen, M. Laakso, and H. Summala. Cognitive load and detection thresholds in car following situations: safety implications for using mobile (cellular) telephones while driving. Accident Analysis & Prevention, 31(6):617–623, 1999
1999
-
[39]
N. D. Lane, E. Miluzzo, H. Lu, D. Peebles, T. Choudhury, and A. T. Campbell. A survey of mobile phone sensing. IEEE Communications Magazine, 48(9), 2010
2010
-
[40]
Langner, T
R. Langner, T. Horak, and R. Dachselt. Vis tiles: Coordinating and combining co-located mobile devices for visual data exploration. IEEE Transactions on Visualization and Computer Graphics, 24(1):626–636, 2018
2018
-
[41]
Lukosch, H
S. Lukosch, H. Lukosch, D. Datcu, and M. Cidota. Providing informa- tion on the spot: Using augmented reality for situational awareness in the security domain. Computer Supported Cooperative Work (CSCW), 24(6):613–664, 2015
2015
-
[42]
Marriott, J
K. Marriott, J. Chen, M. Hlawatsch, T. Itoh, M. A. Nacenta, G. Reina, and W. Stuerzlinger. Immersive analytics: Time to reconsider the value of 3d for information visualisation. In Immersive Analytics, pp. 25–55. Springer, 2018
2018
-
[43]
Marriott, F
K. Marriott, F. Schreiber, T. Dwyer, K. Klein, N. H. Riche, T. Itoh, W. Stuerzlinger, and B. H. Thomas. Immersive Analytics, vol. 11190. Springer, 2018
2018
-
[44]
McCaffrey, R
K. McCaffrey, R. Jones, R. Holdsworth, R. Wilson, P. Clegg, J. Imber, N. Holliman, and I. Trinks. Unlocking the spatial dimension: digital tech- nologies and the future of geoscience fieldwork. Journal of the Geological Society, 162(6):927–938, 2005
2005
-
[45]
M. Melo, M. Bessa, K. Debattista, and A. Chalmers. Hdr video on small screen devices. In High Dynamic Range Video, pp. 173–188. Elsevier, 2017
2017
-
[46]
Palen and K
L. Palen and K. M. Anderson. Crisis informaticsnew data for extraordinary times. Science, 353(6296):224–225, 2016
2016
-
[47]
T. S. Parikh, P. Javid, S. K., K. Ghosh, and K. Toyama. Mobile phones and paper documents: Evaluating a new approach for capturing microfinance data in rural india. In Proceedings of the SIGCHI Conference on Human Factors in Computing Systems, CHI ’06, pp. 551–560. ACM, New Yor...
2006
-
[48]
Pascoe, N
J. Pascoe, N. Ryan, and D. Morse. Using while moving: Hci issues in field- work environments. ACM Transactions on Computer-Human Interaction (TOCHI), 7(3):417–437, 2000
2000
-
[49]
T. L. Pavlis, R. Langford, J. Hurtado, and L. Serpa. Computer-based data acquisition and visualization systems in field geology: Results from 12 years of experimentation and future potential. Geosphere, 6(3):275–294, 2010
2010
-
[50]
Rakkolainen and T
I. Rakkolainen and T. Vainio. A 3d city info for mobile users. Computers & Graphics, 25(4):619–625, 2001
2001
-
[51]
P. R. Ramakrishnaraja and S. Mehrotra. Don’t be caught unaware! en- hancing situational awareness in oil & gas industry through augmented reality. 2017
2017
-
[52]
Reades, F
J. Reades, F. Calabrese, A. Sevtsuk, and C. Ratti. Cellular census: Ex- plorations in urban data collection. IEEE Pervasive computing , 6(3), 2007
2007
-
[53]
N. Ryan, J. Pascoe, and D. Morse. Enhanced reality fieldwork: the context aware archaeological assistant. Bar International Series, 750:269–274, 1999
1999
-
[54]
M. E. C. Santos, A. i. W. L ¨ubke, T. Taketomi, G. Yamamoto, M. M. T. Rodrigo, C. Sandor, and H. Kato. Augmented reality as multimedia: the case for situated vocabulary learning.Research and Practice in Technology Enhanced Learning, 11(1):4, Jan 2016. doi: 10.1186/s41039-016-0028-2
2016 doi
-
[55]
Schmalstieg and T
D. Schmalstieg and T. Hollerer.Augmented reality: principles and practice. Addison-Wesley Professional, 2016
2016
-
[56]
Siu and V
T. Siu and V . Herskovic. Sidebars: improving awareness of off-screen elements in mobile augmented reality. In Proceedings of the 2013 Chilean Conference on Human-Computer Interaction, pp. 36–41. ACM, 2013
2013
-
[57]
Song and D
H. Song and D. A. Szafir. Where’s my data? evaluating visualizations with missing data. IEEE Transactions on Visualization and Computer Graphics, 25(1):914–924, Jan 2019. doi: 10.1109/TVCG.2018.2864914
2019
-
[58]
Tomlinson, W
M. Tomlinson, W. Solomon, Y . Singh, T. Doherty, M. Chopra, P. Ijumba, A. C. Tsai, and D. Jackson. The use of mobile phones as a data collection tool: a report from a household survey in south africa. BMC Medical Informatics and Decision Making, 9(1):51, 2009
2009
-
[59]
Truong, L
H.-L. Truong, L. Juszczyk, A. Manzoor, and S. Dustdar. Escape–an adaptive framework for managing and providing context information in emergency situations. In European Conference on Smart Sensing and Context, pp. 207–222. Springer, 2007
2007
-
[60]
Wiehr, V
F. Wiehr, V . Setlur, and A. Joshi. Drivesense: Contextual handling of large-scale route map data for the automobile. In 2013 IEEE International Conference on Big Data, pp. 87–94. IEEE, 2013
2013
-
[61]
Willett, Y
W. Willett, Y . Jansen, and P. Dragicevic. Embedded data representations. IEEE Transactions on Visualization and Computer Graphics, 23(1):461– 470, 2017
2017
Reviewed August 14, 2026 · model on record in the stance chip above.
Discussion (0). Continue with ORCID to comment.