REVIEW 3 major objections 5 minor 36 references
Comparing sleep studies in terms of the Apnea-Hypopnea Index using dedicated Shiny web application
T0 review · 3 major / 5 minor · reviewed 2026-08-14 · deepseek-v4-flash
Pith's one-line read Correlation alone is insufficient to validate AHI-measuring devices; the paper's eMAE metric weights errors near clinical thresholds.
desk verdict A useful methods-and-software paper for sleep-device validation, but the new eMAE metric's weights are arbitrary and the headline comparison is an artifact of that choice. read the letter →
The pith
A machine-rendered reading of the paper's core claim, the machinery that carries it, and where it could break.
The reading
What carries the argument
The load-bearing object is the ranking function $B$ used inside the extended mean absolute error, $\mathrm{eMAE} = \frac{1}{n}\sum_{i=1}^{n} A(e_i)\, B(\mathrm{ref}_i)\, |\mathrm{res}_i - \mathrm{ref}_i|$. $B$ is built from the clinical thresholds of the AHI severity scale: it assigns weight 1.5 at each threshold ('hotspot', e.g., 5, 15, 30 for adults), weight 0.5 at the midpoint of each subrange, and weight 0.5 at twice the highest threshold, then interpolates between these points with a cubic, sinusoidal, or linear curve, with cubic as the default and the most restrictive. The companion factor $A$ is 0.5 when both measurements fall in the same severity subrange and 1.0 otherwise. The mechanism does the work of the paper's argument: it makes the error metric penalize boundary-crossing errors more heavily and within-subrange differences less heavily, so the eMAE's ranking of devices is intended to track clinical mismanagement rather than raw numerical distance.
What would settle it
A decisive test would use paired device-and-reference AHI data together with the actual clinical decisions those values produced (e.g., CPAP prescribed or not, treatment escalation). Compute both MAE and eMAE for each candidate device, then compare which metric better ranks devices by the observed rate of clinically harmful disagreement (a decision that would change if the reference value were used). If eMAE does not outperform plain MAE in predicting or ranking mismanagement, or if the arbitrary 1.5/0.5 weights can be varied without changing device rankings, the claim that eMAE captures clinical significance would fail.
Extended reading notes
Core claim
The paper's central claim is that correlation alone is not sufficient to establish that a device measures AHI reliably; agreement should be judged both statistically and clinically. It defines clinical significance through the established severity subranges (normal/mild/moderate/severe; thresholds 5, 15, 30 for adults, and 1, 5, 10 for children), so two values that fall in the same subrange are clinically concordant even if numerically far apart. To give raw-error metrics clinical meaning, it introduces the eMAE, in which each absolute difference is weighted by $B(\mathrm{ref}_i)$, a ranking function equal to 1.5 at each threshold, 0.5 at subrange midpoints, and 0.5 beyond twice the highest threshold, with cubic (default), sinusoidal, or linear interpolation between anchors; an extra factor $A(e_i)$ halves the weight when both measurements are in the same subrange. Applied to two published datasets, eMAE separates a weak portable monitor (MAE 20.21, eMAE 11.90) from a stronger tracheal-sound method (MAE 5.91, eMAE 2.76) more sharply than MAE alone, and the qualitative metrics (accuracy 57.7% versus 84.2%, kappa 0.32 versus 0.76, multi-class AUC 0.733 versus 0.939) reveal clinical consequences that correlation coefficients alone would not show.
Load-bearing premise
The load-bearing premise is that the hand-set weights—1.5 at the severity thresholds, 0.5 at subrange midpoints, and 0.5 for points inside the same subrange—genuinely reflect how much an AHI error matters for patient management, a connection the paper asserts rather than demonstrates, since it states that the chosen values may be different but were set arbitrarily.
Editorial extensions
If this is right
- Sleep-device validation studies that report only Pearson correlation should be considered incomplete; the paper's framework implies that accuracy, Cohen's kappa, and multi-class AUC should be reported alongside quantitative agreement metrics.
- A device can show a statistically non-significant median difference (Wilcoxon p = 0.95) while still misclassifying roughly 42% of patients, so statistical and clinical significance must be assessed together rather than interchangeably.
- The eMAE, especially with the default cubic ranking function, provides a single number that penalizes boundary-crossing errors more than plain MAE, making the relative gap between a weak and a strong device appear larger (2.42x for MAE versus 3.31x for cubic eMAE in the paper's two example datasets).
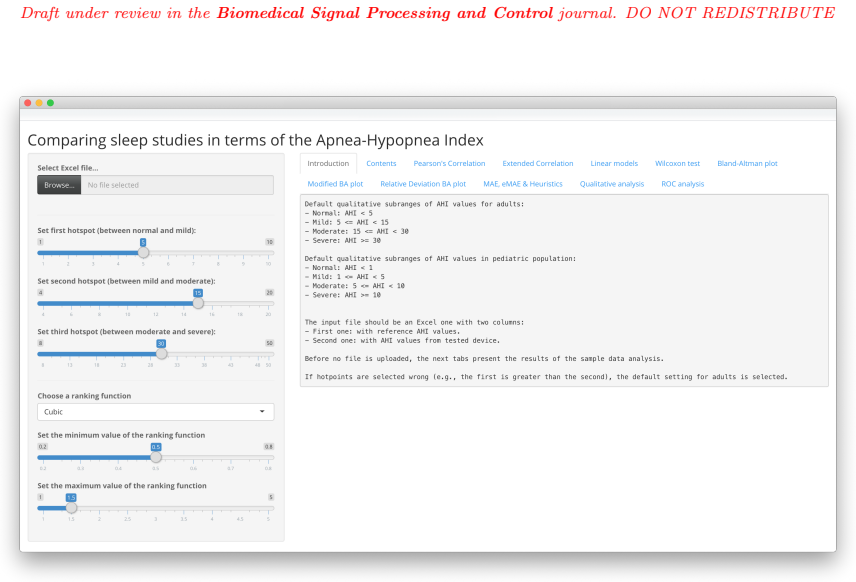
- Because thresholds are adjustable in the Shiny application, the same framework transfers to pediatric AHI thresholds (1, 5, 10) and to any device comparison where clinically defined subranges exist.
- When reporting eMAE, the chosen interpolation shape (cubic, sinusoidal, or linear) should be stated, since it changes the value and the shape's restrictiveness.
Reading between the lines
- The eMAE's weights are arbitrary by the authors' own statement, so the obvious next step is empirical calibration: regress actual treatment decisions on AHI errors at various locations to estimate a data-driven weighting function, then compare it with the hand-set 1.5/0.5 weights.
- The same ranking-function construction could be applied to any ordinal clinical scale with treatment thresholds (e.g., hypertension stages, hemoglobin A1c categories, tumor grading), giving a general family of clinically weighted error metrics.
- The ratio eMAE/MAE could be read as a boundary-concentration index: a high ratio indicates errors cluster near thresholds, which is exactly the situation where average error understates clinical risk.
- A sensitivity analysis over the three interpolation shapes, as the app already permits, would show whether device rankings are stable or an artifact of the chosen interpolation.
Signed reviews
Editorial analysis
A structured set of objections, weighed in public.
Referee Report
Summary. The paper argues that the Pearson correlation coefficient, which is frequently used to validate AHI-measuring devices, is insufficient because it does not reflect clinical significance. The authors review a range of quantitative and qualitative alternatives, including Bland-Altman plots, linear-model parameters, Spearman's rho, Lin's concordance correlation coefficient, MAE, accuracy, sensitivity/specificity, Cohen's Kappa, and multi-class AUC. As a new contribution, they propose an 'extended mean absolute error' (eMAE) that weights AHI errors by a ranking function emphasizing values near clinical thresholds (5, 15, 30 for adults), and they implement all methods in a Shiny web application. The paper demonstrates the approach on two example datasets and reports that eMAE stresses errors more than plain MAE, especially for the less concordant dataset.
Significance. The paper makes a useful and largely correct critical point: correlation alone is an inadequate validation metric for AHI devices, and multi-metric agreement assessment, including qualitative classification metrics, is more clinically relevant. The Shiny application is a practical, accessible tool that could benefit clinicians and statisticians. However, the central novelty, the eMAE ranking function, is currently supported only by hand-set weights that the authors explicitly state were chosen arbitrarily, and the reported advantages of eMAE over MAE are consequences of that choice rather than demonstrated properties. The comparisons in Tables 2 and 3 also lack uncertainty quantification. If the authors add sensitivity analysis, uncertainty measures, and either external clinical anchoring or a clearly exploratory framing, the paper could become a solid methods-and-software contribution.
major comments (3)
- [Section 2.2, Eq. (1)] The clinical meaning of eMAE rests entirely on the hand-set weights B(ref) and A(e): 1.5 at hotspots, 0.5 at midpoints, and 0.5 for within-subrange paired values. The paper states in Section 2.2 that 'the chosen values may be different, but we decided to set them arbitrarily.' Because eMAE is a weighted mean absolute error, the observed amplification (Table 2: eMAE cubic 3.31x versus MAE 2.42x) is a direct consequence of this arbitrary weight set, not evidence that eMAE captures clinically important errors. In particular, for a unit error at ref=5 the weight is about 1.5, while at ref=10 it is about 0.5 because the A(e)=0.5 factor applies within the same subrange, producing a six-fold difference that is not clinically motivated. The manuscript should include a sensitivity analysis over plausible weight choices and either anchor the default weights to external clinical criteria or explicitly present eMAE as an exploratory, user-weighted metric rather than a recommended diagnostic standard.
- [Section 3, Tables 2 and 3] Tables 2 and 3 report point estimates for MAE/eMAE, accuracy, Cohen's Kappa, and multi-class AUC without any measure of uncertainty. The central comparison in Table 2 (e.g., 2.42x versus 3.31x relative differences) is used to conclude that eMAE stresses errors more than MAE, but with sample sizes of 71 and 304 these differences could plausibly fall within sampling variability. Bootstrap confidence intervals, standard errors, or other uncertainty measures should be provided for all reported metrics, and the comparisons between datasets should account for that uncertainty before drawing conclusions about eMAE's behavior.
- [Sections 2.2 and 4] The claim that eMAE assesses clinical significance is not validated against any clinical outcome, treatment decision, or expert-based criterion. The paper demonstrates only that eMAE values differ from MAE values under the chosen weights; it does not show that eMAE better predicts clinical management or patient outcomes than ordinary MAE or simple accuracy. Without such an external anchor, the ranking function is a descriptive re-weighting of absolute error, and the stated objective of assessing 'clinical significance' alongside 'statistical significance' is not yet supported. The authors should either provide criterion validation linking eMAE to clinical endpoints or substantially soften the interpretation, presenting eMAE as one possible exploratory weighting scheme rather than a clinically validated metric.
minor comments (5)
- [Section 2.2, Eq. (1)] The notation A(e) is used without defining e; the text refers to 'points (e) in the same subrange,' which is unclear. Define e_i = res_i - ref_i, or state explicitly that A depends on the error being within a single AHI subrange.
- [References] References [8] and [31] are the same paper (Yalamanchali et al., 2013) and should be merged or cross-referenced to avoid duplication.
- [Section 4, Discussion] The phrase 'lo-factors' should be written as 'LOF factors' or 'local outlier factors' to match the cited density-based local outlier method.
- [Section 3, after Table 2] The statement that the cubic ranking function stresses errors 'little more than sinusoidal and linear, as the mean value of ranking function throughout the range is the lowest' is not self-evident from the figures; provide the mean weighting factors or a direct numerical justification.
- [Figures 4-6] In the submitted PDF, Figures 4-6 have overlapping or repeated axis annotations and equations, making them hard to read; please regenerate the figures with clearer layout and smaller annotation fonts.
Circularity Check
The eMAE 'amplification' result is definitionally guaranteed by the hand-set weights; the paper's broader multi-metric proposal remains independent.
-
self definitional
[Section 2.2 (Eq. 1) and Section 3 (Table 2 discussion)]
""Of course, the chosen values may be different, but we decided to set them arbitrarily." ... "Presented results show that eMAE enable stressing the errors more than regular MAE, and cubic ranking function little more than sinusoidal and linear, as the mean value of ranking function throughout the range is the lowest (the differences are the highest around hotspots).""
eMAE is defined in Eq. (1) as a weighted mean of absolute errors in which B(ref) is set to 1.5 at hotspots and 0.5 at midpoints, while A(e) is 0.5 for errors inside the same AHI subrange. Consequently, the property that eMAE gives greater relative emphasis to errors near thresholds is true by construction, not discovered from data. The Table 2 comparison (3.31x vs 2.42x relative difference) is an arithmetic consequence of these arbitrarily chosen weights applied to two illustrative datasets, and the sentence claiming eMAE 'stresses' errors more is a restatement of the definition.
full rationale
The paper's central critique of using correlation coefficients for AHI device validation is well grounded in standard statistical literature and is independent of the new eMAE metric. The qualitative analysis methods (accuracy, Kappa, multi-class AUC) and the other quantitative tools (Bland-Altman, Lin's CCC, etc.) are standard or externally referenced, so they do not introduce circularity. The only construction-dependent element is the presentation of eMAE's behavior as a 'result': since the weights in Eq. (1) are hand-set with maxima at clinical thresholds and minima at subrange midpoints, the observation that eMAE emphasizes threshold errors is guaranteed by the definition. The paper is transparent about the arbitrariness of the weights, so this is a disclosed tautology rather than a hidden fit, and it does not undermine the broader suggestion that agreement should be assessed with multiple complementary metrics. However, any claim that eMAE captures clinically important errors is not independently supported; it is an imposed operationalization. This warrants a moderate score of 4 rather than a higher one, because the paper does not present the eMAE behavior as a validated empirical prediction and the rest of the contribution stands on independent statistical reasoning.
Assumptions & free parameters
free parameters (4)
- w_hotspot =
1.5
- w_midpoint =
0.5
- A_same_subrange =
0.5
- A_diff_subrange =
1.0
assumptions (2)
- domain assumption Polysomnography-derived AHI is treated as the error-free reference, so all disagreement is attributed to the test device.
- domain assumption All values within one AHI subrange lead to the same clinical management, and the subrange boundaries (adult 5, 15, 30; pediatric 1, 5, 10) are clinically correct.
invented entities (1)
-
Ranking function B(ref)
Cite this review
Pith. "Pith review of Comparing sleep studies in terms of the Apnea-Hypopnea Index using dedicated Shiny web application." pith.science (2026). https://pith.science/paper/5N4ICANA
@misc{pith2026190800960,
  author       = {Pith},
  title        = {Pith review of: Comparing sleep studies in terms of the Apnea-Hypopnea Index using dedicated Shiny web application},
  year         = {2026},
  howpublished = {\url{https://pith.science/paper/5N4ICANA}},
  note         = {Machine review of arXiv:1908.00960}
}
read the original abstract
The Apnea-Hypopnea Index (AHI) is one of the most-used parameters from the sleep study that allows assessing both the severity of obstructive sleep apnea and the reliability of new devices and methods. However, in many cases, it is compared with a reference only via a correlation coefficient, or this value is at least the most emphasized. In this paper, we discuss the limitations of such an approach and list several alternative quantitative and qualitative techniques, along with their interpretations. We propose the assessment of clinical significance along with the statistical one. Qualitative analysis can be used for this purpose, or we suggest using the ranking function which enables consideration of various AHI values with different weights. It can be reliable for both adult-related and pediatric sleep studies. The dedicated Shiny web application, written in R, was developed to enable quick analysis for both physicians and statisticians.
Figures


Figures from the paper (3 more)


Reference graph
Works this paper leans on
-
[1]
Prevalence of sleep-disordered breathing in the general population: the HypnoLaus study,
R. Heinzer, S. Vat, P. Marques-Vidal, H. Marti-Soler, D. Andries, N. Tobback, and P. Vollenweider, “Prevalence of sleep-disordered breathing in the general population: the HypnoLaus study,” The Lancet Respiratory Medicine, vol. 3, no. 4, pp. 310-318, 2015
work page 2015
-
[2]
Epidemiology of pediatric obstructive sleep apnea
J.C. Lumeng and R.D. Chervin, “Epidemiology of pediatric obstructive sleep apnea”, Proc Am Thorac Soc, vol. 5, no. 2, pp. 242–252, 2008
work page 2008
-
[3]
Ambulatory blood pressure in children with ob- structive sleep apnoea: a community based study
A.M. Li, C.T. Au R.Y. Sung RY, et al., “Ambulatory blood pressure in children with ob- structive sleep apnoea: a community based study”, Thorax, vol. 63, no. 9, pp. 803–809, 2008
work page 2008
-
[4]
Pediatric obstructive sleep apnea: complications, management, and long-term outcomes
O.S. Capdevila, L. Kheirandish-Gozal, E. Dayyat, et al., “Pediatric obstructive sleep apnea: complications, management, and long-term outcomes”, Proc Am Thorac Soc, vol. 5, no. 2, pp. 274–282, 2008
work page 2008
-
[5]
Behavior, neurocognition and quality-of-life in children with sleep-disordered breathing
R.B. Mitchell and J. Kelly, “Behavior, neurocognition and quality-of-life in children with sleep-disordered breathing”, Int J Pediatr Otorhinolaryngol, vol. 70, no. 3, pp. 395–406, 2006
work page 2006
-
[6]
Obstructive sleep apnea in children: a critical update
H.L. Tan, D. Gozal and L. Kheirandish-Gozal, “Obstructive sleep apnea in children: a critical update”, Nat Sci Sleep, vol. 5, pp. 109–123, 2013
work page 2013
-
[7]
The new AASM criteria for scoring hypopneas: impact on the apnea hypopnea index,
W. R. Ruehland, P. D. Rochford, F. J. O’Donoghue, R. J. Pierce, P. Singh, and A. T. Thornton, “The new AASM criteria for scoring hypopneas: impact on the apnea hypopnea index,” Sleep, vol. 32, no. 2, pp. 150-157, 2009
work page 2009
-
[8]
Diagnosis of obstructive sleep apnea by peripheral arterial tonometry: meta- analysis
S. Yalamanchali, V. Farajian, C. Hamilton, T. R. Pott, C. G. Samuelson, and M. Friedman, “Diagnosis of obstructive sleep apnea by peripheral arterial tonometry: meta- analysis”, JAMA Otolaryngology–Head & Neck Surgery, vol. 139, no. 12, pp. 1343-1350, 2013. 14 Draft under review in the Biomedical Signal Processing and Control journal. DO NOT REDISTRIBUTE
work page 2013
Show all 36 references
-
[9]
Younes, M
M. Younes, M. Soiferman, W. Thompson and E. Giannouli, Performance of a New Portable Wireless Sleep Monitor, Journal of Clinical Sleep Medicine, vol. 13, no. 2, pp. 245-258, 2017
2017
-
[10]
A concordance correlation coefficient to evaluate reproducibility
L. I. Lin, “A concordance correlation coefficient to evaluate reproducibility”, Biometrics, vol. 45, pp. 255-268, 1989
1989
-
[11]
A note on the concordance correlation coefficient
L. I. Lin, “A note on the concordance correlation coefficient”, Biometrics, vol. 56, pp. 324-325, 2000
2000
-
[12]
DescTools: Tools for Descriptive Statistics
A. Signorell et al., “DescTools: Tools for Descriptive Statistics”, R package version 0.99.28, 2019, https://cran.r-project.org/package=DescTools
2019
-
[13]
Statistical methods for assessing agreement between two methods of clinical measurement
J. M. Bland, and D. Altman, “Statistical methods for assessing agreement between two methods of clinical measurement” Lancet, vol. 327, no.8476, pp. 307-310, 1986
1986
-
[14]
Mean expected error in prediction of total body water: a true accuracy comparison between bioimpedance spectroscopy and single frequency regression equations
F. Seoane, S. Abtahi, F. Abtahi, L. Elleg˚ ard, G. Johannsson, I. Bosaeus, and L. C. Ward, “Mean expected error in prediction of total body water: a true accuracy comparison between bioimpedance spectroscopy and single frequency regression equations”, BioMed Research Internati...
2015
-
[15]
A Simple Generalisation of the Area Under the ROC Curve for Multiple Class Classification Problems
D. J. Hand, and R. J. Till, “A Simple Generalisation of the Area Under the ROC Curve for Multiple Class Classification Problems”, Machine Learning, vol. 45, no. 2, pp. 171–186, 2001
2001
-
[16]
pROC: an open-source package for R and S+ to analyze and compare ROC curves
X. Robin, N. Turck, A. Hainard, N. Tiberti, F. Lisacek, J.-C. Sanchez, and M. Muller, “pROC: an open-source package for R and S+ to analyze and compare ROC curves”, BMC Bioinformatics, vol. 12, p. 77, 2011
2011
-
[17]
https://mmlynczak.shinyapps.io/AHIComparison/
-
[18]
shiny: Web Applica- tion Framework for R
W. Chang, J. Cheng, J.J. Allaire, Y. Xie, and J. McPherson, “shiny: Web Applica- tion Framework for R”, R package version 1.2.0, 2018, https://CRAN.R-project.org/ package=shiny
2018
-
[19]
shinythemes: Themes for Shiny
W. Chang, “shinythemes: Themes for Shiny”, R package version 1.1.2, 2018, https: //CRAN.R-project.org/package=shinythemes
2018
-
[20]
ggplot2: Elegant Graphics for Data Analysis
H. Wickham, “ggplot2: Elegant Graphics for Data Analysis”, Springer-Verlag New York, 2016
2016
-
[21]
plotly for R
C. Sievert, “plotly for R”, 2016, https://plotly-book.cpsievert.me
2016
-
[22]
DT: A Wrapper of the JavaScript Library ’DataTables’
Y. Xie, J. Cheng, and X. Tan, “DT: A Wrapper of the JavaScript Library ’DataTables’ ”, R package version 0.5, 2018, https://CRAN.R-project.org/package=DT. 15 Draft under review in the Biomedical Signal Processing and Control journal. DO NOT REDISTRIBUTE
2018
-
[23]
BlandAltmanLeh: Plots (Slightly Extended) Bland-Altman Plots
B. Lehnert, “BlandAltmanLeh: Plots (Slightly Extended) Bland-Altman Plots”, R package version 0.3.1, 2015, https://CRAN.R-project.org/package= BlandAltmanLeh
2015
-
[24]
caret: Classification and Regression Training
M. Kuhn et al., “caret: Classification and Regression Training”, R package version 6.0-81, 2018, https://CRAN.R-project.org/package=caret
2018
-
[25]
e1071: Misc Func- tions of the Department of Statistics
D. Meyer, E. Dimitriadou, K. Hornik, A. Weingessel, and F. Leisch, “e1071: Misc Func- tions of the Department of Statistics”, Probability Theory Group (Formerly: E1071), TU Wien, R package version 1.7-0., 2018, https://CRAN.R-project.org/package= e1071
2018
-
[26]
R: A language and environment for statistical computing
R Core Team, “R: A language and environment for statistical computing”. R Foundation for Statistical Computing, Vienna, Austria, 2018, https://www.R-project.org/
2018
-
[27]
ggExtra: Add Marginal Histograms to ’ggplot2’, and More ’ggplot2’ Enhancements
D. Attali, and C. Baker, “ggExtra: Add Marginal Histograms to ’ggplot2’, and More ’ggplot2’ Enhancements”, R package version 0.8, 2018,https://CRAN.R-project.org/ package=ggExtra
2018
-
[28]
The Accuracy of Portable Monitoring in Diagnosing Significant Sleep Disor- dered Breathing in Hospitalized Patients
S. Nagubadi, R. Mehta, M. Abdoh, M. Nagori S. Littleton, R. Gueret and A. Tu- laimat, “The Accuracy of Portable Monitoring in Diagnosing Significant Sleep Disor- dered Breathing in Hospitalized Patients” PLOS ONE, vol. 11, no. 12, pp. e0168073, 2016
2016
-
[29]
Tracheal Sound Analysis Using a Deep Neural Network to Detect Sleep Apnea
H. Nakano, T. Furukawa, T. Tanigawa, “Tracheal Sound Analysis Using a Deep Neural Network to Detect Sleep Apnea”, Journal of Clinical Sleep Medicine, vol. 15, no. 8, pp. 1125-1133, 2019
2019
-
[30]
Clinical practice guideline for diagnostic testing for adult obstructive sleep apnea: an American Academy of Sleep Medicine clinical practice guideline
V.K. Kapur, D.H. Auckley, S. Chowdhuri, D.C. Kuhlmann, R. Mehra, K. Ramar and C.G. Harrod, “Clinical practice guideline for diagnostic testing for adult obstructive sleep apnea: an American Academy of Sleep Medicine clinical practice guideline”, Jour- nal of Clinical Sleep Med...
2017
-
[31]
Diagnosis of obstructive sleep apnea by peripheral arterial tonometry: meta- analysis
S. Yalamanchali, V. Farajian, C. Hamilton, T.R. Pott, C.G. Samuelson and M. Fried- man, “Diagnosis of obstructive sleep apnea by peripheral arterial tonometry: meta- analysis”, JAMA Otolaryngology–Head and Neck Surgery, vol. 139, no. 12, pp. 1343- 1350, 2013
2013
-
[32]
Tracheal sound analysis for detection of sleep disordered breathing
M. Glos, A. Sabil, K.S. Jelavic, G. Baffet, C. Sch¨ obel, I. Fietze, and T. Penzel, “Tracheal sound analysis for detection of sleep disordered breathing”, Somnologie, vol. 23, no. 2, pp. 80-85, 2019
2019
-
[33]
Reliability of the Watch-PAT 200 in detecting sleep apnea in highway bus drivers
M. Yuceege, H. Firat, A. Demir and S. Ardic, “Reliability of the Watch-PAT 200 in detecting sleep apnea in highway bus drivers”, Journal of Clinical Sleep Medicine, vol. 9 no. 4, pp. 339-344, 2013. 16 Draft under review in the Biomedical Signal Processing and Control journal. ...
2013
-
[34]
Methodolog- ical strategies in using home sleep apnea testing in research and practice
J. N. Miller, P. Schulz, B. Pozehl, D. Fiedler, A. Fial and A. M. Berger, “Methodolog- ical strategies in using home sleep apnea testing in research and practice”, Sleep and Breathing, vol. 22, no. 3, pp. 569-577, 2018
2018
-
[35]
LOF: identifying density-based local outliers
M. M. Breunig, H. P. Kriegel, R. T. Ng and J. Sander, “LOF: identifying density-based local outliers”, In ACM sigmod record, vol. 29, no. 2, pp. 93-104, 2000
2000
-
[36]
The ASA’s statement on p-values: context, process, and purpose
R. L. Wasserstein and N. A. Lazar, “The ASA’s statement on p-values: context, process, and purpose”, The American Statistician, vol. 70, no. 2, pp. 129-133, 2016. 17
2016
Reviewed August 14, 2026 · model on record in the stance chip above.
Discussion (0). Continue with ORCID to comment.