REVIEW 5 major objections 5 minor 26 references
Linkages and systemic risk in the European insurance sector: Some new evidence based on dynamic spanning trees
T0 review · 5 major / 5 minor · reviewed 2026-08-14 · deepseek-v4-flash
Pith's one-line read During financial turbulence the European insurer network shrinks and becomes more centralized, and it stays scale-free in every period—conditions the paper says favor systemic risk propagation.
desk verdict Competent descriptive MST study of European insurers whose systemic-risk claims are undercut by a common-factor null and a weak power-law analysis; worth refereeing but needs revision. read the letter →
The pith
A machine-rendered reading of the paper's core claim, the machinery that carries it, and where it could break.
The reading
What carries the argument
The central object is a time series of minimum spanning trees (MSTs), one per week, whose nodes are 28 European insurers and whose edges are the shortest links under the distance $d_t(i,j)=\sqrt{2(1-R_t(i,j))}$, with $R_t$ the conditional correlation estimated pairwise by copula-DCC-GARCH. The MST is a tree with $k-1$ edges connecting all nodes with minimal total distance; the paper builds it with the standard greedy algorithm and then summarizes each tree by four topological indices: average path length, maximum degree, betweenness centrality, and the power-law exponent of the degree distribution. The machinery works by reducing a dense matrix of time-varying return co-movements to a sparse, connected graph whose compression is meant to expose the most probable shortest path of crisis transmission.
What would settle it
Recompute the same dynamic spanning trees after orthogonalizing each insurer's returns against a broad European equity index; if the crisis-period drop in average path length and the rise in maximum degree disappear, the tree shrinkage is common market co-movement rather than insurer-specific linkage.
Extended reading notes
Core claim
The paper claims that the dynamic minimum spanning tree of 28 large European insurers, built from conditional correlations estimated with copula-DCC-GARCH models, visibly shrinks during financial turbulence: the average path length falls while the maximum degree rises, and control concentrates first on AXA and then on Allianz. It further claims that the degree distribution of the tree follows a power law in every week of the 2005-2019 sample, so the insurer network is scale-free throughout. On this basis the paper concludes that the European insurance network's structure favors the propagation of potential systemic risk, and that the shrinkage observed before and during crises raises that propagation ability.
Load-bearing premise
The whole interpretation rests on the assumption that the correlation distance $\sqrt{2(1-R_t)}$ between stock returns captures the actual channels through which shocks spread between insurers; if co-movement mostly comes from a shared market factor or from liquidity effects that do not transmit default risk, then a shrinking tree is not evidence of rising systemic risk.
Editorial extensions
If this is right
- A sustained drop in average path length together with a rise in maximum degree can mark stress windows ahead of crisis peaks, as seen before the subprime crisis and before the European debt crisis.
- The identity of the controlling hub can shift between episodes—AXA dominated during the subprime crisis and Allianz during the debt crisis—so monitoring must track hub turnover, not only aggregate shrinkage.
- Because the degree distribution follows a power law in every period, the network always contains a few highly connected insurers; these hubs are the natural targets for macroprudential attention.
- The method produces a weekly topological snapshot, so supervisor dashboards could use average path length, maximum degree, and betweenness centrality as real-time indicators rather than waiting for quarterly balance-sheet data.
Reading between the lines
- A sharp test is to rerun the trees on residuals after removing a common European equity factor; if shrinkage survives, the claim is about insurer-specific linkage, and if not, it is mostly a market-beta effect.
- Extending the same tree construction to a combined insurer-bank network would show whether the hub turnover observed here also predicts cross-sector stress transmission.
- The scale-free finding implies that removing one hub would fragment the tree; a targeted stress test deleting Allianz or AXA from the network would quantify how much of the shortest-path structure depends on that single node.
- Because the paper uses weekly returns of listed equities, the method cannot see private insurers or non-equity channels such as reinsurance and derivatives; applying it to balance-sheet linkages would test whether stock-based trees are a proxy or a substitute.
Signed reviews
Editorial analysis
A structured set of objections, weighed in public.
Referee Report
Summary. The paper constructs weekly minimum spanning trees (MSTs) for 28 large European insurers over 07.01.2005–26.04.2019, using pairwise conditional correlations estimated from copula-DCC-GARCH models. The authors compute four topological indices (average path length, maximum degree, betweenness centrality, and the power-law exponent α of the degree distribution) and interpret drops in average path length together with rises in maximum degree as a 'shrinking' network during the subprime and European debt crises. They also claim that the degree distribution follows a power law in every period, hence the network is scale-free, and that scale-free structure favors the propagation of systemic risk in the European insurance sector.
Significance. If the central claims were established, the paper would offer a relatively cheap monitoring tool—MSTs built from stock-return correlations—for identifying periods of elevated systemic interconnectedness among European insurers. The application of copula-DCC-GARCH correlations to dynamic MST construction is a plausible methodological novelty, and the use of several topological indices is appropriate. However, the current evidence is largely descriptive: the crisis-shrinkage claim rests on visual inspection, the power-law claim is not supported by a test against alternatives, and the systemic-risk interpretation is not distinguished from a common-factor null. The paper therefore cannot yet deliver its headline conclusion.
major comments (5)
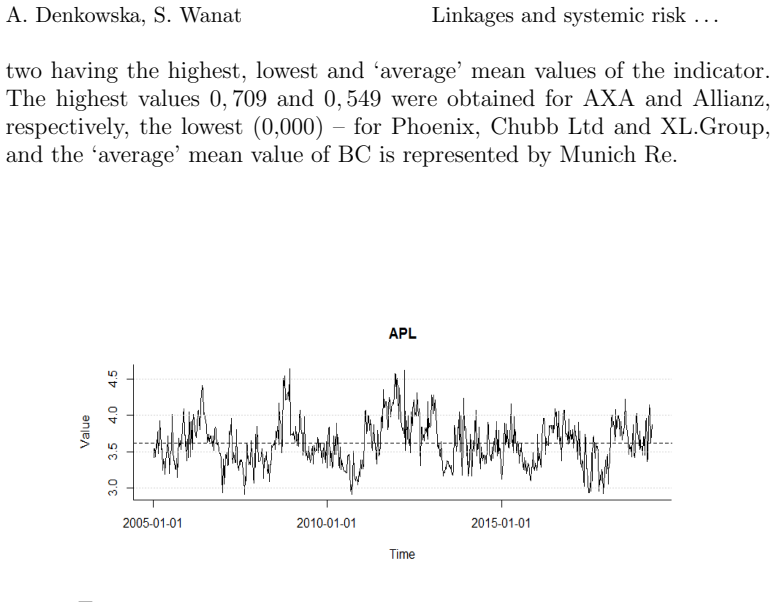
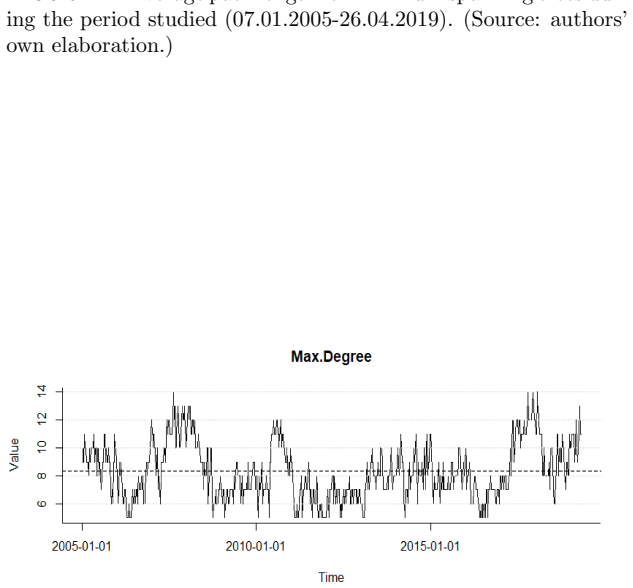
- [Section 5, Figures 2 and 3] The identification of the shrinking periods (02.06.2006–17.08.2007 and 05.12.2008–17.09.2010) is made by visual inspection of the plotted average path length and maximum degree, and no formal breakpoint detection, no crisis-versus-non-crisis comparison, and no significance statement is provided. The central empirical claim that network structure differs during high-turbulence periods is thus not statistically supported.
- [Section 3, step 4, and Section 5] The MST edges are asserted to represent 'the most probable and the shortest path of crisis transmission', but this rests on the untested assumption that co-movement in stock returns reflects insurer-to-insurer solvency linkages. Under a one-factor market model, all pairwise correlations increase in a crisis, and the MST of such a correlation matrix generically becomes star-like (low average path length, high maximum degree), reproducing the pattern reported in Figures 2 and 3 without any contagion mechanism. The authors should compare their observed indices with a common-factor or simulated null model and/or use partial correlations controlling for the market factor.
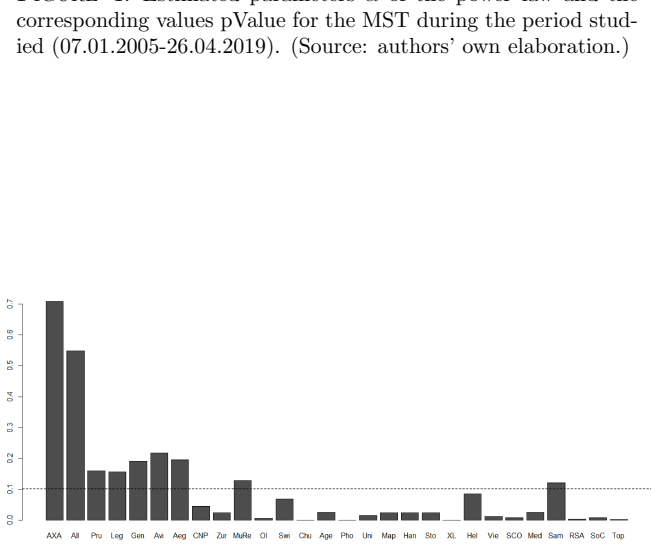
- [Section 4, Figure 4] With 28 vertices, every MST has exactly 27 edges, so the degree distribution has at most 28 points. The statement that 'in each period studied the degree distribution follows a power law' is based on fitted α and pValue; failure to reject a power law in such a small sample is not evidence for scale-free structure. The authors should compare the power-law model against alternatives such as exponential, log-normal, or truncated power-law distributions and report the uncertainty of the fits.
- [Section 4] The estimation results for the 372 pairwise copula-DCC-GARCH models are only described as 'available on demand'; no coefficients, standard errors, or goodness-of-fit summaries are shown for any of the estimated models. Because all subsequent MST indices depend on the estimated correlations, the paper should report at least summary diagnostics and a robustness check of the MSTs to alternative DCC/copula specifications.
- [Section 5, final paragraph] The conclusion that the scale-free character of the network 'favours the propagation of potential systemic risk' conflates a purely topological property with an economic mechanism. No evidence links the estimated hubs, path lengths, or degree exponents to actual default or loss propagation, to liquidity channels, or to the G-SII designation beyond assertion. This claim needs either a formal empirical link or appropriately weakened wording.
minor comments (5)
- [Throughout] There are numerous typos and grammatical errors, including 'dependances', 'miminum', 'reutrn', and 'the the' in the abstract and body; these should be corrected.
- [References] Reference [19] is incomplete (the author name appears garbled as 'nnela et al.'), and reference [13] is cited in Section 2 without an obvious connection to the text; please check all references for completeness and relevance.
- [Figures 2 and 3] The figures are described only by their captions; they would be much more informative if the crisis periods identified in the text were shaded or otherwise marked, and if the axes were explicitly labeled with the index values.
- [Notation] The paper uses 'conditional correlations' and 'dynamical correlations' inconsistently; the notation R_t(i,j) should be defined precisely as the DCC conditional correlation at time t to avoid confusion.
- [Footnote 1] The list of G-SIIs in footnote 1 appears to be a historical snapshot without an as-of date; please state the date of the list and note any subsequent changes.
Circularity Check
No circularity: descriptive spanning-tree analysis using standard external methods; the authors' self-citation is not load-bearing.
full rationale
The paper does not derive a prediction from a fitted parameter. It estimates conditional correlations with copula-DCC-GARCH models, constructs MSTs with the standard Kruskal algorithm using the Mantegna distance, and then reports topological time series (APL, maximum degree, power-law alpha, betweenness). The crisis-period shrinkage is an observed pattern in those time series, and the scale-free claim is a descriptive fit to each period's degree distribution; neither reduces to its inputs by construction. The only own prior work in the reference list ([25]) is not cited in the body and is not used as evidence. The distance metric and algorithm are attributed to external standard references ([14], [15]), not to a self-citation chain. Possible objections about a common-factor explanation for the MST shrinkage are concerns about interpretation or external validity, not circularity.
Assumptions & free parameters
free parameters (4)
- ARMA(1,1)-eGARCH(2,2) coefficients for each of the 28 return series =
Not reported
- DCC(1,1) parameters (c1, d1) =
Not reported
- Student copula shape parameter (constant) =
Not reported
- Power-law exponent alpha for each period's degree distribution =
Time-varying, shown in Figure 4
assumptions (4)
- domain assumption The distance d_t(i,j) = sqrt(2(1 - R_t(i,j))) maps correlation to distance in a way that preserves the economic ordering of linkages.
- domain assumption A minimum spanning tree of stock return correlations captures the most probable and shortest path of crisis transmission among insurers.
- domain assumption Higher conditional correlation of returns implies greater exposure to the same shocks and therefore higher systemic risk.
- domain assumption The list of companies and their total assets from relbanks.com is accurate and the 28 selected firms are representative of the European insurance sector.
Cite this review
Pith. "Pith review of Linkages and systemic risk in the European insurance sector: Some new evidence based on dynamic spanning trees." pith.science (2026). https://pith.science/paper/7E7RHK7S
@misc{pith2026190801142,
  author       = {Pith},
  title        = {Pith review of: Linkages and systemic risk in the European insurance sector: Some new evidence based on dynamic spanning trees},
  year         = {2026},
  howpublished = {\url{https://pith.science/paper/7E7RHK7S}},
  note         = {Machine review of arXiv:1908.01142}
}
read the original abstract
This paper is part of the research on the interlinkages between insurers and their contribution to systemic risk on the insurance market. Its main purpose is to present the results of the analysis of linkage dynamics and systemic risk in the European insurance sector which are obtained using correlation networks. These networks are based on dynamic dependence structures modelled using a copula. Then, we determine minimum spanning trees (MST). Finally, the linkage dynamics is described by means of selected topological network measures.
Figures

Figures from the paper (3 more)


Reference graph
Works this paper leans on
-
[1]
Baluch F., Mutenga S., Parsons C. Insurance, Systemic Risk and the Financial Crisis, The Geneva Papers on Risk and Insurance - Issues and Practice, Vol. 36(1) (2011), 126-163. doi:10.1057/gpp.2010.40
-
[2]
Bednarczyk T., Czy sektor ubezpieczeniowy kreuje ryzyko systemowe? (in Polish, Does the insurance sector generate systemic risk?), Studia Oeconomica Posnaniensia, Vol. 11 (260) (2013), 7-17
work page 2013
-
[3]
Bell M., Keller B., Insurance and Stability: The Reform of Insurance Regulation , Zurich Financial Services Group Working Paper (2009)
work page 2009
-
[4]
N., Systemic risk of insurers around the globe , Journal of Banking & Finance, 55, (2015), 232-245
Bierth C., Irresberger F., Weiß G. N., Systemic risk of insurers around the globe , Journal of Banking & Finance, 55, (2015), 232-245. doi:10.1016/j.jbankfin.2015.02.014
doi:10.1016/j.jbank 2015
-
[5]
Billio M., Getmansky M., Lo A. W., Pelizzon L., Econometric measures of connect- edness and systemic risk in the finance and insurance sectors , Journal of Financial Economics, Vol. 104(3) (2012), 535-559, doi:10.1016/j.jfineco.2011.12.010
doi:10.1016/j.j 2012
-
[6]
Chen H., Cummins J. D., Viswanathan K. S., Weiss M. A., Systemic Risk and the Interconnectedness Between Banks and Insurers: An Econometric Analysis , Journal of Risk and Insurance, Vol. 81(3), (2013), 623-652. doi:10.1111/j.1539- 6975.2012.01503.x
arXiv 2013
-
[7]
Cummins J. D., Weiss M. A., Systemic Risk and The U.S. Insurance Sector, Journal of Risk and Insurance, Vol. 81(3), (2014), 489-528. doi:10.1111/jori.12039
-
[8]
Czerwi´ nska T.,Systemic risk in the insurance sector , Problemy Zarz ↪adzania, Vol. 12(48), (2014), 41-63. doi:10.7172/1644-9584.48.3
Show all 26 references
-
[9]
EIOPA, Systemic risk and macroprudential policy in insurance , Publications Office of the European Union (2017),
2017
-
[10]
Denkowska, S
Geneva Association, Systemic risk in insurance: an analysis of insurance and finan- cial stability, Technical report, Special Report of The Geneva Association Systemic Risk Working Group, Switzerland (2010), 13 A. Denkowska, S. Wanat Linkages and systemic risk
2010
-
[11]
E., The Financial Crisis, Systemic Risk, and the Future of In- surance Regulation, Journal of Risk and Insurance, Vol
Harrington S. E., The Financial Crisis, Systemic Risk, and the Future of In- surance Regulation, Journal of Risk and Insurance, Vol. 76(4), (2009), 785-819. doi:10.1111/j.1539-6975.2009.01330.x
2009
-
[12]
IAIS, Global Systemically Important Insurers: Final Initial Assessment Methodology, International Association of Insurance Supervisors, July 18, Bank for International Settlements, Basel (2013),
2013
-
[13]
Johnson N. F., McDonald M., Suleman M., Williams S., Howison S.,What shakes the FX tree? understanding currency dominance, dependence, and dynamics (keynote address), SPIE Third International Symposium on Fluctuations and Noise, Interna- tional Society for Optics and Photonics...
2005
-
[14]
N., Hierarchical structure in financial markets, The European Physical Journal B-Condensed Matter and Complex Systems, Vol
Mantegna R. N., Hierarchical structure in financial markets, The European Physical Journal B-Condensed Matter and Complex Systems, Vol. 11, (1999), 193197
1999
-
[15]
N., Stanley H
Mantegna R. N., Stanley H. E., Introduction to econophysics: correlations and com- plexity in finance , Cambridge university press (1999)
1999
-
[16]
A review of two decades of cor- relations, hierarchies, networks and clustering in financial markets , (2017), arXiv preprint arXiv:1703.00485
Marti G., Nielsen, F., Bi´ nkowski M., Donnat P. A review of two decades of cor- relations, hierarchies, networks and clustering in financial markets , (2017), arXiv preprint arXiv:1703.00485
2017 arXiv
-
[17]
J., Sovereign public debt crisis in europe
Matesanz D., Ortega G. J., Sovereign public debt crisis in europe. a network analysis, Physica A: Statistical Mechanics and its Applications Vol.436, (2015), 756766
2015
-
[18]
B., Conditional Heteroskedasticity in Asset Returns: A New Approach , Econometrica, Vol
Nelson D. B., Conditional Heteroskedasticity in Asset Returns: A New Approach , Econometrica, Vol. 59, (1991), 347370
1991
-
[19]
P., Chakraborti A., Kaski K., Kertesz J., Dynamic asset trees and black Monday, Physica A: Statistical Mechanics and its Applications, Vol
nnela J. P., Chakraborti A., Kaski K., Kertesz J., Dynamic asset trees and black Monday, Physica A: Statistical Mechanics and its Applications, Vol. 324, (2003) , 247252
2003
-
[20]
P., Chakraborti A., Kaski K., Kertesz J., Kanto A., Dynamics of market correlations: Taxonomy and portfolio analysis , Physical Review E, Vol.68 (2003) , 056-110
Onnela J. P., Chakraborti A., Kaski K., Kertesz J., Kanto A., Dynamics of market correlations: Taxonomy and portfolio analysis , Physical Review E, Vol.68 (2003) , 056-110
2003
-
[21]
P., Chakraborti A., Kaski K., Kertesz J., Dynamic asset trees and port- folio analysis , The European Physical Journal B-Condensed Matter and Complex Systems, Vol
Onnela J. P., Chakraborti A., Kaski K., Kertesz J., Dynamic asset trees and port- folio analysis , The European Physical Journal B-Condensed Matter and Complex Systems, Vol. 30, (2002), 285288,
2002
-
[22]
Patton, A.J., Modelling asymmetric exchange rate , International Economic Review 47 (2) (2006), 527-556,
2006
-
[23]
M., Dynamic spanning trees in stock market networks: The case of Asia-Pacific , Physica A: Statistical Mechanics and its Applications, Vol
Sensoy A., Tabak B. M., Dynamic spanning trees in stock market networks: The case of Asia-Pacific , Physica A: Statistical Mechanics and its Applications, Vol. 414, (2014), 387402
2014
-
[24]
J., Jia Z.Y., Zhang Y.C., Complexities in financial network topo- logical dynamics: Modeling of emerging and developed stock markets , Complexity Vol
Tang Y., Xiong J. J., Jia Z.Y., Zhang Y.C., Complexities in financial network topo- logical dynamics: Modeling of emerging and developed stock markets , Complexity Vol. 2018, (2018), article ID 4680140
2018
-
[25]
Wanat S., Denkowska A., Measuring systemic risk in the European insurance sec- tor using copula-DCC-GARCH model and selected clustering methods , Conference Proceedings, 36th International Conference Mathematical Methods in Economics, Jindˇ rich˚ uv Hradec, September 12-14, 20...
2018
-
[26]
N., M¨ uhlnickel J., Why do some insurers become systemically relevant? , Journal of Financial Stability, Vol
Weiß G. N., M¨ uhlnickel J., Why do some insurers become systemically relevant? , Journal of Financial Stability, Vol. 13, (2014), 95-117. Cracow University of Economics, Chair of Mathematics, Rakowicka 27, 31-510 Krak´ow, Poland E-mail address : anna.denkowska@uek.krakow.pl C...
2014
Reviewed August 14, 2026 · model on record in the stance chip above.
Discussion (0). Continue with ORCID to comment.