REVIEW 4 major objections 6 minor 20 references
Bimodality and Scaling in Recurrence Networks from ECG data
T0 review · 4 major / 6 minor · reviewed 2026-08-14 · deepseek-v4-flash
Pith's one-line read This paper claims that one-minute ECG recordings, turned into recurrence networks, show a two-peaked degree distribution and two distinct scaling regimes in link density, with disease-specific values.
desk verdict A promising but overclaimed proof-of-concept: the bimodality and scaling observations are new, yet the paper's own text shows the headline features are threshold-dependent and not class-separating as stated. read the letter →
The pith
A machine-rendered reading of the paper's core claim, the machinery that carries it, and where it could break.
The reading
What carries the argument
The central object is the recurrence network: each point of the time-delay-embedded phase-space trajectory is a node, and two nodes are linked when their distance falls below a chosen threshold $\varepsilon$, giving an adjacency matrix $A_{ij} = \Theta(\varepsilon - \|\vec{v}_i - \vec{v}_j\|) - \delta_{ij}$. The embedding uses dimension $m=4$ with time delay taken from the autocorrelation falling to $1/e$, and $\varepsilon=0.1$ is chosen as the value where most networks become just connected. The machinery works by translating geometric structure into network statistics: the small dense loop and larger ring of the cardiac attractor produce the two peaks in degree, and increasing $\varepsilon$ from 0.1 to 0.5 gradually connects the network, exposing two scaling regimes in link density whose log-log slopes define $\gamma_1$ and $\gamma_2$.
What would settle it
Take the 96 recordings and, for each, compute the degree distribution over a grid of thresholds from 0.05 to 0.5 and embedding dimensions from 2 to 6. If a disease class is bimodal at one threshold and unimodal at neighboring thresholds, the bimodality is not robust. Separately, fit the link-density-versus-threshold curve on log-log axes without pre-chosen breakpoints; if two distinct linear segments cannot be identified consistently, the claimed two scaling regions do not exist.
Extended reading notes
Core claim
The paper's central discovery is that recurrence networks built from short clinical ECG time series have a bimodal degree distribution, with two well-separated peaks in the probability of a node having a given number of links, and the authors state this is the first time bimodality has been reported for recurrence networks derived from time series. Underlying the claim is the reconstructed phase-space attractor: healthy ECGs show a small dense loop-like region and a larger ring, and the dense region produces the second peak at higher degrees. The paper further finds that link density $LD$ varies with the recurrence threshold $\varepsilon$ as $LD \sim \varepsilon^{\gamma}$ in two distinct scaling regions, with exponents $\gamma_1$ and $\gamma_2$ that differ across diagnostic classes. Disease-specific average values of clustering coefficient, average path length, link density, and the two scaling exponents are presented as quantifiable signatures, with healthy cases showing the least variability.
Load-bearing premise
The analysis assumes that one fixed embedding dimension and one fixed recurrence threshold are appropriate for every ECG class, so if that choice creates or hides the second peak in some classes, the bimodality is an artifact of parameter selection rather than a property of cardiac dynamics.
Editorial extensions
If this is right
- Healthy ECGs show the least variability in clustering coefficient and average path length, so those measures provide a stable baseline for detecting abnormality.
- Because the two scaling exponents differ across diagnostic classes, $\gamma_1$ and $\gamma_2$ can serve as compact quantitative features for separating cardiac conditions.
- The method works on one-minute recordings, allowing complexity quantification for short and nonstationary clinical data where multifractal analysis would need longer series.
- The bimodality separates ECG recurrence networks from networks of standard chaotic, hyperchaotic, and noise signals, placing cardiac dynamics in a distinct structural class.
- In bundle branch block cases the second peak appears only when the threshold is increased, showing that the underlying structure exists but is less dense than in healthy cases.
Reading between the lines
- If the bimodality is robust, a simple classifier could use the positions and heights of the two degree peaks alone; the paper does not test classification accuracy, so this is an extension, not a claim.
- The two scaling regimes might correspond to fast local recurrences within the dense loop and slower returns around the larger ring, a dynamical interpretation the paper does not explicitly make.
- A direct test of the mechanism would be to generate synthetic ECG-like signals with and without the small-scale loop; if the second peak disappears when the loop is removed, the geometric interpretation would be confirmed.
- Applying the same threshold-scanning analysis to heart-rate-variability series could connect this network signature to the larger HRV classification literature.
Signed reviews
Editorial analysis
A structured set of objections, weighed in public.
Referee Report
Summary. The manuscript constructs recurrence networks (RNs) from one-minute clinical ECG recordings taken from the PTB database, for healthy subjects and four disease classes (Bundle Branch Block, Cardiomyopathy, Dysrhythmia, Myocardial Infarction), and compares them with RNs from chaotic, hyperchaotic, and noise data. The two central claims are, first, that the RN degree distribution of ECG data is bimodal, reflecting two spatial scales in the reconstructed attractor, and second, that the link density as a function of the recurrence threshold displays two scaling regions, quantified by indices gamma1 and gamma2. The authors further suggest that these features and their averaged network measures can distinguish disease classes from healthy cases. The analysis uses standard time-delay embedding with fixed embedding dimension m=4 and a fixed recurrence threshold epsilon=0.1, and reports averaged network measures in Table 1 and scaling indices in Table 2.
Significance. If the bimodality and two-regime scaling claims were rigorously established, this would be a useful contribution to the analysis of short clinical ECG recordings, since recurrence-network measures are relatively simple to compute and do not require long data sets. The manuscript has strengths: it applies a well-defined, standard recurrence-network construction to public data; it includes comparisons with standard dynamical systems and noise; and it reports average values over a reasonably large set of 96 recordings. However, the central claims are not currently supported by the evidence presented. The paper's own text states that at the chosen threshold epsilon=0.1 the degree distribution for Bundle Branch Block is unimodal, directly contradicting the abstract's claim that bimodality is a common feature of RNs from all types of ECG data. The scaling claim is similarly weakened by statements that for Myocardial Infarction the scaling regions are difficult to discern and for Bundle Branch Block there is almost no change of slope. No quantitative bimodality test, no threshold-invariance analysis, and no surrogate-data comparison are given.
major comments (4)
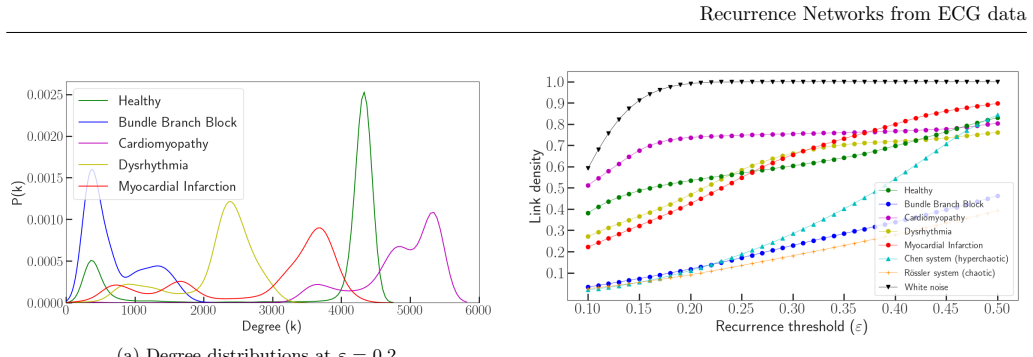
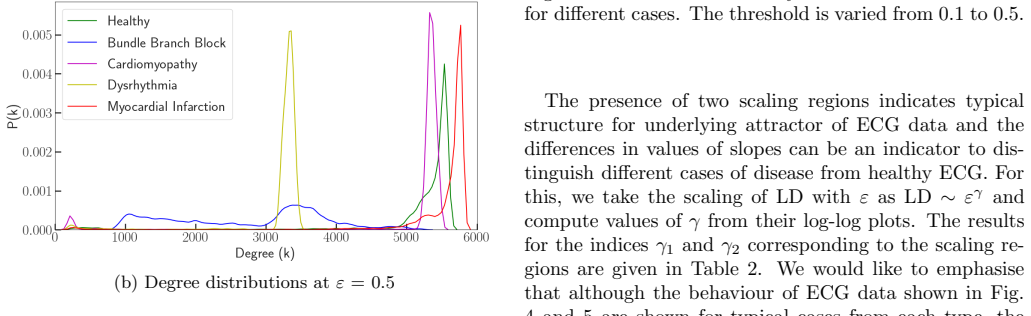
- [Degree distribution and Abstract/Conclusion] The central claim that bimodality is a common feature of all types of ECG data is internally inconsistent with the reported results. In the section 'Degree distribution', the authors state for BB: 'the distribution is unimodal at this threshold', and in the threshold-variation section they state that for MI 'the first peak disappears as we increase epsilon to 0.5'. The abstract and conclusion nevertheless assert that both bimodality and two-region scaling are 'common features of RNs from all types of ECG data'. Since the fixed construction threshold epsilon=0.1 is the only threshold used for the headline degree distributions in Fig. 3, the universal claim is contradicted by the manuscript's own observations. This must be resolved, either by revising the claims or by providing a systematic threshold-dependent definition of bimodality that is tested across all 96 datasets.
- [Construction of Recurrence Networks from embedded phase space attractors of ECG data] The choice of a single recurrence threshold epsilon=0.1 and a single embedding dimension m=4 for all classes is not justified for the central claims. The text justifies epsilon=0.1 only by saying 'most of the networks become just connected', which is a connectivity criterion, not a criterion for preserving bimodality or scaling behavior. The authors themselves note that BB is unimodal at epsilon=0.1 and becomes bimodal only at epsilon=0.2, while MI changes qualitatively as epsilon increases. Because the claimed two-scale attractor structure and the scaling indices depend on threshold, the manuscript needs to show that the qualitative features are stable over a meaningful range of epsilon and m, or to explain explicitly why a single fixed threshold is appropriate for the universal claims made in the abstract.
- [Scaling of link density with recurrence threshold, Table 2] The two-scaling-region claim is not supported as a common feature. The text states that for MI 'it is difficult to discern the distinct scaling regions' and for BB 'there is almost no change of slope'. These statements contradict the general assertion that two scaling regions are observed for ECG data. In addition, the scaling indices in Table 2 show large standard deviations and heavy overlap across classes; for example, healthy gamma2 = 0.387 +/- 0.296 and MI gamma2 = 0.372 +/- 0.276 are statistically indistinguishable. The manuscript also does not state how the boundaries of the scaling regions are chosen. The authors need to provide a quantitative, reproducible procedure for identifying scaling regions, and should test whether gamma1 and gamma2 actually separate disease classes using a statistical test rather than visual inspection of Fig. 5.
- [Degree distribution, Fig. 3] Fig. 3 shows degree distributions for single typical cases without error bars, uncertainty bands, or a quantitative bimodality test. The claim that the bimodal shape is a stable property of the recurrence-network ensemble requires at minimum a measure such as the dip test, Hartigan's dip test, or a Gaussian-mixture fit applied to all 96 datasets, together with a comparison against surrogate data or randomized thresholds. As presented, the evidence for bimodality is visual inspection of a few examples, which is not sufficient for a novelty claim of the strength made in the abstract.
minor comments (6)
- [Abstract] There is a typo in the abstract: 'we also show that that there is relevant information' should read 'we also show that there is relevant information'.
- [Fig. 3 caption and Degree distribution] The Fig. 3 caption states 'The degree distribution is bimodal in nature in all cases of ECG data sets', but the text in the same section says that BB is unimodal at the chosen threshold. The caption and the text should be brought into agreement.
- [Construction of Recurrence Networks from embedded phase space attractors of ECG data] The downsampling procedure from 60000 to 6000 points by binning is described only in one sentence. The authors should specify the bin width, whether the binning uses averaging or another rule, and show that the downsampling does not remove the small-scale structures that are central to the bimodality interpretation.
- [Scaling of link density with recurrence threshold] The manuscript states that epsilon is varied from 0.1 to 1.0 in steps of 0.01 but results are shown only up to 0.5 because 'there is no significant change after 0.5'. The criterion for 'no significant change' is not given, and the scaling regions in Fig. 5 appear to be selected by eye; a reproducible method for locating the two regions is needed.
- [Conclusion] The conclusion says that the analysis 'is to be applied to larger number of data sets so that disease specific ranges of measures and scaling indices can be derived' and that this work is 'already in progress'. This statement is in tension with the earlier claims that disease-specific variations can be quantified from the present 96 datasets; the manuscript should clarify which claims are established now and which are prospective.
- [General] No data availability or code availability statement is provided, although all data come from a public database. A statement with the exact PTB record identifiers and, where possible, the analysis code would substantially increase reproducibility.
Circularity Check
No significant circularity: the paper reports empirical characterizations of ECG recurrence networks and does not fit a parameter into the quantity it claims to derive.
full rationale
Walking the claimed derivation chain: the recurrence network is built from standard definitions (adjacency from thresholded distances; CC, APL, LD from Eqs. 1-3), and all reported outputs -- degree distribution, clustering, path length, link density, and scaling indices -- are computed directly from the ECG data after fixed preprocessing. No equation defines a claimed output in terms of the conclusion it supports. The embedding dimension is chosen by False Nearest Neighbours, the time delay by the standard autocorrelation criterion, and the recurrence threshold is selected only by the 'just connected' condition ('most of the networks become just connected at epsilon = 0.1'), not by fitting to bimodality or to two scaling regions. The bimodality and two-scaling-region observations are empirical descriptions rather than predictions derived from the inputs; the later 'two spatial scales' explanation is an interpretation after the fact. The self-citations to the authors' prior work ([10], [18]) concern multifractal background and an embedding method and are not load-bearing for the central claim. The paper's own caveats -- e.g. that BB is unimodal at epsilon = 0.1 and that MI's first peak disappears at epsilon = 0.5 -- point to a possible threshold-dependence or internal-consistency problem, but that is a robustness concern, not circularity: the observed features are not equivalent to the construction parameters by definition. No fitted parameter is renamed as a prediction, and no uniqueness claim is imported from self-citation. The derivation chain is therefore self-contained; no circular step can be exhibited.
Assumptions & free parameters
free parameters (4)
- Recurrence threshold epsilon =
0.1
- Embedding dimension m =
4
- Scaling indices gamma1 and gamma2 =
See Table 2, e.g., healthy 0.782 +/- 0.288 and 0.387 +/- 0.296
- Downsampling factor =
10 (60000 to 6000 points)
assumptions (5)
- domain assumption The ECG time series can be treated as a low-dimensional dynamical system suitable for time-delay embedding (Takens' theorem).
- ad hoc to paper A single recurrence threshold epsilon=0.1 and embedding dimension m=4 are appropriate for all 96 datasets regardless of disease class.
- domain assumption The PTB database labels and the chosen 96 cases are sufficiently accurate and representative for disease comparisons.
- ad hoc to paper Filtering at 0.5 to 50 Hz, normalizing to [0,1], and downsampling by binning from 60000 to 6000 points preserve the features relevant to recurrence networks.
- ad hoc to paper Link density scales as LD ~ epsilon^gamma over two regions, and the hand-chosen region boundaries are meaningful.
Cite this review
Pith. "Pith review of Bimodality and Scaling in Recurrence Networks from ECG data." pith.science (2026). https://pith.science/paper/7BNN6L53
@misc{pith2026190801286,
  author       = {Pith},
  title        = {Pith review of: Bimodality and Scaling in Recurrence Networks from ECG data},
  year         = {2026},
  howpublished = {\url{https://pith.science/paper/7BNN6L53}},
  note         = {Machine review of arXiv:1908.01286}
}
read the original abstract
Human heart is a complex system that can be studied using its electrical activity recorded as Electrocardiogram (ECG). Any variations or anomalies in the ECG can indicate abnormalities in the cardiac dynamics. In this work, we present a detailed analysis of ECG data using the framework of recurrence network (RN). We show how the measures of the recurrence networks constructed from ECG data sets, can quantify the complexity and variability underlying the data. Our study shows for the first time that the RN from ECG show the unique feature of bimodality in their degree distribution. We relate this to the complex dynamics underlying the cardiac system, with structures at two spatial scales. We also show that that there is relevant information to be extracted from the scaling of measures with recurrence threshold. Thus we observe two scaling regions in the link density for ECG data which is compared with scaling in RNs from standard chaotic and hyperchaotic systems and noise. While both bimodality and scaling are common features of RNs from all types of ECG data, we find disease specific variations in them can be quantified.
Figures


Figures from the paper (1 more)
Reference graph
Works this paper leans on
-
[1]
and Schreiber T., Nonlinear time series anal- ysis Vol
Kantz H. and Schreiber T., Nonlinear time series anal- ysis Vol. 7 (Cambridge university press) 2004
work page 2004
-
[2]
Donner R. V., Zou Y., Donges J. F., Marwan N. and Kurths J., New Journal of Physics , 12 (2010) 033025
work page 2010
-
[3]
Zou Y., Donner R. V., Marwan N., Donges J. F. and Kurths J., Physics Reports, (2018)
work page 2018
-
[4]
Sharma V., The open cardiovascular medicine journal, 3 (2009) 110
work page 2009
-
[5]
Kotani K., Struzik Z. R., Takamasu K., Stanley H. E. and Yamamoto Y., Physical Review E, 72 (2005) 041904
work page 2005
-
[6]
McSharry P. E., Clifford G. D., Tarassenko L. and Smith L. A. , IEEE transactions on biomedical engineer- ing, 50 (2003) 289
work page 2003
-
[7]
et al., Medical and Biological Engineer- ing and Computing , 42 (2004) 288
Acharya R., Kumar A., Bhat P., Lim C., Kannathal N., Krishnan S. et al., Medical and Biological Engineer- ing and Computing , 42 (2004) 288
work page 2004
-
[8]
Acharya U. R., Joseph K. P., Kannathal N., Lim C. M. and Suri J. S. , Medical and biological engineering and computing, 44 (2006) 1031
work page 2006
Show all 20 references
-
[9]
R., Fujita H., Oh S
Acharya U. R., Fujita H., Oh S. L., Hagiwara Y., Tan J. H. and Adam M. , Information Sciences , 415 (2017) 190
2017
-
[10]
M., Kotriwar Y., Harikrishnan K
Shekatkar S. M., Kotriwar Y., Harikrishnan K. and Ambika G. , Scientific reports, 7 (2017) 15127
2017
-
[11]
G., Taylor J
V alenza G., Citi L., Garcia R. G., Taylor J. N., Toschi N. and Barbieri R. , Scientific reports, 7 (2017) 42779
2017
-
[12]
and Schnabel A
Bousseljot R., Kreiseler D. and Schnabel A. , phy- sionet. org, (2004)
2004
-
[13]
L., Amaral L
Goldberger A. L., Amaral L. A. N., Glass L., Hausdorff J. M., Ivanov P. C., Mark R. G., Mietus J. E., Moody G. B., Peng C.- K. and Stanley H. E. , Circulation, 101 (2000 (June 13)) e215 circulation Electronic Pages: http://circ.ahajournals.org/content/101/23/e215.full PMID:108...
-
[14]
and Kantz H., Chaos: An Interdisciplinary Journal of Nonlinear Science , 25 (2015) 097610
Bradley E. and Kantz H., Chaos: An Interdisciplinary Journal of Nonlinear Science , 25 (2015) 097610
2015
-
[15]
M., Spaan J
Acharya R., Krishnan S. M., Spaan J. A. and Suri J. S. , Advances in cardiac signal processing (Springer) 2007
2007
-
[16]
K., Uysal A
Berkaya S. K., Uysal A. K., Gunal E. S., Ergin S., Gunal S. and Gulmezoglu M. B. , Biomedical Signal Processing and Control, 43 (2018) 216
2018
-
[17]
and Schreiber T
Hegger R., Kantz H. and Schreiber T. , Chaos: An Interdisciplinary Journal of Nonlinear Science , 9 (1999) 413
1999
-
[18]
and Kemb- havi A
Harikrishnan K., Misra R., Ambika G. and Kemb- havi A. , Physica D: Nonlinear Phenomena , 215 (2006) 137
2006
-
[19]
, Networks: an introduction (Oxford univer- sity press) 2010
Newman M. , Networks: an introduction (Oxford univer- sity press) 2010
2010
-
[20]
and Yuan Z
Chen Z., Yang Y., Qi G. and Yuan Z. , Physics Letters A, 360 (2007) 696. p-6
2007
Reviewed August 14, 2026 · model on record in the stance chip above.
Discussion (0). Continue with ORCID to comment.