REVIEW 2 major objections 5 minor 17 references
Testing Multispecies Coalescent Simulators using Summary Statistics
T0 review · 2 major / 5 minor · reviewed 2026-08-14 · deepseek-v4-flash
Pith's one-line read A simple pair of summary statistics can certify which gene-tree simulators sample the multispecies coalescent correctly — and two popular ones fail.
desk verdict A practical, mostly correct MSC simulator testing paper with a real (but non-fatal) typo in its headline Table 1; the qualitative findings about Mesquite and Hybrid-lambda hold up. read the letter →
The pith
A machine-rendered reading of the paper's core claim, the machinery that carries it, and where it could break.
The reading
What carries the argument
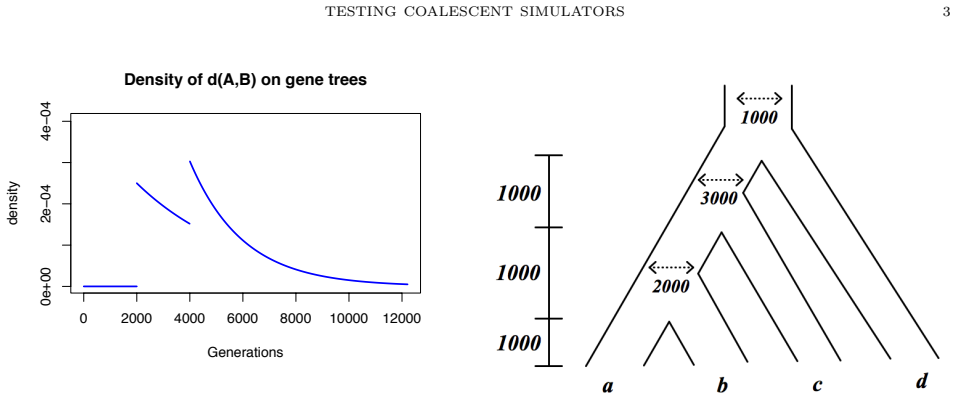
The load-bearing objects are two closed-form theoretical distributions. First, the pairwise distance density: if two lineages enter the same population at node $v$ and then traverse edges $e_1,\dots,e_k$ to the root, with population-size functions $N_{e_i}(t)$ and escape probabilities $\eta_i = \exp\left(-\int_0^{\ell_i} 1/N_{e_i}(\tau)\,d\tau\right)$, the density of the time to coalescence is a piecewise (shifted, scaled) exponential with discontinuities at population boundaries. Second, the rooted triple probabilities: for three taxa whose two shallowest lineages enter the shared population with internal branch length $x$ in coalescent units, $P(((a,b),c)) = 1 - (2/3)e^{-x}$ and the two discordant topologies each have probability $(1/3)e^{-x}$. These give exact expected histograms and counts that a simulator sample can be tested against.
What would settle it
Take a clearly incorrect simulator that preserves the marginal pairwise-distance distribution and rooted triple frequencies of the MSC but breaks other features, for example by drawing each gene tree's topology and coalescence times independently rather than jointly. If the MSCsimtester tests return uniformly distributed p-values on its output, that would refute the paper's assertion that these statistics are likely to uncover most problems; if the tests reject, the assertion is supported.
Extended reading notes
Core claim
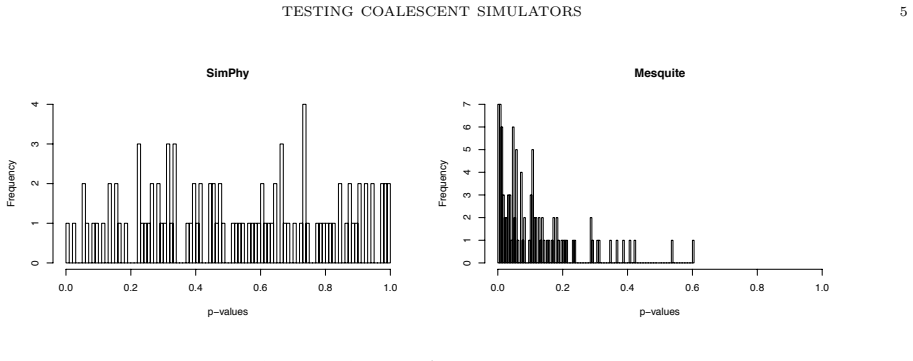
The paper's central discovery is that the MSC imposes exact, computable distributions on two summary statistics of a gene-tree sample: for any pair of taxa, the coalescence times follow a piecewise exponential density whose pieces are determined by the population sizes along the path from the pair's most recent common ancestor to the root; and for any three taxa, the three rooted gene-tree topologies occur with frequencies $P(((a,b),c)) = 1 - (2/3)e^{-x}$ and $P(((a,c),b)) = P(((b,c),a)) = (1/3)e^{-x}$, where $x$ is the internal branch length in coalescent units. By comparing a simulator's output on these two statistics to the theory — using an Anderson-Darling test for the distance distribution and a chi-squared test for the triple counts — the paper shows that valid and invalid simulators separate cleanly. In particular, among four published simulators, SimPhy and correctly parameterized Phybase produce samples in accord with the MSC, Hybrid-$\lambda$ samples correctly in topology but wrong in metric gene trees, and Mesquite fails on both. The authors argue these tools should be standard for simulator validation.
Load-bearing premise
The tests assume the two chosen summary statistics—pairwise distances and rooted triple frequencies—are sensitive enough to reveal any meaningful departure from the MSC, so a simulator error that leaves these two margins unchanged would go undetected.
Editorial extensions
If this is right
- Simulation studies that used Mesquite or Hybrid-lambda to generate MSC gene trees may have drawn invalid samples, so their conclusions should be re-examined cautiously.
- The R package MSCsimtester gives developers a way to detect errors in new simulators and users a way to verify that input parameters are interpreted correctly.
- Correctly configuring Phybase requires supplying branch lengths as $\mu t$ and population sizes as $\theta = 4\mu N$; with that, its samples pass the tests.
- Because the tests rely on large samples and subsampling to avoid misleadingly small p-values, they provide a practical standard for routine simulator validation.
Reading between the lines
- Inference: The same two-statistic approach could be extended to the multispecies network coalescent, where rooted triple frequencies and pairwise distance distributions have analogous closed forms, allowing detection of errors in hybridization simulators.
- Inference: Because the tests check marginal distributions only, a simulator that draws each gene tree's topology and coalescence times independently—while preserving the correct marginals—would pass; testing the joint distribution (for example, via the covariance of pairwise distances) would be the next strengthening.
- Inference: Re-analysis of simulation studies that relied on Mesquite or Hybrid-lambda as ground truth could reveal which published performance comparisons of species-tree inference methods are affected.
Signed reviews
Editorial analysis
A structured set of objections, weighed in public.
Referee Report
Summary. The paper develops statistical tools to test whether gene tree samples produced by multispecies coalescent (MSC) simulators conform to the MSC model. Two summary statistics are used: the distribution of pairwise distances between taxa on gene trees, and the frequencies of rooted triple topologies. Theoretical distributions for both statistics are derived from first principles in Sections 4.1 and 4.2, and the tools are implemented in an R package called MSCsimtester. The tests are applied to 100,000 gene tree samples from four published simulators. The authors conclude that SimPhy and correctly parameterized Phybase produce samples consistent with the MSC, Hybrid-lambda fails the metric tests but passes the topological tests, and Mesquite fails both metric and topological tests. The paper explicitly acknowledges that the chosen summary statistics cannot give an ironclad guarantee of correctness but argues they are likely to uncover most problems.
Significance. If the results hold, the paper provides a practical validation toolkit for a widely used class of phylogenomic simulation software. The theoretical derivations in Sections 4.1 and 4.2 are transparent, self-contained, and correct, and the statistical procedures are applied sensibly, including subsampling to avoid over-rejection on very large samples. The finding that two popular simulators (Mesquite and, in the metric sense, Hybrid-lambda) produce invalid MSC samples is an important community service. The authors also provide an R package, which strengthens the paper's utility. The main limitation, that the two selected summary statistics may not detect all possible deviations, is explicitly acknowledged by the authors and is reasonable for a practical testing framework.
major comments (2)
- [Table 1 / §4.2] The row for rooted triple ((A,B),D) in Table 1 (and Table S3) reports Expected counts 70044, 14977, 14977, but the formula in §4.2 gives P(discordant) = (1/3)exp(-x) with x = 1000/2000 + 1000/3000 = 0.8333, yielding expected counts 71028, 14486, 14486. The printed expectation is inconsistent with the paper's own formula and does not sum to 100,000 (it sums to 99,998). The p-values in that row (e.g., Phybase 0.940) are consistent with the corrected expectation, so the error appears to be in the printed Expected column rather than in the computation. Please correct the table and re-verify that all rows' p-values match the reported expectations.
- [Table 1 and Table S3, SimPhy row for ((A,B),C)] The SimPhy counts in the ((A,B),C) row of Table 1 are 59120, 20397, 20483, but the reported p-value 0.554 is inconsistent with these counts under the stated expectation (59564, 20217, 20217); the chi-squared statistic is approximately 8.41, which with 2 degrees of freedom yields p ≈ 0.015. Moreover, the SimPhy counts in Table S3 for the same species tree and rooted triple are 59764, 20091, 20145, and these counts likewise do not yield the reported p-value 0.504 (they give p ≈ 0.425). The SimPhy rows for ((A,C),D) and ((B,C),D) also differ between Table 1 and Table S3. These discrepancies suggest typographical errors or results from different simulation runs; the authors must reconcile all tables and ensure the p-values correspond to the reported count vectors.
minor comments (5)
- [Section 3] There is a typo in the text: 'SymPhy' should be 'SimPhy'.
- [Section 4.2] The word 'exchangability' should be 'exchangeability'.
- [Supplementary methods] The notation used in the species trees, e.g., '#2000', is not defined in the main text; please add a sentence explaining that it denotes the population size assigned to the preceding edge.
- [Section 1] The caveat that the two summary statistics may not detect all simulator errors is important and is stated appropriately; consider adding a short paragraph in the Discussion on the sensitivity of the tests and how users might combine them with additional statistics.
- [Section 3 / Table 1] The rooted triple p-values are computed from a single sample of 100,000 gene trees, with the authors noting that this gives preliminary results. It would be helpful to report the variability of p-values across repeated simulations, as is done for the Anderson-Darling test in Figure 5.
Circularity Check
No significant circularity: the paper's benchmark distributions are derived from first-principles coalescent theory and are applied to simulator output as external tests.
full rationale
The paper's central derivations are self-contained. In §4.1, the pairwise distance density f(y) is derived directly from the coalescence rate 1/N*(x) over the concatenated population-size function, and in §4.2 the rooted triple probabilities are obtained from the product of failure-to-coalesce factors η_j, giving P(((a,c),b)) = P(((b,c),a)) = (1/3)∏η_j and P(((a,b),c)) = 1 − (2/3)∏η_j. These formulas are stated and derived in the Methods section, so the comparison values used to test the simulators do not depend on any simulator output. The citation to Allman et al. (2019) for the two-lineage density c(x) is not load-bearing, because the same formula is written out in the paper's own derivation with N*(x) defined locally. No parameter is fitted to the simulator samples before computing expected counts or theoretical densities; instead, expected counts are computed by multiplying the theoretical probabilities by the sample size, and the observed counts are then compared via chi-squared tests and Anderson-Darling tests. The MLE of the internal branch length, δ̂ = −log((3/2)·T/100,000), is an estimator applied to the observed counts, not a fitted input used to define the theoretical expectation. The paper even reports an internal-consistency caveat that summary statistics cannot give an ironclad guarantee, which is a sensitivity limitation, not a circularity. The independently noted discrepancy in Table 1's expected counts for ((A,B),D) on S3 is a numerical reporting error in one row; it does not affect the derivation chain, and the qualitative conclusions (Mesquite fails catastrophically, others pass) survive under either the printed or the corrected expectation. Therefore, no circular step is present, and the circularity score is 0.
Assumptions & free parameters
assumptions (3)
- standard math Two lineages in a population of size N(t) coalesce with instantaneous rate 1/N(t), giving the density c(x) used for pairwise distances.
- standard math If a and b lineages fail to coalesce before the root, the three lineages a, b, c become exchangeable, so each pair is equally likely to be the first to coalesce.
- domain assumption Population size functions are such that 1/N_e(t) is integrable on finite intervals.
Cite this review
Pith. "Pith review of Testing Multispecies Coalescent Simulators using Summary Statistics." pith.science (2026). https://pith.science/paper/GJBO6S7H
@misc{pith2026190801424,
  author       = {Pith},
  title        = {Pith review of: Testing Multispecies Coalescent Simulators using Summary Statistics},
  year         = {2026},
  howpublished = {\url{https://pith.science/paper/GJBO6S7H}},
  note         = {Machine review of arXiv:1908.01424}
}
read the original abstract
As genomic scale datasets motivate research on species tree inference, simulators of the multispecies coalescent (MSC) process are essential for the testing and evaluation of new inference methods. However, the simulators themselves must be tested to ensure they give valid samples from the coalescent process. In this work we develop several statistical tools using summary statistics to evaluate the fit of a simulated gene tree sample to the MSC model. Using these tests on samples from four published simulators, we uncover flaws in several. The tests are implemented as an R package, so that both developers and users will be able to easily check proper performance of future simulators.
Figures


Figures from the paper (1 more)
Reference graph
Works this paper leans on
-
[1]
Allman, E., Long, C., and Rhodes, J. 2019. Species tree inference from genomic sequences using the log-det distance. SIAM J. Appl. Algebra Geometry\/ , 3 (1): 1--30
work page 2019
-
[2]
Anderson, T. and Darling, D. 1952. Asymptotic theory of certain "goodness-of-fit" criteria based on stochastic processes. Ann. Math. Statist. , 23 (2): 193--212
work page 1952
-
[3]
Chifman, J. and Kubatko, L. 2014. Quartet inference from snp data under the coalescent. Bioinformatics\/ , 30 (23): 3317--3324
work page 2014
-
[4]
Degnan, J. 2018. Modeling hybridization under the network multispecies coalescent. Syst. Biol. , 67 (5): 786--799
work page 2018
-
[5]
Heled, J. and Drummond, A. 2010. Bayesian inference of species trees from multilocus data. Mol. Biol. and Evol. , 27 (3): 570--580
work page 2010
-
[6]
Hudson, R. 2002. Generating samples under a wright-fisher neutral model of genetic variation. Bioinformatics\/ , 18 (2): 337--338
work page 2002
-
[7]
Liu, L. 2008. BEST : B ayesian estimation of species trees under the coalescent model. Bioinformatics\/ , 24 (21): 2542--3
work page 2008
- [8]
Show all 17 references
-
[9]
Maddison, W. P. and Maddison, D. 2018. Mesquite: A modular system for evolutionary analysis
2018
-
[10]
Mallo, D., De Oliveira Martins, L., and Posada, D. 2016. SimPhy : Phylogenomic simulation of gene, locus, and species trees. Syst. Biol. , 65 (2): 334--344
2016
-
[11]
and Nei, M
Pamilo, P. and Nei, M. 1988. Relationships between gene trees and species trees. Mol. Biol. and Evol. , 5 : 568--583
1988
-
[12]
Than, C., Ruths, D., and Nakhleh, L. 2008. PhyloNet : A software package for analyzing and reconstructing reticulate evolutionary histories. BMC Bioinformatics\/ , 9 : 322
2008
-
[13]
and Warnow, T
Vachaspati, P. and Warnow, T. 2015. ASTRID : Accurate species trees from internode distances. BMC Genomics\/ , 16 (Suppl 10): S3
2015
-
[14]
Zhang, C., Rabiee, M., Sayyari, E., and Mirarab, S. 2018. ASTRAL-III : P olynomial time species tree reconstruction from partially resolved gene trees. BMC Bioinformatics\/ , 19 (Suppl 6): 153
2018
-
[15]
Zhu, S., Degnan, J., Goldstien, S., and Eldon, B. 2015. H ybrid- L ambda: Simulation of multiple merger and K ingman gene genealogies in species networks and species trees. BMC Bioinformatics\/ , 16 (1): 292
2015
-
[16]
, " * write output.state after.block = add.period write newline
ENTRY address author booktitle chapter edition editor howpublished institution journal key month note number organization pages publisher school series title type volume year label extra.label sort.label INTEGERS output.state before.all mid.sentence after.sentence after.block ...
-
[17]
write newline
" write newline "" before.all 'output.state := FUNCTION n.dashify 't := "" t empty not t #1 #1 substring "-" = t #1 #2 substring "--" = not "--" * t #2 global.max substring 't := t #1 #1 substring "-" = "-" * t #2 global.max substring 't := while if t #1 #1 substring * t #2 gl...
Reviewed August 14, 2026 · model on record in the stance chip above.
Discussion (0). Continue with ORCID to comment.