REVIEW 4 major objections 4 minor 19 references
Galaxy evolution and radiative properties in the early Universe: multi-wavelength analysis in cosmological simulations
T0 review · 4 major / 4 minor · reviewed 2026-08-14 · deepseek-v4-flash
Pith's one-line read This paper argues that the first galaxies cycle between UV-bright and dusty infrared-bright phases on roughly 100-million-year timescales, so each ALMA or JWST snapshot catches a different stage of the same starburst–outflow cycle.
desk verdict A competent proceedings summary of the authors' own simulation program, with one genuinely new line-ratio trend but the central phase-cycling picture resting on two rare halos and no sample-variance analysis. read the letter →
The pith
A machine-rendered reading of the paper's core claim, the machinery that carries it, and where it could break.
The reading
What carries the argument
The central mechanism is the star formation–supernova feedback cycle acting on dust: a starburst is quenched when supernovae eject gas and dust, clearing escape routes for UV and ionizing photons, after which gas re-accretes on roughly a free-fall timescale and the next burst is shrouded in dusty gas. The calculations combine the Gadget-3 SPH code with OWLS and FiBY sub-grid models, and the Art2 radiative-transfer code, which propagates photon packets on adaptive refinement grids that follow the simulated gas down to physical scales of a few parsecs. Dust mass in each cell is set proportional to gas metallicity, and the hydrogen ionization structure from the radiative transfer drives [O III] 88 $\mu$m and [C II] 158 $\mu$m luminosities through ionization equilibrium and level-population rate equations.
What would settle it
Measure rest-UV and sub-mm fluxes for a sample of $z>7$ galaxies with JWST and ALMA: the model predicts an anti-correlation between UV brightness and sub-mm brightness across the population, because galaxies cycle between dust-cleared UV-bright phases and dusty sub-mm-bright phases on ~100 Myr timescales; a population that is largely bright in both bands simultaneously would falsify the phase-cycling picture.
Extended reading notes
Core claim
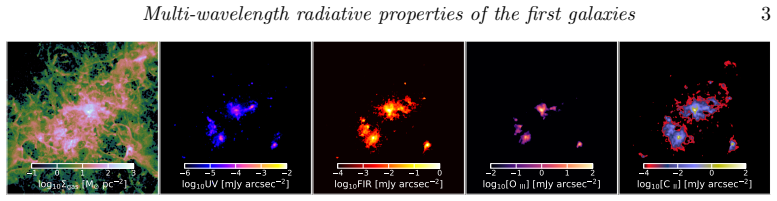
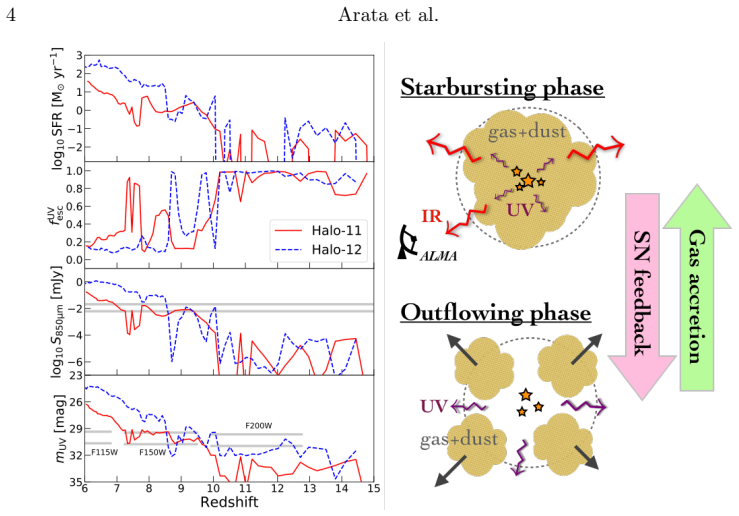
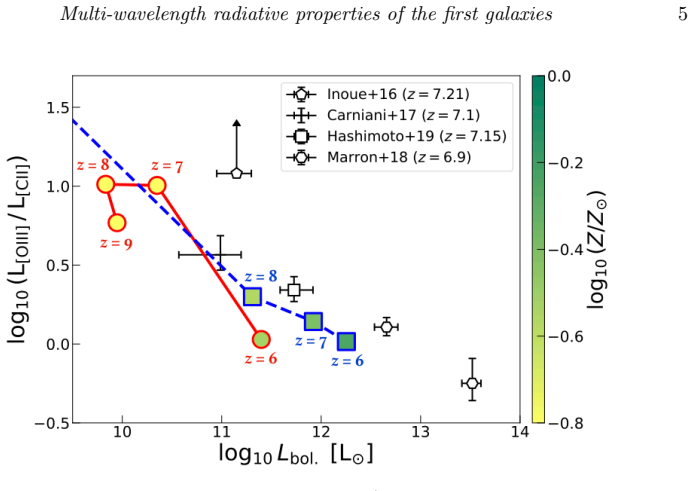
The central claim is that intermittent star formation, regulated by supernova feedback, controls the radiative properties of the first galaxies. In a starbursting phase, dusty gas covers the star-forming regions, absorbing UV photons and re-emitting them in the infrared, so the galaxy appears bright in observed-frame sub-millimeter wavelengths; when supernova feedback ejects the gas and dust, UV photons escape and the galaxy turns UV-bright. The simulations find the SED peak shifts between these two states on a timescale of about 100 Myr, comparable to the halo free-fall time, and that the escape fraction of ionizing photons varies between 1 and 40 percent at $z>10$. Metal-line luminosities follow the same cycle: [O III] 88 $\mu$m is bright only in starbursting phases, reaching $10^{42}$–$10^{43}\,{\rm erg\,s^{-1}}$ for halos of $\sim 10^{11}$–$10^{12}\,{\rm M}_\odot$, while [C II] 158 $\mu$m persists in neutral gas, and the ratio $L_{\rm [O\,III]}/L_{\rm [C\,II]}$ drops by about an order of magnitude as metal enrichment proceeds. The mass fraction of H II regions changes with star formation history, so metal-line and Lyman-$\alpha$ luminosities fluctuate as well.
Load-bearing premise
The quantitative predictions rest on two zoom-in halos, the most massive halos in a 20 and a 100 comoving Mpc/h box at $z=6$, and the paper does not test how representative these two systems are of the full $z=6$–$15$ galaxy population.
Editorial extensions
If this is right
- If the SED does cycle on $\sim 100\,{\rm Myr}$, then a galaxy observed at two epochs separated by about 100 Myr should flip between UV-bright and sub-mm-bright appearances, and surveys should see an anti-correlation between UV and sub-mm brightness in a coeval sample.
- [O III] 88 $\mu$m acts as a starburst-phase indicator, while [C II] 158 $\mu$m traces neutral gas even during outflow phases, so the line ratio $L_{\rm [O\,III]}/L_{\rm [C\,II]}$ reveals both the evolutionary phase and the metal content of a $z>7$ galaxy.
- Deep ALMA observations reaching $\sim 10^{-4}\,{\rm mJy\,arcsec^{-2}}$ should detect extended [C II] emission tracing neutral gas out to roughly 20 physical kpc around luminous high-z halos.
- A future sub-mm survey with sensitivity $\gtrsim 10^{-2}\,{\rm mJy}$ should find a number density of about $10^{-2}\,{\rm cMpc^{-3}}$ for these sources at $z\sim6$–$7$.
- Combined ALMA and JWST observations can separate starbursting from outflowing phases, making the multi-phase ISM structure of reionization-era galaxies observable.
Reading between the lines
- The phase-cycling picture implies that much of the observed scatter in UV-to-IR flux ratios at fixed stellar mass among high-z galaxies could be temporal phase diversity rather than galaxy-to-galaxy variation in dust content; this is an extension the paper does not state.
- If escape fractions swing between 1 and 40 percent on 100 Myr timescales, global reionization models that assume a constant escape fraction per galaxy may need to use a time-averaged value, which could change the inferred ionizing photon budget; this is an editorial inference.
- The predicted ~1.4 arcsec spatial offset between UV and FIR brightness peaks within one simulated clumpy galaxy suggests that high-resolution ALMA/JWST imaging of individual $z\sim6$ sources could catch the two phases spatially separated; the paper presents the offset as an image property but does not develop it as a test.
- The metal-enrichment explanation of the $L_{\rm [O\,III]}/L_{\rm [C\,II]}$ decline could be turned into a rough metallicity indicator for $z>7$ galaxies, since the simulated ratio drops about an order of magnitude from sub-solar to solar metallicity; the paper stops short of proposing this application.
Signed reviews
Editorial analysis
A structured set of objections, weighed in public.
Referee Report
Summary. The paper uses cosmological SPH zoom-in simulations of two massive halos (Halo-11 and Halo-12) together with multi-wavelength radiative transfer (Art2) to predict UV/IR SEDs, escape fractions, sub-mm fluxes, and [O III]/[C II] line luminosities for z=6-15 galaxies. The central claim is that supernova feedback and gas accretion drive intermittent star formation that cycles galaxies between UV-bright and IR-bright phases on a ~100 Myr timescale, with the escape fraction of ionizing photons varying between 1 and 40% at z>10. The paper presents maps and light curves showing spatial offsets between UV and FIR peaks, compares predicted line luminosities to ALMA observations, and makes forecast-type statements including a >50% sub-mm observability for massive satellites, a sub-mm source number density of 10^-2 cMpc^-3, and extended [C II] emission over ~20 kpc.
Significance. If the phase-cycling picture is correct, it would substantially change the interpretation of high-z galaxies: rest-UV-selected and sub-mm-selected samples would trace different evolutionary phases of the same population, and the escape fraction would be a strongly time-dependent quantity for reionization modeling. The paper's strengths are that it uses established simulation machinery (Gadget-3 with OWLS/FiBY subgrid models and the Art2 radiative transfer code) and that its predictions are falsifiable in form: the 100 Myr SED shift, the 1-40% ionizing escape fraction, the sub-mm source density, and the decreasing L[O III]/L[C II] ratio with bolometric luminosity can all be checked against future JWST/ALMA data. However, the evidence base is narrow: all population-level results rest on only two zoom-in halos, model details are deferred to companion papers, and the comparison with observations is qualitative. The paper would be much more convincing with a resolution-convergence test, a sample-variance estimate, and a reconciliation of the abstract's ionizing escape-fraction range with the UV escape-fraction range stated in Section 3.
major comments (4)
- [Table 1; §3] The population-level statements in §3 (satellite observability exceeding 50%, sub-mm source density 10^-2 cMpc^-3, the ~100 Myr UV/IR cycling timescale, and the escape-fraction range) are all derived from only two zoom-in halos, Halo-11 and Halo-12, which are selected as the most massive halos in their respective boxes and whose dark-matter particle masses differ by a factor of about 17 (m_DM = 6.6e4 versus 1.1e6 h^-1 M_sun). No convergence test and no sample-variance estimate are presented, so the reader cannot assess whether these halos are representative of the z=6-15 galaxy population or are high-sigma outliers. The authors should add a resolution study and at least a small ensemble of independent halos, or explicitly reframe the claims as case studies rather than population predictions.
- [Abstract vs §3] The abstract's central quantitative claim is that the escape fraction of ionizing photons changes between 1 and 40% at z>10, while §3 reports f_esc = 0.2-0.8 at z<10 for ultraviolet photons. The paper does not state whether these are the same quantity evaluated at different redshifts or whether they refer to different definitions, and this ambiguity prevents verification of the headline number. A plot of the ionizing-photon escape fraction versus redshift for both halos, with starburst and outflow phases marked, should be added, and the abstract should be reconciled with the body of the paper.
- [§2] The essential modeling choices that control the SED and line predictions are not specified in this manuscript: the subgrid star formation and feedback parameters are referred to Yajima et al. (2017), the dust and RT details to Arata et al. (2019), and the [O III]/[C II] line calculation to Arata et al. (in prep.). In particular, the dust mass is set proportional to gas metallicity with an assumed dust temperature, and the metal-line calculation assumes photoionization equilibrium under the stellar radiation field; these choices directly set the IR/sub-mm fluxes and line luminosities. The authors should either summarize the key parameters (dust-to-metal ratio, assumed dust temperature, treatment of the radiation field) in the text or provide a stable reference to a published methods paper, since the comparison with observations in §4 cannot otherwise be evaluated.
- [§3, Figure 2] The 100 Myr timescale for the UV/IR phase transition is read off Figure 2 and equated to the halo free-fall time, but the SFR and escape-fraction light curves are visibly bursty and only two realizations are shown. With n=2, the apparent period could be a stochastic property of the adopted SN-feedback prescription rather than a robust duty cycle. The period should be quantified (for example, by computing the autocorrelation function of the SFR or f_esc time series) and checked for convergence with numerical resolution, or the claim should be softened to a description of the two simulated cases.
minor comments (4)
- [§1] There are typographical errors in names and references: 'Riechars et al. 2013' should be 'Riechers et al. 2013', 'Marron et al. 2018' should be 'Marrone et al. 2018', and 'Decalri' in the reference list should be 'Decarli'.
- [Author list] The author name 'Yuexing Li' appears as 'Y uexing Li' in the article header; this should be corrected.
- [Figure 3] The observational points in Figure 3 are shown as open symbols without error bars, and the text notes that they 'may shift to higher SFR because actual dust temperature might be higher than the assumed one.' A quantitative estimate of this shift would make the claimed agreement more informative.
- [§2] The sentence 'We focus on how the RT results depend on the dust distribution' is not followed by a test of different dust distributions; the paper presents only one dust model. The authors should either add such a comparison or revise the sentence to describe what is actually shown.
Circularity Check
No circular derivation: the predicted SED transitions, escape fractions, and line luminosities are simulation outputs compared qualitatively with observations; minor self-citations are for model details, not load-bearing.
full rationale
The central claims are outputs of the coupled SPH+radiative-transfer calculation, not quantities fitted to the observational comparisons. Figures 3 and 4 compare simulated [O III] and [C II] luminosities with observed points, but no parameter is adjusted to those data; the dust mass is set by a metallicity-proportional prescription and the line luminosities follow from photoionization equilibrium and level-population rate equations. The 100 Myr variability and fesc=1-40% are read off the simulated light curves, not imposed by the targets. The self-citations to Yajima et al. (2017) and Arata et al. (2019) provide the subgrid and RT details; these are prior companion works rather than a chain importing the present conclusion. Section 2 explicitly defers model details to 'Arata et al. (in prep.)', a transparency/reproducibility limitation but not a circular step. The two-halo zoom-in sample is a sample-variance concern, and the abstract's fesc range at z>10 differs from the z<10 fesc quoted in Sec. 3, but neither constitutes a reduction of a prediction to its inputs by construction.
Assumptions & free parameters
free parameters (3)
- Subgrid star formation and feedback parameters
- Dust-to-gas ratio
- Assumed dust temperature
assumptions (4)
- domain assumption Subgrid recipes calibrated in OWLS and FiBY at lower redshift remain valid for low-metallicity, z=6-15 galaxies.
- domain assumption Dust can be treated as a passive tracer proportional to gas metallicity, without separate formation or destruction timescales.
- domain assumption C+ and O2+ abundances follow photoionization equilibrium under the local stellar radiation field.
- ad hoc to paper Two zoom-in halos are sufficient to represent the z=6-15 galaxy population.
Cite this review
Pith. "Pith review of Galaxy evolution and radiative properties in the early Universe: multi-wavelength analysis in cosmological simulations." pith.science (2026). https://pith.science/paper/KK5KCWO3
@misc{pith2026190801438,
  author       = {Pith},
  title        = {Pith review of: Galaxy evolution and radiative properties in the early Universe: multi-wavelength analysis in cosmological simulations},
  year         = {2026},
  howpublished = {\url{https://pith.science/paper/KK5KCWO3}},
  note         = {Machine review of arXiv:1908.01438}
}
abstract
Recent observations have successfully detected UV or infrared flux from galaxies at the epoch of reionization. However, the origin of their radiative properties has not been fully understood yet. Combining cosmological hydrodynamic simulations and radiative transfer calculations, we present theoretical predictions of multi-wavelength radiative properties of the first galaxies at z=6-15. We find that most of the gas and dust are ejected from star-forming regions due to supernova (SN) feedback, which allows UV photons to escape. We show that the peak of SED rapidly shifts between UV and infrared wavelengths on a timescale of 100 Myr due to intermittent star formation and feedback. When dusty gas covers the star-forming regions, the galaxies become bright in the observed-frame sub-millimeter wavelengths. In addition, we find that the escape fraction of ionizing photons also changes between 1-40% at z>10. The mass fraction of HII region changes with the star formation history, resulting in the fluctuations of metal lines and Lyman-alpha line luminosities. In the starbursting phase of galaxies with the halo mass $\sim 10^{11}\,{\rm M_{\odot}}$ ($10^{12}\,{\rm M_{\odot}}$), the simulated galaxy has $L_{\rm [O\,III]} \sim 10^{42}\, (10^{43})\, {\rm erg\,s^{-1}}$, which is consistent with the observed star-forming galaxies at z>7. Our simulations suggest that deep [C II] observation with ALMA can trace the distribution of neutral gas extending over $\sim 20$ physical kpc. We also find that the luminosity ratio $L_{\rm [O\,III]}/L_{\rm [C\,II]}$ decreases with bolometric luminosity due to metal enrichment. Our simulations show that the combination of multi-wavelength observations by ALMA and JWST will be able to reveal the multi-phase ISM structure and the transition from starbursting to outflowing phases of high-z galaxies.
Figures

Figures from the paper (1 more)
Reference graph
Works this paper leans on
-
[1]
Arata S., Yajima H., Nagamine K. et al. 2019, MNRAS, 488, 2629
work page 2019
-
[2]
Bouwens R. J., Illingworth G. D., Oesch P. A et al. 2015, ApJ, 803, 34
work page 2015
-
[3]
Carniani, S., Maiolino, R., Pallottini, A. et al. 2017, A&A, 605, A42
work page 2017
-
[4]
Fujimoto, S., Ouchi, M., Ferrara, A. et al. 2019, arXiv e-prints, arXiv:1902.06760
work page Pith review arXiv 2019
-
[5]
Hashimoto T., Laporte N., Mawatari K. et al. 2018, Nature, 557, 392
work page 2018
-
[6]
Hashimoto T., Inoue A., Mawatari K. et al. 2019, PASJ, 70, preprint (arXiv:1806.00486)
arXiv 2019
-
[7]
Inoue A. K., Tamura Y., Matsuo H. et al. 2016, Science, 352, 1559
work page 2016
-
[8]
L., Dalla Vecchia C., & Khochfar S
Johnson J. L., Dalla Vecchia C., & Khochfar S. 2013, MNRAS, 428, 1857
work page 2013
Show all 19 references
-
[9]
Kimm T. & Cen R. 2014, ApJ, 88, 121
2014
-
[10]
S., Boone F
Laporte N., Ellis R. S., Boone F. et al. 2008, ApJ, 837, L21
2008
-
[11]
F., Hernquist L
Li Y., Hopkins P. F., Hernquist L. et al. 2008, ApJ, 678, 41
2008
-
[12]
C., Casey C
Ma X., Hayward C. C., Casey C. M. et al. 2019, MNRAS, 487, 1844
2019
-
[13]
P., Spilker J
Marrone D. P., Spilker J. S., Hayward C. C. et al. 2018, Nature, 553, 51
2018
-
[14]
A., Bradford C
Riechers D. A., Bradford C. M., Clements D. L. et al. 2013, Nature, 496, 329
2013
-
[15]
Schaye J., Dalla Vecchia C., Booth C. M. et al. 2010, MNRAS, 402, 1536
2010
-
[16]
Tamura Y., Mawatari K., Hashimoto T. et al. 2019, ApJ, 874, 27
2019
-
[17]
Watson D., Christensen L., Knudsen K. K. et al. 2015, Nature, 519, 327
2015
-
[18]
& Abel T
Yajima H., Li Y., Zhu Q. & Abel T. 2008, MNRAS, 424, 884
2008
-
[19]
Yajima H., Nagamine K., Zhu Q. et al. 2017, ApJ, 846, 30
2017
Reviewed August 14, 2026 · model on record in the stance chip above.
Discussion (0). Continue with ORCID to comment.