REVIEW 3 major objections 5 minor 1 cited by
ALMA resolves the hourglass magnetic field in G31.41+0.31
T0 review · 3 major / 5 minor · reviewed 2026-08-14 · deepseek-v4-flash
Pith's one-line read The magnetic field in G31.41+0.31 stays hourglass-shaped down to below 1000 au.
desk verdict Solid high-resolution confirmation of G31's hourglass field with a plausible model fit; the DCF-based field strength is the fragile part, but the supercritical conclusion is probably secure. read the letter →
The pith
A machine-rendered reading of the paper's core claim, the machinery that carries it, and where it could break.
The reading
What carries the argument
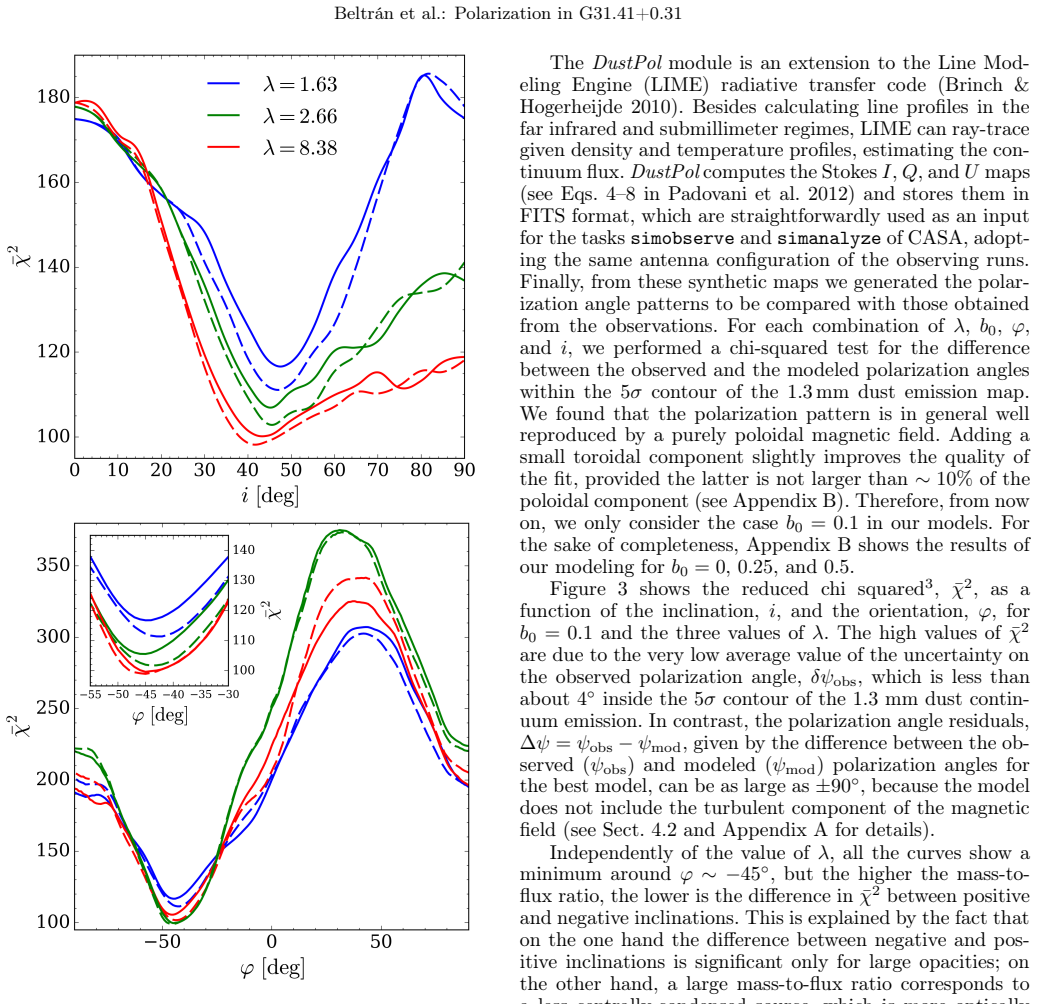
The load-bearing elements are the rotated polarization segments that trace the magnetic field direction, and the semi-analytical magnetostatic model of a singular isothermal toroid threaded by a poloidal field, extended with a toroidal component that changes sign across the midplane. The model is ray-traced through a radiative transfer code to synthesize Stokes maps, which are compared to the observed polarization angles with a chi-squared fit over four parameters: mass-to-flux ratio, toroidal-to-poloidal ratio, axis orientation, and inclination. Field strength is then estimated with the standard dispersion method that relates the scatter of polarization angle residuals and the line-of-sight velocity dispersion to the plane-of-sky field intensity. The model fit is what lets the paper separate the regular field geometry from the turbulent perturbations and assign the inclination angle needed to convert the projected field to a total field.
What would settle it
One decisive test would be to measure the polarization of the same core at a longer wavelength where scattering is far weaker, such as 3 mm, with comparable resolution; if the polarization pattern rotated by about 90 degrees or changed morphology, the magnetic-alignment assumption would be falsified. Another check would be to recompute the mass-to-flux ratio with a much lower kinematic distance or lower core mass: if the value dropped below 1, the paper's conclusion that the core is supercritical would collapse.
Extended reading notes
Core claim
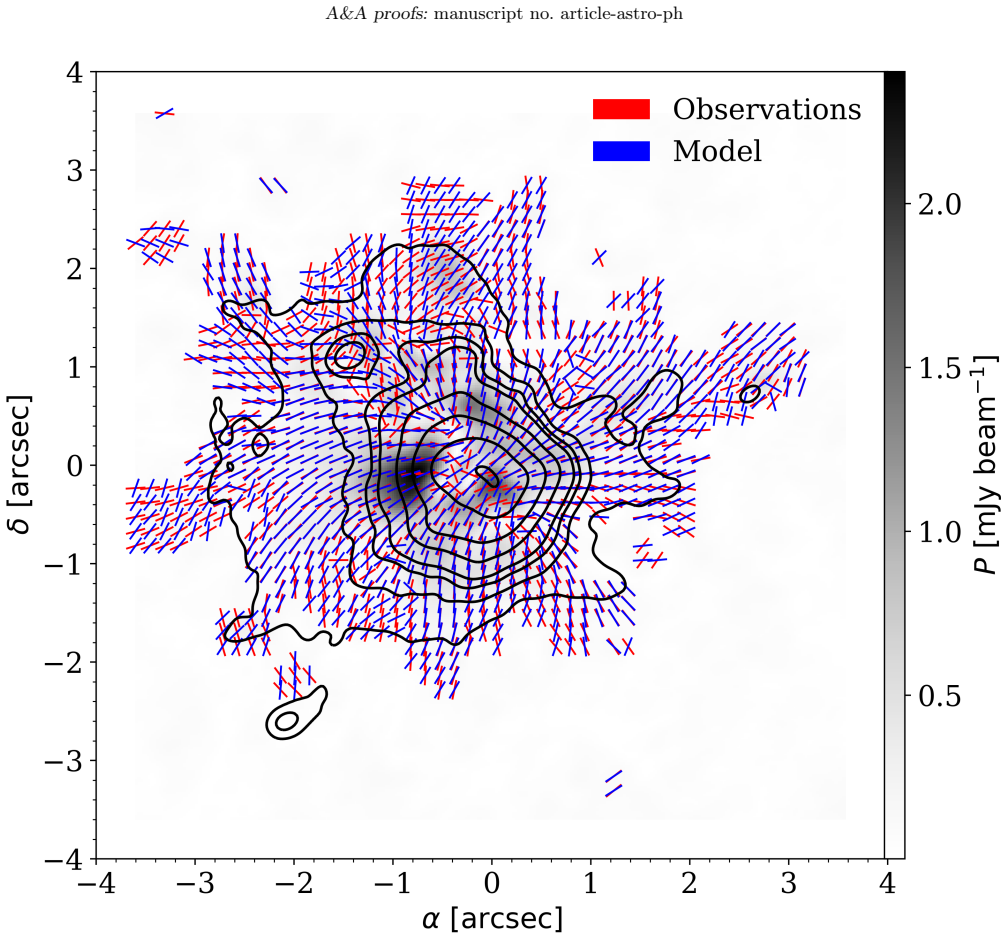
At the resolution of the new 1.3 mm observations, the polarization pattern of the Main core of G31.41+0.31 is consistent with the hourglass field inferred at 870 microns, and the pattern is well fitted by a semi-analytical magnetostatic model of an axially symmetric toroid threaded by a poloidal magnetic field. The best fit gives a toroidal component of at most about 10 percent of the poloidal field, an axis oriented southeast-northwest at about −44 degrees, and an inclination of about −45 degrees to the plane of the sky. The magnetic axis is almost perpendicular to the northeast-southwest velocity gradient measured on scales of $10^{3}$ to $10^{4}$ au, which the paper takes as support for the rotation interpretation of the gradient. The dispersion of the polarization angle residuals yields a field strength of roughly 8 to 13 mG on the plane of the sky, corresponding through the mass and flux estimates to a mass-to-flux ratio in the range 1.4 to 2.2. The paper concludes that the field is dynamically significant but leaves the core slightly supercritical, so fragmentation and infall proceed.
Load-bearing premise
The inference that the polarization traces the magnetic field via magnetically aligned dust grains, so that rotating the polarization segments by 90 degrees reveals the field direction, is load-bearing; if scattering dominated at 1.3 mm the hourglass morphology and strength estimate would not follow.
Editorial extensions
If this is right
- The hourglass geometry extends below 1000 au, implying magnetic regulation persists deep inside a high-mass core collapse.
- The near-perpendicular magnetic axis to the velocity gradient indicates the gradient is rotation and the field is roughly parallel to the rotation axis.
- The small toroidal component of at most about 10 percent implies either a very young core (rotation has not had time to wind the field) or a partial decoupling of gas and field.
- The supercritical mass-to-flux ratio of 1.4–2.2 explains why at least four embedded sources have already formed despite a strong 10 mG class field.
- The comparable energies of the turbulent and uniform field components mean that turbulence is not negligible even in a magnetically regulated core.
Reading between the lines
- Should the magnetic-alignment interpretation hold, the toroidal-to-poloidal ratio could serve as a clock for the age of a collapsing core, since the model predicts that rotation winds a purely poloidal field to a ratio of order unity within about 10^4 yr.
- The same modeling machinery could be applied to other massive toroids; a survey would tell whether the near-perpendicular rotation-field alignment and the slight supercritical ratio seen in G31.41+0.31 are common or exceptional.
- Even higher resolution observations, below 100 au, could test the prediction that each embedded protostar distorts the local field orientation, potentially forming small-scale polarized features around individual sources.
- If the small toroidal component is really a sign of youth, one would expect the outflows and the embedded sources in this core to be in an early accretion phase; this is testable with follow-up line observations.
Editorial analysis
A structured set of objections, weighed in public.
Referee Report
Summary. The paper presents ALMA Band 6 (1.3 mm) full-polarization observations of the hot molecular core G31.41+0.31 at approximately 0.2 arcsecond resolution, corresponding to about 875 au at the adopted 3.7 kpc distance. The observations detect polarized dust continuum emission that is interpreted, under the standard assumption of magnetically aligned grains, as tracing the magnetic field. The paper confirms an hourglass-shaped magnetic field morphology down to scales below 1000 au, consistent with earlier SMA 870 micron observations. The authors fit the polarization pattern in the Main core with a semi-analytic magnetostatic toroid model using the DustPol/ARTIST package, finding a best-fit model with mass-to-flux ratio lambda = 2.66, toroidal-to-poloidal field ratio b0 = 0.1, magnetic axis position angle phi = -44 degrees, and inclination i = -45 degrees. Using the Davis-Chandrasekhar-Fermi method on the residuals between the observed and model polarization angles, they estimate a magnetic field strength of 8-13 mG and a mass-to-flux ratio of lambda = 1.4-2.2, concluding that the core is slightly supercritical and that the field, while dynamically important, does not prevent fragmentation. They also find that the magnetic field is oriented nearly perpendicular to the NE-SW velocity gradient, supporting the rotation interpretation of that gradient.
Significance. If the quantitative results hold, the paper provides one of the clearest resolved examples of an hourglass magnetic field in a high-mass star-forming core at sub-1000 au scales, and it strengthens the case that magnetic fields are dynamically important but not decisive in massive core collapse. The direct imaging of the morphology and the agreement with the earlier SMA observations are valuable, and the model comparison to a magnetostatic toroid is a useful step beyond simple morphology description. However, the central quantitative claims of field strength and mass-to-flux ratio rest on a Davis-Chandrasekhar-Fermi analysis whose input dispersion is measured from residuals about a best-fit model that was itself tuned to minimize those residuals, with additional post-hoc clipping and no propagated uncertainties. The direction of the resulting bias is likely conservative for the supercritical conclusion, but the stated precision of B = 8-13 mG and lambda = 1.4-2.2 is not supported by the analysis as presented.
major comments (3)
- [Sec. 4.2, Eq. (2)] The DCF dispersion sigma_psi is measured from residuals between the observed and best-fit model polarization angles, but the model parameters (lambda = 2.66, b0 = 0.1, i = -45 deg, phi = -44 deg) were chosen in Sec. 4.1 by minimizing the chi-squared of exactly those residuals. The model therefore absorbs part of the observed angular variance, biasing sigma_psi low, B high, and lambda low. Because the central quantitative claim (lambda = 1.4-2.2, slightly supercritical) is derived from this B, this circularity is load-bearing. The authors should quantify the bias, for example by computing the dispersion about an independent mean-field model (such as a uniform field or the lower-resolution SMA field) or by marginalizing over the model parameters, and should report the resulting systematic uncertainty on B and lambda.
- [Sec. 4.2, Fig. 6] The choice to clip the residual distribution to |Delta psi| <= 45 deg changes sigma_psi from 27.6 deg to 17.3 deg, and the quoted ranges B = 8-13 mG and lambda = 1.4-2.2 simply bracket these two choices. The clipping is motivated by visual inspection of Fig. 7 and by the presence of embedded sources and outflows, but no objective criterion is given and no uncertainty is attached to the clipping threshold. Since lambda is inversely proportional to B, the lower end of the quoted lambda range depends entirely on this post-hoc cut. The paper should propagate uncertainties in sigma_los, density, distance, and the correction factor xi, and should test the sensitivity of B and lambda to the clipping threshold.
- [Sec. 4.2, Eq. (3)] The ratio delta B/B ~ 0.7-1.0 is presented as the ratio of turbulent to uniform magnetic energy, but the residual dispersion that enters Eq. (3) includes systematic departures from the model that the authors themselves identify as non-turbulent: the NE core, the outflow cavities, and the central embedded sources. These are not Alfvenic fluctuations, so the interpretation of delta B/B as a turbulent-to-total field ratio is not well supported. The authors should either exclude those regions with a stated, objective criterion before computing the dispersion, or explicitly qualify delta B/B as a measure of total model deviation rather than turbulence.
minor comments (5)
- [Abstract] There is a typo in the abstract: 'G31.41+0.41is' should read 'G31.41+0.31 is'.
- [Sec. 1 and Sec. 4.2] Several load-bearing inputs are cited as unpublished work ('Reid et al., in prep' for the distance and 'Beltran et al., in prep' for the embedded sources). The distance enters the density, B, and lambda estimates, so the authors should update these references or provide the relevant values in the present paper.
- [Sec. 5.2] The statement that the chi-squared function is maximum at about 40 deg should specify that this refers to the reduced chi-squared in the lower panel of Fig. 3, and it would be helpful to state explicitly that this direction corresponds to the orientation of the velocity gradient, not the magnetic axis.
- [Sec. 4.1] The reduced chi-squared values are high because of the very small quoted angle uncertainties, but the text does not give the actual numerical value of the minimum reduced chi-squared for the best-fit model. Reporting the minimum value and the number of data points would help the reader judge the quality of the fit.
- [Sec. 3.1] The estimate that at least 40% of the Stokes I flux is contaminated by line emission is important because it makes the polarization fraction a lower limit; the authors state this, but the implications for the polarization fraction map and for the comparison with the model could be stated more explicitly.
Circularity Check
No significant circularity; morphological and quantitative claims rest on independent data and standard methods.
full rationale
The paper's central morphological result—the hourglass B-field morphology persisting down to <1000 au and oriented perpendicular to the NE–SW velocity gradient—is directly visible in the ALMA polarization maps and is consistent with the earlier SMA 870 μm observations, so it does not depend on the model fit. The quantitative B and λ estimates use the standard Davis–Chandrasekhar–Fermi method applied to the residuals from the best-fit magnetostatic model. Although the model parameters were obtained by minimizing polarization-angle residuals, the model has only three continuous parameters (b0, i, ϕ) plus a discrete λ choice and contains no turbulent degrees of freedom; the residuals therefore are not absorbed by construction and remain a measure of the turbulent component, as the paper itself states ('the model does not include the turbulent component of the magnetic field'). The two quoted σψ values (27.6° and 17.3°) are transparently presented from the full and clipped residual histograms, and the derived λ=1.4–2.2 is not forced to equal the model's λ=2.66; it is computed from the DCF field strength, an independent mass estimate, and the magnetic flux. Self-citations to BEL18, GIR09, and Padovani et al. provide external observational inputs or published model tools, not a load-bearing uniqueness argument. No equation in the paper reduces to its own input by definition, and the main claims are self-contained against the direct polarization maps.
Assumptions & free parameters
free parameters (5)
- lambda (mass-to-flux ratio) =
2.66 (best of 1.63, 2.66, 8.38)
- b0 (toroidal-to-poloidal field ratio) =
0.1
- phi (position angle of magnetic axis) =
-44 deg (+6/-4)
- i (inclination to plane of sky) =
-45 deg (+3/-4)
- Effective sound speed =
1.4 km/s
assumptions (6)
- domain assumption Dust polarization traces the magnetic field via magnetically aligned grains.
- ad hoc to paper The Main core is an axisymmetric singular isothermal toroid threaded by a poloidal magnetic field, with a force-free toroidal component modified to mimic rotation.
- domain assumption The distance to G31 is 3.7 kpc.
- domain assumption The temperature profile from BEL18 is correct.
- domain assumption Davis-Chandrasekhar-Fermi assumptions: angle perturbations are due to Alfven waves with deltaB_los = sqrt(4 pi rho) sigma_los, and the correction factor xi = 0.5.
- domain assumption The CH3CN line width (Delta V = 5 km/s) is dominated by turbulence, not rotation or thermal broadening.
Cite this review
Pith. "Pith review of ALMA resolves the hourglass magnetic field in G31.41+0.31." pith.science (2026). https://pith.science/paper/IVL54PL6
@misc{pith2026190801597,
  author       = {Pith},
  title        = {Pith review of: ALMA resolves the hourglass magnetic field in G31.41+0.31},
  year         = {2026},
  howpublished = {\url{https://pith.science/paper/IVL54PL6}},
  note         = {Machine review of arXiv:1908.01597}
}
read the original abstract
Context. Submillimeter Array (SMA) 870 micron polarization observations of the hot molecular core G31.41+0.31 revealed one of the clearest examples up to date of an hourglass-shaped magnetic field morphology in a high-mass star-forming region. Aims. To better establish the role that the magnetic field plays in the collapse of G31.41+0.31, we carried out Atacama Large Millimeter/submillimeter Array (ALMA) observations of the polarized dust continuum emission at 1.3 mm with an angular resolution four times higher than that of the previous (sub)millimeter observations to achieve an unprecedented image of the magnetic field morphology. Methods. We used ALMA to perform full polarization observations at 233 GHz (Band 6). The resulting synthesized beam is 0.28"x0"20 which, at the distance of the source, corresponds to a spatial resolution of ~875 au. Results. The observations resolve the structure of the magnetic field in G31.41+0.31 and allow us to study the field in detail. The polarized emission in the Main core of G31.41+0.41is successfully fit with a semi-analytical magnetostatic model of a toroid supported by magnetic fields. The best fit model suggests that the magnetic field is well represented by a poloidal field with a possible contribution of a toroidal component of ~10% of the poloidal component, oriented southeast to northwest at ~ -44 deg and with an inclination of ~-45 degr. The magnetic field is oriented perpendicular to the northeast to southwest velocity gradient detected in this core on scales from 1E3-1E4 au. This supports the hypothesis that the velocity gradient is due to rotation and suggests that such a rotation has little effect on the magnetic field. The strength of the magnetic field estimated in the central region of the core with the Davis-Chandrasekhar-Fermi method is ~8-13 mG and implies that the mass-to-flux ratio in this region is slightly supercritical ...
Figures


Figures from the paper (5 more)


Forward citations
Cited by 1 Pith paper
-
ALMA observations of Magnetic Fields in the Massive Star-forming Region IRAS 18360-0537
An ordered hourglass B-field in IRAS 18360-0537 lies perpendicular to the outflow/rotation axis and is reshaped by rotation, outflow cavity walls, and accretion rather than pure magnetic regulation.
Reference graph
Works this paper leans on
-
[1]
Alves, F. O., Girart, J. M., Padovani, M., Galli, D. et al. 2018, A&A, 616, A56
work page 2018
-
[2]
Andersson, B.-G., Lazarian, A., & Vaillancourt, J. E. 2015, ARA&A, 53, 501
work page 2015
-
[3]
Araya, E., Hofner, P., Kurtz, S., Olmi, L., & Linz, H. 2008, ApJ, 675, 420
work page 2008
-
[4]
Bacciotti, F., Girart, J. M., Padovani, M., Podio, L. et al. 2018, ApJ, 865, L12
work page 2018
-
[5]
Basu, S., & Mouschovias, T. Ch. 1994, ApJ, 432, 720 Beltrán, M. T., Cesaroni, R., Neri, R., Codella, C., Furuya, R. S.,
work page 1994
-
[6]
2004, ApJ, 601, L190 Beltrán, M
Testi, L., & Olmi, O. 2004, ApJ, 601, L190 Beltrán, M. T., Cesaroni, R., Neri, R., Codella, C., Furuya, R. S.,
work page 2004
-
[7]
2005, A&A, 435, 901 Beltrán, M
Testi, L., & Olmi, O. 2005, A&A, 435, 901 Beltrán, M. T., Cesaroni, R., Rivilla, V. M., Sánchez-Monge, Á. et al. 2018, A&A, 615, A141 (BEL18)
work page 2005
- [8]
Show all 67 references
-
[9]
T., Zhang, Q., Beuther, H., & Fallscheer, C
Cesaroni, R., Beltrán, M. T., Zhang, Q., Beuther, H., & Fallscheer, C. 2011, A&A, 533, A73 Article number, page 12 of 13 Beltrán et al.: Polarization in G31.41+0.31 Fig. A.1. Map of the errors on the observed polarization an- gles according to the color-coding shown in the leg...
2011
-
[10]
M., & Kurtz, S
Cesaroni, R., Churchwell, E., hofner, P., Walmsley, C. M., & Kurtz, S. 1994, A&A, 288, 903
1994
-
[11]
2010, A&A, 590, A50
Cesaroni, R., Hofner, P., Araya, E., & Kurtz, S. 2010, A&A, 590, A50
2010
-
[12]
& Fermi, E
Chandrasekhar, S. & Fermi, E. 1953 ApJ, 118, 113
1953
-
[13]
2016, ApJ, 819, 159
Ching, T.-C., Lai, S.-P., Zhang, Q., et al. 2016, ApJ, 819, 159
2016
-
[14]
C., Girart, J
Cortes, P. C., Girart, J. M., Hull, C. L. H., et al. 2016, ApJ, 825, L15
2016
-
[15]
A., Novak, G., Matthews, T
Davidson, J. A., Novak, G., Matthews, T. G., Matthews, B. .et al. 2011, ApJ, 732, 97
2011
-
[16]
A., Li, Z.-Y., Hull, C
Davidson, J. A., Li, Z.-Y., Hull, C. L. H., et al. 2014, ApJ, 797, 74
2014
-
[17]
1951, Phys
Davis, L. 1951, Phys. Rev. 81, 890
1951
-
[18]
Dent, W. R. F., Pinte, C., Cortes, P. C., Ménard, F. et al. 2018, MNRAS, 482, L29
2018
-
[19]
K., & Mayen-Gijon, J
Estalella, R., Anglada, G., Díaz-Rodríguez, A. K., & Mayen-Gijon, J. M. 2019, A&A, accepted
2019
-
[20]
A., & Mouschovias, T
Fiedler, R. A., & Mouschovias, T. Ch. 1993, ApJ, 415, 680
1993
-
[21]
Frau, P., Galli, D., & Girart, J. M. 2011, A&A, 535, 44
2011
-
[22]
M., Zhang, Q., & Rao, R
Frau, P., Girart, J. M., Zhang, Q., & Rao, R. 2014, A&A, 567, A116
2014
-
[23]
M., et al
Galametz, M., Maury, A., Girart, J. M., et al. 2018, A&A, 616, A139
2018
-
[24]
Galli, D., & Shu, F. H. 2006, ApJ, 647, 374
2006
-
[25]
M., Beltrán, M
Girart, J. M., Beltrán, M. T., Zhang, Q., Rao, R., & Estalella, R. 2009, Science, 324, 1408 (GIR09)
2009
-
[26]
M., Crutcher, R
Girart, J. M., Crutcher, R. M., & Rao, R. 1999, ApJ, 525, L109
1999
-
[27]
M., Fernández-López, M., Li, Z.-Y., Yang, H
Girart, J. M., Fernández-López, M., Li, Z.-Y., Yang, H. et al. 2018, ApJ, 856, L27
2018
-
[28]
M., Frau, P., Zhang, Q., et al
Girart, J. M., Frau, P., Zhang, Q., et al. 2013, ApJ, 772, 69
2013
-
[29]
M., Rao, R., & Marrone, D
Girart, J. M., Rao, R., & Marrone, D. P. 2006, Science, 313, 812 Gonçalves, J., Galli, D., & Girart, J. M. 2008, A&A, 490, L39 Hildebrand,R.H.,Kirby,L.,Dotson,J.L.,Houde,M.,&Vaillancourt, J. E. 2009, ApJ, 696, 567
2006
-
[30]
2009, ApJ, 697, 1316
Hoang, T., & Lazarian, A. 2009, ApJ, 697, 1316
2009
-
[31]
M., Tychoniec, L., Rao, R
Hull, C., Girart, J. M., Tychoniec, L., Rao, R. et al. 2017, ApJ, 847, 92
2017
-
[32]
Hull, C. L. H., Mocz, P., Burkhart, B., et al. 2017, ApJ, 842, L9
2017
-
[33]
Hull, C. L. H., Plambeck, R. L., Bolatto, A. D., Bower, G. C. et al. 2013, ApJ, 768, 159
2013
-
[34]
Hull, C. L. H., Yang, H., Li, Z.-Y., Kataoka, A. et al. 2018, ApJ, 860, 82
2018
-
[35]
Hull, C. L. H., & Zhang, Q. 2019, Frontiers in Astronomy and Space Sciences, 6, 3 Juárez, C., Girart, J. M., Zamora-Avilés, M., et al. 2017, ApJ, 844, 44 Kataoka A., Muto, T., Momose, M., Tsukagoshi, T. et al. 2015, ApJ, 809, 78
2019
-
[36]
2017, ApJ, 844, L5
Kataoka, A., Tsukagoshi, T., Pohl, A., et al. 2017, ApJ, 844, L5
2017
-
[37]
M., Tang, Y.-W., Ho, P
Koch, P. M., Tang, Y.-W., Ho, P. T. P., et al. 2014, ApJ, 797, 99
2014
- [38]
-
[39]
1976, ApJ, 208, 177
Lampton, M., Margon, B., & Bowyer, S. 1976, ApJ, 208, 177
1976
-
[40]
Li, Z.-Y., & Shu, F. H. 1996, ApJ, 472, 211
1996
-
[41]
D., Goodman, A., Hildebrand, R., Novak, G
Li, H.-b., Dowell, C. D., Goodman, A., Hildebrand, R., Novak, G. 2009, ApJ, 704, 891
2009
-
[42]
H., Otto, F., leung, P
Li, H.-B., Yuen, K. H., Otto, F., leung, P. K. et al. 2015, Nature, 520, 518 Mac Low, M.-M., & Klessen, R. S. 2004, RvMP, 76, 125
2015
-
[43]
J., Girart, J
Maury, A. J., Girart, J. M., Zhang, Q., et al. 2018, MNRAS, 477, 2760
2018
-
[44]
Lizano, S. et al. 2014, MNRAS, 437, 3766
2014
-
[45]
P., Waters, B., Schiebel, D., Young, W., & Golap, K
McMullin, J. P., Waters, B., Schiebel, D., Young, W., & Golap, K. 2007, ASPC, 376, 127
2007
-
[46]
2008, ApJ, 681, 1356
Mellon, R., & Li, Z.-Y. 2008, ApJ, 681, 1356
2008
-
[47]
J., Cesaroni, R., Sanna, A., Xu, Y., & Zhang, Q
Moscadelli, L., Li, J. J., Cesaroni, R., Sanna, A., Xu, Y., & Zhang, Q. 2013, A&A, 549, A122
2013
-
[48]
C., Hoare, M
Mottram, J. C., Hoare, M. G., Davies, B., Lumsden, S. T. et al. 2011, ApJ, 730, L33
2011
-
[49]
Ch., & Ciolek, G
Mouschovias, T. Ch., & Ciolek, G. E. 1999, The Origin of Stars and Planetary Systems, Eds. C. J. Lada & N. D. Kylafis (Kluwer Aca- demic Publishers), ASIC 540,305
1999
-
[50]
2009, ApJ, 694, 29
Osorio, M., Anglada, G., Lizano, S., & D’Alessio, P. 2009, ApJ, 694, 29
2009
-
[51]
1994, A&A, 291, 943
Ossenkopf, V., & Henning, Th. 1994, A&A, 291, 943
1994
-
[52]
C., Stone, J
Ostriker, E. C., Stone, J. M., & Gammie, C. F. 2001, ApJ, 546, 980
2001
-
[53]
& Galli, D., 2011, A&A, 530, A109
Padovani, M. & Galli, D., 2011, A&A, 530, A109
2011
-
[54]
M., Jørgensen, J
Padovani, M., Brinch, C., Girart, J. M., Jørgensen, J. K., Frau, P. et al. 2012, A&A, 543, A16
2012
-
[55]
2014, A&A, 571, A33
Padovani, M., Galli, D., Hennebelle, P., Commerçon, B., & Joos, M. 2014, A&A, 571, A33
2014
-
[56]
V., Galli, D., & Caselli, P
Padovani, M., Ivlev, A. V., Galli, D., & Caselli, P. 2018, A&A, 614, A111
2018
-
[57]
2013, A&A, 560, A114
Padovani, M., Hennebelle, P., & Galli, D. 2013, A&A, 560, A114
2013
-
[58]
M., et al
Qiu, K., Zhang, Q., Menten, K. M., et al. 2014, ApJ, 794, L18
2014
-
[59]
M., Beltrán, M
Rivilla, V. M., Beltrán, M. T., Cesaroni, R., Fontani, F., Codella, C., & Zhang, Q. 2017, A&A, 598, A59
2017
-
[60]
I., Myers, P
Savadoy, S. I., Myers, P. C., Stephens, I. W., Tobin, J. et al. 2018, ApJ, 859, 165
2018
-
[61]
Schleuning, D. A. 1998, ApJ, 493, 811
1998
-
[62]
H., Allen, A., Shang, H., Ostriker, E., & Li, Z.-Y
Shu, F. H., Allen, A., Shang, H., Ostriker, E., & Li, Z.-Y. 1999, The Origin of Stars and Planetary Systems, Eds. C. J. Lada & N. D. Kylafis (Kluwer Academic Publishers), ASIC 540,193
1999
-
[63]
Tang, Y.-W., Ho, P. T. P., Girart, J. M., et al. 2009, ApJ, 695, 1399
2009
-
[64]
Tang, Y.-W., Ho, P. T. P., Koch, P. M., & Rao, R. 2010, ApJ, 717, 1262
2010
-
[65]
Vaillancourt, J. E. 2006, PASP 118, 1340
2006
-
[66]
2016, MNRAS, 460, 2050
Zhao, B., Caselli, P., Li, Z.-Y., et al. 2016, MNRAS, 460, 2050
2016
-
[67]
M., et al
Zhang, Q., Qiu, K., Girart, J. M., et al. 2014, ApJ, 792, 116 Article number, page 13 of 13
2014
Reviewed August 14, 2026 · model on record in the stance chip above.
Discussion (0). Continue with ORCID to comment.