REVIEW 1 major objections 5 minor 40 references
Analytic Calculation of Covariance between Cosmological Parameters from Correlated Data Sets, with an Application to SPTpol
T0 review · 1 major / 5 minor · reviewed 2026-08-14 · deepseek-v4-flash
Pith's one-line read This paper derives an analytic formula for the covariance between maximum-likelihood parameters from two correlated data sets and applies it to SPTpol TE and EE CMB spectra, finding weak positive correlations and a TE-EE parameter PTE of…
desk verdict A useful analytic cross-covariance formula and a solid SPTpol application, but the claim that the two PTE tests are independent is not supported and likely false. read the letter →
The pith
A machine-rendered reading of the paper's core claim, the machinery that carries it, and where it could break.
The reading
What carries the argument
The engine is Equation (7), a covariance-mapping identity: $\langle(\theta^X_{\mathrm{ML}}-\langle\theta^X_{\mathrm{ML}}\rangle)(\theta^Y_{\mathrm{ML}}-\langle\theta^Y_{\mathrm{ML}}\rangle)^T\rangle = (M^X)^T \mathbf{C}^{XY} M^Y$, where $M^X = (\mathbf{C}^{XX})^{-1}(\partial\mu^X/\partial\theta^X)(F^{XX})^{-1}$, $\mathbf{C}^{XX}$ and $\mathbf{C}^{XY}$ are data covariance blocks, $\mu^X$ is the theory vector, and $F^{XX}$ is the parameter Fisher matrix. This identity converts an off-diagonal block of the data covariance into a parameter cross-covariance. The paper evaluates the derivative matrices by finite differences of the theory spectra computed with a Boltzmann solver and feeds in SPTpol's published bandpower covariance matrix.
What would settle it
Compute the TE-only and EE-only parameter-difference covariance using a bandpower covariance matrix estimated from end-to-end simulations that include non-Gaussian lensing and a deliberately perturbed TE-EE cross-block (for example, inflated by 50%); if the resulting PTE for the parameter differences moves substantially away from 0.53, or if the PTE distribution from repeated simulations is no longer uniform, the analytic claim fails.
Extended reading notes
Core claim
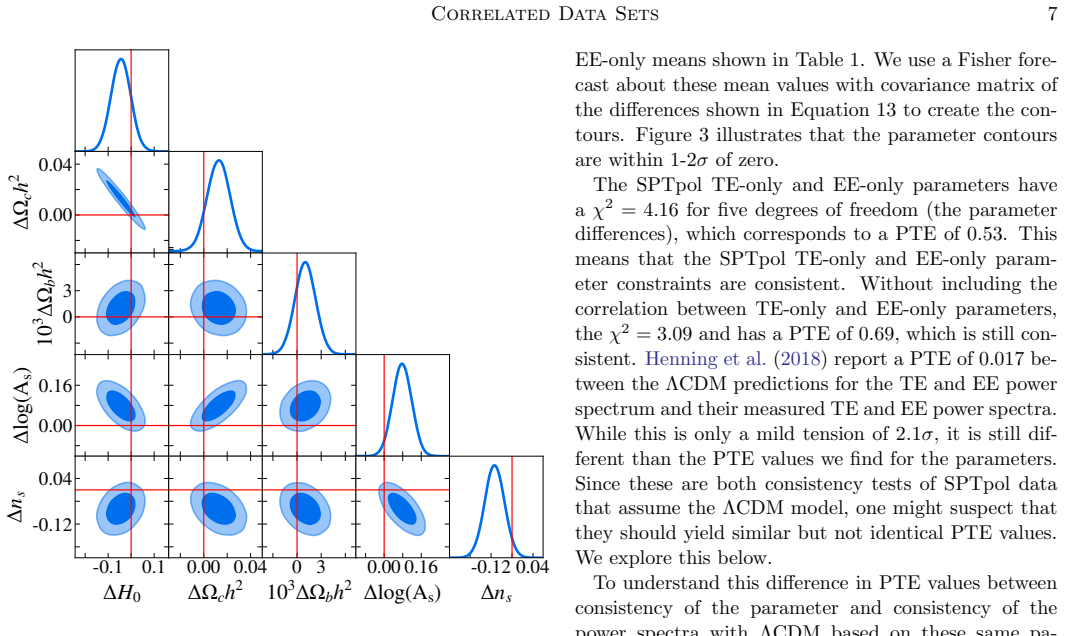
The central claim is that cross-data-set parameter covariances are computable analytically. For two data sub-sets $X$ and $Y$ sharing a Gaussian likelihood with known covariance, the covariance between their maximum-likelihood parameter vectors is $$\langle(\$\theta$^X_{\mathrm{ML}}-\langle\$\theta$^X_{\mathrm{ML}}\rangle)(\$\theta$^Y_{\mathrm{ML}}-\langle\$\theta$^Y_{\mathrm{ML}}\rangle)^T\rangle = (M^X)^T \mathbf{C}^{XY} M^Y, \qquad M^X = (\mathbf{C}^{XX})^{-1}\frac{\partial \mu^X}{\partial\$\theta$^X}($F^{{XX}}$)^{-1}.$$ Applied to SPTpol, this yields weak positive correlations between TE-only and EE-only $\Lambda$CDM parameters ($H_0$: 9%, $\log A_s$: 25%, $n_s$: 32%) even though the TE and EE spectra are negatively correlated. The TE-EE parameter differences are consistent with zero ($\chi^2=4.16$, 5 d.o.f., PTE 0.53), and 1000 simulations show the PTE of this parameter test is statistically independent of the bandpower-level PTE (0.017) that SPTpol reported, so the gap between 0.017 and 0.53 can be a statistical fluctuation. The paper also shows that dropping the parameter correlations in TT-TE and TE-EE consistency checks biases $\chi^2$ low.
Load-bearing premise
For the SPTpol application, the load-bearing premise is that $\Lambda$CDM is the true model and that the published SPTpol bandpower covariance matrix correctly describes the scatter in the TE and EE spectra; if the covariance is misestimated, the analytic cross-covariances, the PTE of 0.53, and the claimed independence of the two tests would all shift.
Editorial extensions
If this is right
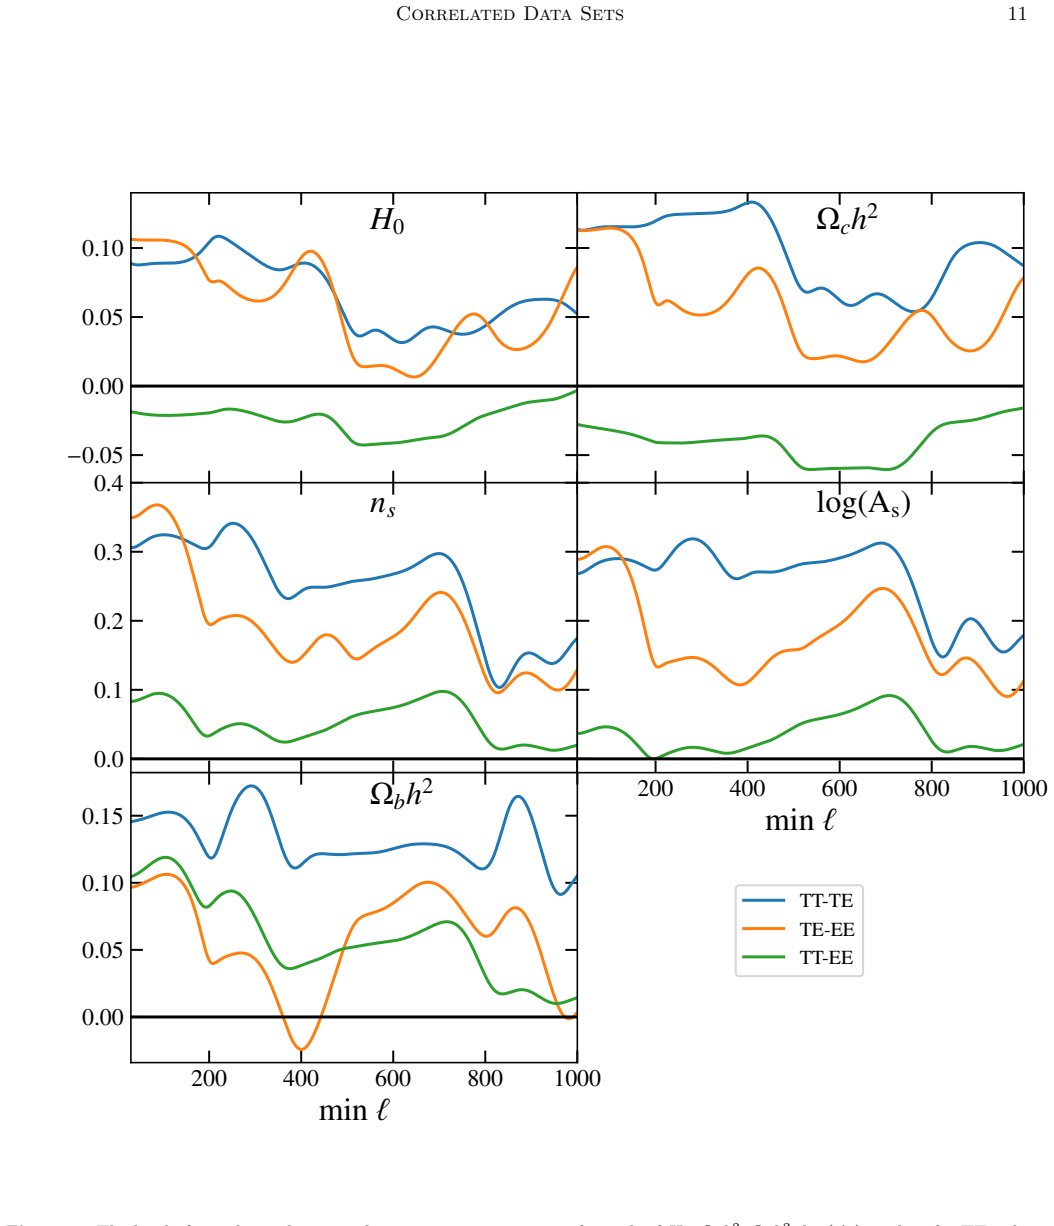
- Future CMB internal consistency checks (TT vs TE vs EE) should include parameter-level covariances; omitting them biases $\chi^2$ low and can make inconsistent parameters look artificially consistent.
- For SPTpol, the parameter-level PTE of 0.53 and the bandpower-level PTE of 0.017 are not contradictory; the two tests are statistically independent, so neither result undermines the other.
- The weak correlations found for SPTpol are generic: for a cosmic-variance-limited experiment, TT-TE and TE-EE parameter correlations range from about 0% to 50%, while TT-EE correlations are generally below 10%, so high-resolution EE constraints will be largely independent of Planck TT constraints.
- The analytic formula provides a fast check on simulations and can be applied to other correlated cosmological data sets with known covariance, such as sky-overlapping CMB experiments or supernova sub-samples with shared systematics.
Reading between the lines
- Editorial extension: The sign flip from negative data correlations to positive parameter correlations implies that parameter-correlation signs track the alignment of theory derivative vectors, so a derivative diagnostic could predict which parameter pairs are most sensitive to an ignored covariance.
- Editorial extension: The same covariance-mapping formula could be applied to the tension between Planck and distance-ladder $H_0$ measurements if a covariance for shared calibrators were available; without that covariance, the formula at least bounds how large a shared systematic would need to be to erase the tension.
- Editorial extension: The assumption that the data covariance does not depend on parameters is testable through second-order Fisher/derivative corrections; a parameter-dependent covariance would introduce extra terms into the covariance-mapping identity that the current derivation omits.
- Editorial extension: The demonstrated independence of parameter-level and data-level consistency PTEs suggests that experiments reporting only one of the two tests are under-reporting their consistency information; both should be published, and readers should not convert one into the other.
Signed reviews
Editorial analysis
A structured set of objections, weighed in public.
Referee Report
Summary. The manuscript derives an analytic expression, Eq. (7) with the response matrix defined in Eq. (8), for the covariance between maximum-likelihood parameter vectors estimated from two correlated data sets. The derivation assumes a Gaussian likelihood with a parameter-independent data covariance and a linear response of the mean vector about a fiducial model. The authors validate the formula by comparing it with the distribution of best-fit parameters from 1000 simulated SPTpol realizations (Fig. 2). They then apply the method to the SPTpol TE and EE power spectra, reporting weak positive correlations between TE-only and EE-only Lambda CDM parameters (9% for H0, 25% for log(As), 32% for ns) even though the TE-EE bandpower correlations are predominantly negative. The TE-EE parameter differences are consistent with zero (PTE 0.53), in contrast to the SPTpol bandpower-level consistency PTE of 0.017. Using simulations, the authors claim that these two consistency tests are independent. The paper further analyzes the cosmic-variance-limited case as a function of multipole range and demonstrates that neglecting parameter correlations biases chi-square low, making parameters appear more consistent.
Significance. The methodological contribution is sound and useful. Equation (7) is a clean extension of Fisher forecasting that avoids expensive simulations for cross-data-set parameter covariances, and the validation against maximum-likelihood simulations is convincing. The authors are explicit about the assumptions and test sensitivity to the fiducial cosmology, finding percent-level changes in the correlations. The concrete SPTpol predictions are falsifiable, and the paper's recommendation to account for parameter correlations in future internal-consistency checks is well supported by the Figure 6 histograms. The main weakness is an overinterpretation in the application: the claim that the parameter- and bandpower-based consistency tests are 'independent' is not established by the simulations and is contradicted by a standard Gaussian-form argument; this needs correction before publication.
major comments (1)
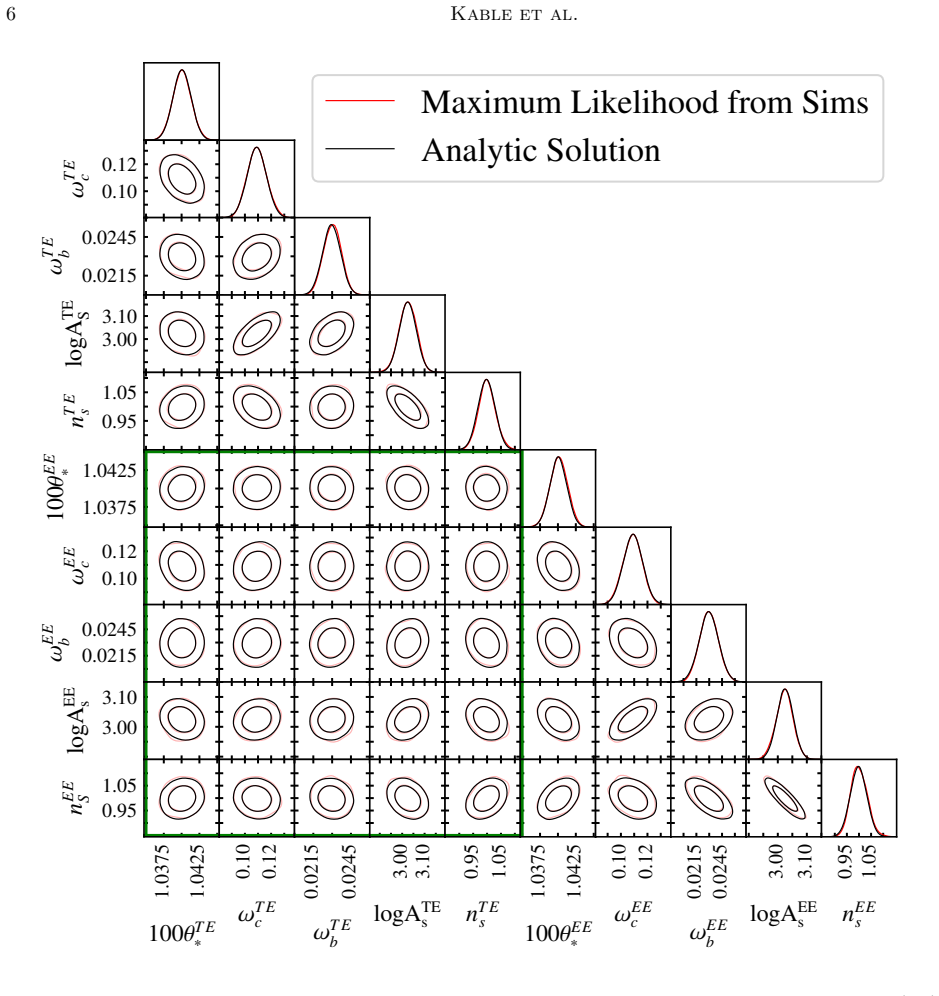
- [Abstract and Section 3.3] The claim that the two consistency tests are independent is not supported. The parameter difference Delta = theta_TE - theta_EE is a linear function of the data, while the SPTpol bandpower chi-square is a quadratic form in the data. For zero-mean Gaussian data, a linear form and a quadratic form always have zero covariance, so the reported absence of correlation between the two PTE values over 1000 simulations carries no information about independence. A direct application of Craig's theorem to the quadratic forms Q_param = Delta^T Cov(Delta)^{-1} Delta and Q_band = r^T C^{-1} r shows that they are independent only if A C B = 0, where A projects onto Delta and B projects onto the residual space; with L D = 0, one obtains A C B = L^T (L C L^T)^{-1} L, which is nonzero for any non-trivial Delta. Hence the tests are formally dependent. The authors should either remove 'independent' from the abstract and Section 5, or provide a joint-distribution analysis to quantify the expected scatter between the two PTE values. The conclusion that the 0.017 versus 0.53 difference can arise from statistical fluctuations may still be correct, but it is not established by the independence claim.
minor comments (5)
- [Section 3.3] The quoted PTE of 0.53 is computed with the joint-fit SPTpol cosmology as the fiducial model, and the Planck-fiducial rerun changes the chi-square from 4.16 to 6.2 (PTE 0.29). The abstract presents 0.53 without this caveat; the fiducial dependence should be stated wherever the PTE is quoted.
- [Section 3.3] The load-bearing assumption that the SPTpol bandpower covariance matrix correctly describes the scatter in the TE and EE spectra is stated in Section 3.3, but it is not repeated in the abstract or conclusions; given that all derived correlations and PTEs depend on this assumption, it should be flagged more prominently.
- [Section 2] The note after Eq. (8) that the covariance 'cannot be calculated using a single Fisher matrix containing two sets of varying parameters' is terse; a joint fit with two parameter vectors yields the joint posterior covariance, which is a different quantity from the cross-covariance of the individual single-data-set estimators, and the sentence should be reworded to avoid implying a joint fit is impossible.
- [Section 4.1] There are typographical errors: 'minimum mulipole moment' should be 'minimum multipole moment', and the Figure 5 caption has 'minumum' for 'minimum'.
- [Section 3.3] The sentence 'We find that there is no correlation between the PTE for the consistency of the parameters and the PTE for the consistency of the simulated TE and EE spectra with Lambda CDM predictions' should be rephrased as 'no linear correlation' to avoid implying the stronger property of independence, consistent with the major comment above.
Circularity Check
Central analytic formula is derived from the Gaussian likelihood and known data covariance; identified self-citations are contextual, not load-bearing.
full rationale
Equation (7) is obtained by linearizing the maximum-likelihood condition (Eqs. 1-6) with derivative matrices and the data covariance as inputs; the target parameter covariance is not itself an input, so the derivation is not circular. The SPTpol application uses the published bandpower covariance matrix and the joint-fit fiducial cosmology to compute the TE-only/EE-only parameter covariance, while the consistency statistic is computed from the measured parameter differences, not from a fitted parameter renamed as a prediction. The paper explicitly tests sensitivity to the fiducial choice with a Planck cosmology, finding correlations shift by only a few percent and the PTE changes from 0.53 to 0.29, showing the qualitative result is not forced by the expansion point. The only self-citations (e.g., 'We make the same basic assumptions as Section 2 of Huang et al. (2019)') are accompanied by a full statement of the standard Gaussian/linear assumptions and are not used as an external uniqueness theorem or as a load-bearing ansatz. One caveat, which is a statistical-correctness concern rather than circularity, is that the 'independence' of the parameter-difference PTE and the bandpower PTE is inferred from zero correlation in simulations; zero correlation between a linear and a quadratic statistic does not by itself establish independence for Gaussian data. This does not amount to the paper's derivation reducing to its inputs, so it does not raise the circularity score above the minor-self-citation level.
Assumptions & free parameters
free parameters (5)
- Fiducial LambdaCDM cosmology theta_fid =
H0=71.6, Omega_c h^2=0.1091, Omega_b h^2=0.02296, log(A_s)=3.025, n_s=0.998, 100theta*=1.04006
- Optical depth tau =
0.078 (fixed)
- Multipole range =
50 <= ell <= 4500
- Aberration parameters beta and <cos theta> =
beta=1.23e-3, <cos theta>=-0.4
- Finite-difference derivative step size =
1% of parameter value
assumptions (6)
- domain assumption The likelihood is Gaussian with parameter-independent covariance (Equation 1).
- domain assumption Data and parameters are near the fiducial model so the linear Taylor expansion in Equation 3 is valid.
- domain assumption The SPTpol published band-power covariance matrix correctly describes the scatter in the TE and EE spectra.
- domain assumption LambdaCDM is the true model for the simulations.
- domain assumption The cosmic-variance-limited covariance in Equation 10 is accurate and non-Gaussian lensing terms are negligible at the multipoles considered.
- standard math Diffuse priors are used so the Bayesian posterior has the same covariance as the maximum likelihood parameters.
Cite this review
Pith. "Pith review of Analytic Calculation of Covariance between Cosmological Parameters from Correlated Data Sets, with an Application to SPTpol." pith.science (2026). https://pith.science/paper/F7QL7OLY
@misc{pith2026190801626,
  author       = {Pith},
  title        = {Pith review of: Analytic Calculation of Covariance between Cosmological Parameters from Correlated Data Sets, with an Application to SPTpol},
  year         = {2026},
  howpublished = {\url{https://pith.science/paper/F7QL7OLY}},
  note         = {Machine review of arXiv:1908.01626}
}
abstract
Consistency checks of cosmological data sets are an important tool because they may suggest systematic errors or the type of modifications to $\Lambda$CDM necessary to resolve current tensions. In this work, we derive an analytic method for calculating the level of correlations between model parameters from two correlated cosmological data sets, which complements more computationally expensive simulations. This method is an extension of the Fisher analysis that assumes a Gaussian likelihood and a known data covariance matrix. We apply this method to the SPTpol temperature and polarization CMB spectra (TE and EE). We find weak correlations between $\Lambda$CDM parameters with a 9$\%$ correlation between the TE-only and EE-only constraints on $H_0$ and a 25$\%$ and 32$\%$ correlation for log($A_s$) and $n_s$ respectively. Despite the negative correlations between the TE and EE power spectra, the correlations in the parameters are positive. The TE-EE parameter differences are consistent with zero, with a PTE of 0.53, in contrast to the PTE of 0.017 reported by SPTpol for the consistency of the TE and EE power spectra with $\Lambda$CDM. Using simulations we find that the results of these two tests are independent and that this difference can arise simply from statistical fluctuations. Ignoring correlations in the TT-TE and TE-EE comparisons biases the $\chi^2$ low, artificially making parameters look more consistent. Therefore, we conclude that these correlations need to be accounted for when performing internal consistency checks of the TT vs TE vs EE power spectra for future CMB analyses.
Figures

Figures from the paper (3 more)


Reference graph
Works this paper leans on
-
[1]
Abbott, T. M. C., Abdalla, F. B., Alarcon, A., et al. 2018, PhRvD, 98, 043526
work page 2018
-
[2]
Addison, G. E., Huang, Y., Watts, D. J., et al. 2016, ApJ, 818, 132
work page 2016
-
[3]
E., Watts, D
Addison, G. E., Watts, D. J., Bennett, C. L., et al. 2018, ApJ, 853, 119
2018
-
[4]
2017, ApJ, 850, 101 Correlated Data Sets 13
Aylor, K., Hou, Z., Knox, L., et al. 2017, ApJ, 850, 101 Correlated Data Sets 13
work page 2017
-
[5]
Bennett, C. L., Larson, D., Weiland, J. L., et al. 2013, ApJS, 208, 20 Benoit-L´ evy, A., Smith, K. M., & Hu, W. 2012, PhRvD, 86, 123008
work page 2013
-
[6]
L., Madore, B
Freedman, W. L., Madore, B. F., Hatt, D., et al. 2019, ApJ, 882, 34
2019
-
[7]
Galli, S., Benabed, K., Bouchet, F., et al. 2014, PhRvD, 90, 063504
work page 2014
-
[8]
2013, Bayesian Data Analysis, Third Edition, Chapman & Hall/CRC Texts in Statistical Science (Taylor & Francis)
Gelman, A., Carlin, J., Stern, H., et al. 2013, Bayesian Data Analysis, Third Edition, Chapman & Hall/CRC Texts in Statistical Science (Taylor & Francis)
2013
Show all 40 references
- [9]
-
[10]
W., Sayre, J
Henning, J. W., Sayre, J. T., Reichardt, C. L., et al. 2018, ApJ, 852, 97
2018
-
[11]
2019, PASJ, 71, 43
Hikage, C., Oguri, M., Hamana, T., et al. 2019, PASJ, 71, 43
2019
-
[12]
L., et al
Hildebrandt, H., K¨ ohlinger, F., van den Busch, J. L., et al. 2018, arXiv e-prints, arXiv:1812.06076
2018 arXiv
-
[13]
A., et al
Hou, Z., Aylor, K., Benson, B. A., et al. 2018, ApJ, 853, 3
2018
-
[14]
E., & Bennett, C
Huang, Y., Addison, G. E., & Bennett, C. L. 2019, ApJ, 882, 124
2019
-
[15]
E., Weiland, J
Huang, Y., Addison, G. E., Weiland, J. L., & Bennett, C. L. 2018, ApJ, 869, 38
2018
-
[16]
2018, MNRAS, 474, 4894
Joudaki, S., Blake, C., Johnson, A., et al. 2018, MNRAS, 474, 4894
2018
-
[17]
A., Addison, G
Kable, J. A., Addison, G. E., & Bennett, C. L. 2019, ApJ, 871, 77
2019
-
[18]
L., Hinshaw, G., & Bennett, C
Larson, D., Weiland, J. L., Hinshaw, G., & Bennett, C. L. 2015, ApJ, 801, 9
2015
-
[19]
2002, PhRvD, 66, 103511
Lewis, A., & Bridle, S. 2002, PhRvD, 66, 103511
2002
-
[20]
2000, ApJ, 538, 473
Lewis, A., Challinor, A., & Lasenby, A. 2000, ApJ, 538, 473
2000
-
[21]
2019, PhRvD, 100, 063542
Lin, M.-X., Benevento, G., Hu, W., & Raveri, M. 2019, PhRvD, 100, 063542
2019
-
[22]
2017, PhRvD, 96, 083532
Lin, W., & Ishak, M. 2017, PhRvD, 96, 083532
2017
-
[23]
2019, PhRvD, 100, 023518
Louis, T., Garrido, X., Soussana, A., et al. 2019, PhRvD, 100, 023518
2019
-
[24]
E., Hasselfield, M., et al
Louis, T., Addison, G. E., Hasselfield, M., et al. 2014, JCAP, 7, 16
2014
-
[25]
2017, JCAP, 6, 031
Louis, T., Grace, E., Hasselfield, M., et al. 2017, JCAP, 6, 031
2017
-
[26]
2014, PhRvD, 90, 023003
Manzotti, A., Hu, W., & Benoit-L´ evy, A. 2014, PhRvD, 90, 023003
2014
-
[27]
G., Bird, S., Schaye, J., et al
McCarthy, I. G., Bird, S., Schaye, J., et al. 2018, MNRAS, 476, 2999
2018
-
[28]
M., Crawford, T
Mocanu, L. M., Crawford, T. M., Aylor, K., et al. 2019, JCAP, 2019, 038
2019
-
[29]
2019, PhRvD, 99, 023506 Planck Collaboration, Ade, P
Motloch, P., & Hu, W. 2019, PhRvD, 99, 023506 Planck Collaboration, Ade, P. A. R., Aghanim, N., et al. 2014, A&A, 571, A16 Planck Collaboration LI. 2017, A&A, 607, A95 Planck Collaboration VI. 2018, ArXiv e-prints, arXiv:1807.06209
2019 arXiv
-
[30]
L., Karwal, T., & Kamionkowski, M
Poulin, V., Smith, T. L., Karwal, T., & Kamionkowski, M. 2019, PhRvL, 122, 221301
2019
-
[31]
2019, PhRvD, 99, 043506
Raveri, M., & Hu, W. 2019, PhRvD, 99, 043506
2019
-
[32]
2019, ApJ, 876, 85 S´ anchez, A
Scolnic, D. 2019, ApJ, 876, 85 S´ anchez, A. G., Grieb, J. N., Salazar-Albornoz, S., et al. 2017, MNRAS, 464, 1493
2019
-
[33]
M., Jones, D
Scolnic, D. M., Jones, D. O., Rest, A., et al. 2018, ApJ, 859, 101
2018
-
[34]
1994, ApJL, 421, L5
Scott, D., Srednicki, M., & White, M. 1994, ApJL, 421, L5
1994
-
[35]
L., Hlozek, R
Sievers, J. L., Hlozek, R. A., Nolta, M. R., et al. 2013, JCAP, 10, 60
2013
-
[36]
T., Reichardt, C
Story, K. T., Reichardt, C. L., Hou, Z., et al. 2013, ApJ, 779, 86
2013
-
[37]
2010, in Lecture Notes in Physics, Berlin Springer
Verde, L. 2010, in Lecture Notes in Physics, Berlin Springer
2010
-
[38]
2008, Cosmology, Cosmology (OUP Oxford)
Weinberg, S. 2008, Cosmology, Cosmology (OUP Oxford)
2008
-
[39]
C., Suyu, S
Wong, K. C., Suyu, S. H., Chen, G. C. F., et al. 2019, arXiv e-prints, arXiv:1907.04869
2019 arXiv
-
[40]
2019, arXiv e-prints, arXiv:1908.00993
Scolnic, D. 2019, arXiv e-prints, arXiv:1908.00993
2019 arXiv
Reviewed August 14, 2026 · model on record in the stance chip above.
Discussion (0). Continue with ORCID to comment.