REVIEW 4 major objections 6 minor 37 references
Characterising complex healthcare systems using network science: The small world of emergency surgery
T0 review · 4 major / 6 minor · reviewed 2026-08-14 · deepseek-v4-flash
Pith's one-line read A hospital's emergency surgery service behaves like a small-world network whose few heavily used hubs—theatres, general medical wards, neurosurgical wards, radiology, and neuro-critical care—carry the whole patient-flow system, so the…
desk verdict Useful single-hospital network map, but the scale-free and small-world labels need reining in before this is citable as evidence. read the letter →
The pith
A machine-rendered reading of the paper's core claim, the machinery that carries it, and where it could break.
The reading
What carries the argument
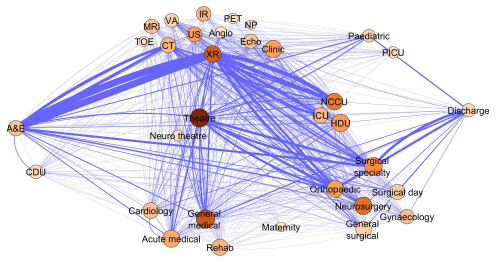
The central object is a weighted, directed patient-transfer network reconstructed from electronic health record timestamps: nodes are patient locations (wards, theatres, radiology, critical care units) and edges are transfers between locations, weighted by how often each transfer occurs. The argument is carried by five standard network measures: the degree distribution's power-law tail, which indicates a scale-free structure; the small-world indices $\sigma$ and $\omega$, which compare path length and clustering against random and lattice benchmarks; the assortativity coefficient, which reveals whether hubs connect to hubs or to peripheral nodes; the strength–degree scaling $s \sim k^\beta$, which shows whether traffic grows faster than connectivity; and betweenness centrality, which identifies nodes lying on the most shortest paths. These measures turn raw movement data into claims about system resilience by linking the observed topology to known properties of scale-free and small-world networks.
What would settle it
Re-run the same network construction on a period in which one of the identified hub-bottleneck areas (for example, theatres or general medical wards) was actually closed or overloaded, and compare network-wide mean shortest path and transfer delays against a control period. If the hub outage produces no greater system-wide degradation than a comparable closure of a non-hub ward, or if a second hospital's electronic health record data yields no power-law degree tail and small-world indices far from $\sigma \approx 1$, $\omega \approx 0$, the paper's central claim fails.
Extended reading notes
Core claim
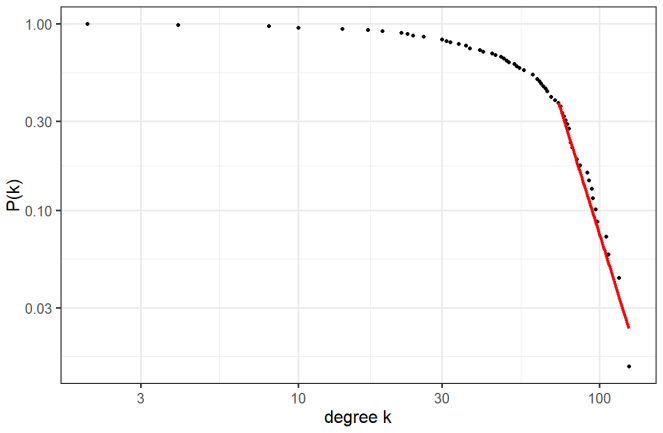
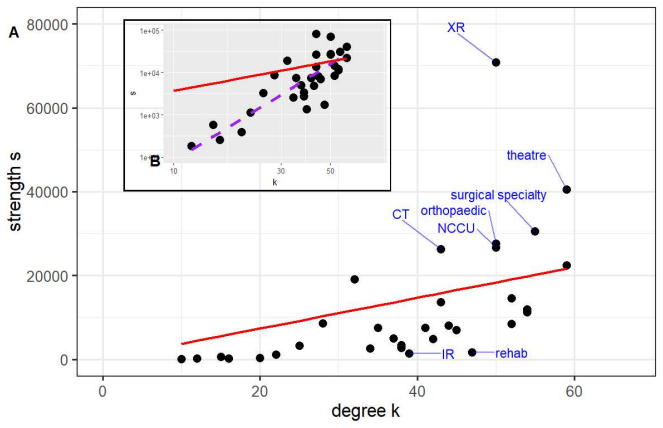
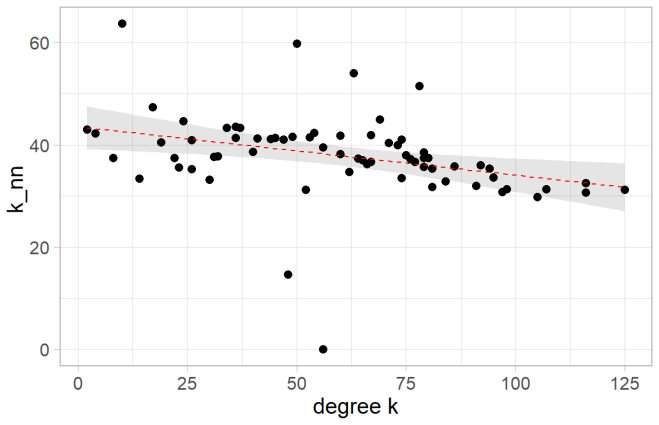
The paper's central discovery is that the aggregate patient-flow network of an emergency surgery service has the architecture of a scale-free, disassortative small-world network. The degree distribution of the uncategorised network shows a power-law tail with exponent $\gamma = 6.18$ (95% CI 6.14–6.26); the small-world indices are $\sigma \approx 0.99$ and $\omega \approx 0.005$ for the categorised network, and similar for the uncategorised network; and the assortativity is negative ($a = -0.20$ uncategorised, $-0.12$ categorised), meaning high-degree nodes connect preferentially to low-degree nodes. The strength–degree relationship follows $s \sim k^\beta$ with $\beta \approx 2.1$, so better-connected areas carry disproportionately more traffic than their degree alone would suggest. Combining degree and betweenness centrality, the paper designates general medical wards, theatres, and neurosurgical wards as both hubs and bottlenecks, with radiology and neuro-critical care as additional bottlenecks. Because such disassortative, hub-dominated networks are resistant to random node removal but fragile to targeted attack on hubs, the paper concludes that the service is resilient overall yet has specific single points of failure that service planning should protect.
Load-bearing premise
The load-bearing premise is that the recorded patient transfers are true edges in the care network—medically necessary, resource-consuming moves—rather than bed-availability shuffles or administrative noise, and that replacing physical wards with care categories does not distort the topology that the conclusions depend on.
Editorial extensions
If this is right
- A closure, infection outbreak, or overload affecting one of the hub-bottleneck areas—general medical wards, theatres, or neurosurgical wards—would have a disproportionate effect on patient flow across the whole emergency surgery service, including in areas not directly connected to the failing ward.
- Randomly selected low-degree ward failures should have little system-wide impact, because most nodes are peripheral and the small-world structure provides alternative short paths.
- Radiology and neuro-critical care, which are bottlenecks despite lower degree, would be natural targets for capacity increases even though their connectivity alone does not mark them as critical.
- The same network-construction and hub/bottleneck procedure can be applied to other hospital services or institutions to produce comparable maps of system resilience.
- System-level network metrics, rather than single-department performance indicators, are the appropriate objects for monitoring hospital strain and designing service improvements.
Reading between the lines
- A natural testable extension is to build time-resolved networks (weekly or monthly) from the same electronic health record data; if the hub-bottleneck set shifts during seasonal pressure or known disruption events, the aggregate map is a stable skeleton rather than a fixed structure.
- The disassortative architecture predicts a specific failure signature: loss of a hub should cause congestion in low-degree wards that are only indirectly connected, whereas loss of a random ward should leave global shortest-path lengths nearly unchanged; this could be checked against historical bed crises or an agent-based simulation.
- The superlinear strength–degree scaling ($\beta \approx 2.1$) implies that doubling a hub's number of connections more than doubles its traffic, so capacity planning should be based on weighted traffic load rather than on the number of connected units.
- Because the categorised network (care categories instead of physical wards) preserves the small-world and disassortative properties, the architecture may reflect care processes rather than building layout; comparing two hospitals with different physical configurations could separate these factors.
Signed reviews
Editorial analysis
A structured set of objections, weighed in public.
Referee Report
Summary. The paper uses retrospective electronic health record data from a UK tertiary hospital to construct directed, weighted networks of patient movement for more than 16,500 emergency surgical admissions over a 3.5-year period. It analyses degree distributions, small-world metrics, assortativity, strength-degree relationships, and betweenness centrality, then designates hubs and bottlenecks (theatres, general medical wards, neurosurgical wards, radiology, NCCU). The central claim is that emergency surgical services form a 'scale-free, dissortative small-world network' that is robust to random failure but vulnerable to targeted disruption of hubs. The authors suggest this classification can inform service design and resilience planning.
Significance. If the central claim holds, the paper offers a useful demonstration that routinely collected location data can be used to build an aggregate network model of a hospital service, and the hub/bottleneck identification could be a practical planning tool. The use of a large real-world dataset and the application of established network-science methods are strengths, as is the authors' explicit acknowledgment of several modelling limitations. However, the two classification steps that carry the main conceptual weight—the scale-free degree distribution and the small-world designation—are exactly the steps where the evidence is weakest, so the theoretical conclusions about robustness and vulnerability are not yet established.
major comments (4)
- [Results, 'Overall network and degree distribution' and 'Scale-free and small world networks'] The scale-free classification rests on a single power-law fit with γ = 6.18 (95% CI 6.14–6.26) and p = 0.46. The authors themselves note in the 'Scale-free and small world networks' section that γ is far outside the 2–4 range typical of real networks and that 'there is a case to be made that this reflects an exponential truncation to a power law', yet they still conclude the network is scale-free. A p-value from the Clauset et al. bootstrap is not a model comparison; it only indicates that a power law cannot be rejected as the tail model. The manuscript does not fit competing distributions such as log-normal, exponential, or power law with exponential cutoff, nor does it report the fitted xmin or the number of nodes in the tail. Since the 'robust but vulnerable at hubs' inference specifically depends on a genuine power-law degree distribution, this issue is load-bearing for the paper's central claim and must be addressed with explicit alternative-model comparisons and a clearer statement of what follows if the tail is not a power law.
- [Results, 'Scale-free and small world networks'] The small-world classification appears internally inconsistent. The paper reports σ = 0.99 for both networks and states that 'the range of σ is from 0 to 1 with values close to 1 representing a small-world network'. In the Humphries–Gurney definition cited by the authors, σ = (C/Crand)/(L/Lrand) and the criterion for small-worldness is σ > 1; a value below 1 indicates the network is not small-world relative to the random baseline. The same issue affects ω: although ω = 0.0053 and ω = 0.0022 are near zero, the text does not explain how the randomized baselines were generated. Because the title and abstract both feature the 'small world' claim, this must be recomputed or reinterpreted with the correct criterion, and the randomized comparison must be described.
- [Methods, 'Network construction' and 'Model'] The network construction is under-specified in ways that matter for the degree distribution and centrality results. The paper does not state the number of nodes in the non-categorised or categorised networks, how individual physical locations were mapped to nodes, how ward re-designations and closures were handled, or how directed edges were assigned from timestamps. Since the degree distribution, hub thresholds, and power-law fit all depend on the node set and edge definition, the reader cannot assess whether the high γ value is an artefact of a small node count or of agglomeration choices. The authors should report N for each network, describe the location-to-node mapping and the aggregation rule for the categorised network, and provide the edge construction algorithm (including handling of transfers involving multiple location changes within a short time window).
- [Discussion and Conclusions] The resilience statements go beyond what is directly tested. The paper concludes that the system is 'robust overall but may be vulnerable to attack at critical hubs' and that removal of a hub would 'have a significant impact on the workings of the system'. No perturbation analysis is performed: the manuscript does not simulate random node removal or targeted hub removal on the constructed network, so the robustness/vulnerability claim is inferred only from the scale-free classification and dissortativity, which are themselves uncertain. Either run such simulations and report the results, or temper the conclusions to describe the identified nodes as structurally central without claiming attack tolerance properties derived from scale-free theory.
minor comments (6)
- [Throughout] There are several typographical errors: 'betweeness' should be 'betweenness', 'dissortative' should be 'disassortative', 'wih' should be 'with', and 'replaced agglomerating' in Methods appears to be a sentence fragment.
- [Results, 'Overall network and degree distribution'] The statement that p = 0.46 'means that a power-law is an appropriate fit' is a common but imprecise phrasing; a high p-value means the data are not inconsistent with a power law, not that the power law is the best or correct model. Please rephrase.
- [Results, 'Weights'] The strength-degree power-law fit with β ≈ 2.1 is reported without a confidence interval or goodness-of-fit information. Since Figure 5 appears to show substantial scatter, please provide the fit details or describe the procedure used to assess the fit.
- [Methods, 'Data'] The abstract says '16,500 individual inpatient episodes' while Methods and Results say 'more than 16,500'; also, the number of nodes in each network is never given, which is needed to interpret the degree distribution and centrality measures.
- [Methods, 'Network construction'] The text says the categorised network was created by 'replaced agglomerating physical locations into care categories'; this seems to be garbled and should be rewritten to describe the aggregation procedure clearly.
- [Appendix] Reference [1] ('NHS England and NHS Digital. Hospital Accident and Emergency Activity; 2018') lacks a URL, access date, or publication details, making it difficult to verify the cited claim.
Circularity Check
No circularity: empirical network characterization is self-contained; the flagged statistical caveats are correctness concerns, not circular derivations.
full rationale
The paper constructs a network directly from retrospective EHR location data (nodes = patient locations, edges = patient transfers), then computes degree distributions, clustering, small-world metrics, betweenness centrality, and hub/bottleneck classifications from those computed measures. No parameter is fitted to a subset of data and then presented as a prediction of a closely related quantity; the power-law fit (gamma = 6.18, p = 0.46) is a descriptive characterization of the same network, and the resilience statement is an application of known network-science results conditional on that classification. The authors' own caveat that the high gamma may reflect exponential truncation to a power law is an honest limitation of the scale-free classification, but it does not make the derivation circular: the classification is not defined in terms of the conclusion, and no load-bearing step reduces by construction to its own input. Likewise, the sigma = 0.99 small-world claim with an asserted 0-1 range is a possible misstatement of the Humphries-Gurney criterion (which normally requires sigma > 1), but this is a statistical or interpretive correctness issue, not circularity. The paper contains no load-bearing self-citations: references are to standard network-science literature and external methodological sources, and none of the authors' prior work is invoked to forbid alternatives or to justify the model choice. The central claims are empirical fits and computed metrics, so no circularity score is warranted.
Assumptions & free parameters
free parameters (3)
- Power-law degree exponent gamma =
6.18 (95% CI 6.14-6.26)
- Strength-degree exponent beta =
~2.1
- Hub and bottleneck thresholds =
Top 20% of degree and top 20% of betweenness centrality
assumptions (5)
- domain assumption Each patient transfer between locations represents a medically necessary decision and a use of resources.
- domain assumption The aggregate 3.5-year network represents the hospital system under business-as-usual conditions.
- domain assumption Scale-free networks are robust to random failure and vulnerable to targeted hub attack; small-world networks support efficient flow.
- standard math Clauset et al. power-law fitting methodology is a valid way to select the degree-distribution model.
- domain assumption Node categories produced by agglomerating physical locations preserve the clinically relevant structure.
Cite this review
Pith. "Pith review of Characterising complex healthcare systems using network science: The small world of emergency surgery." pith.science (2026). https://pith.science/paper/THFTZZOP
@misc{pith2026190801688,
  author       = {Pith},
  title        = {Pith review of: Characterising complex healthcare systems using network science: The small world of emergency surgery},
  year         = {2026},
  howpublished = {\url{https://pith.science/paper/THFTZZOP}},
  note         = {Machine review of arXiv:1908.01688}
}
read the original abstract
Hospitals are complex systems and optimising their function is critical to the provision of high quality, cost effective healthcare. Nevertheless, metrics of performance have to date focused on the performance of individual elements rather than the system as a whole. Manipulation of individual elements of a complex system without an integrative understanding of its function is undesirable and may lead to counter-intuitive outcomes and a holistic metric of hospital function might help design more efficient services. We aimed to characterise the system of peri-operative care for emergency surgical admissions in our tertiary care hospital using network analysis. We used retrospective electronic health record data to construct a weighted directional network of the system. For this we selected all unplanned admissions during a 3.5 year period involving a surgical intervention during the inpatient stay and obtained a set of 16,500 individual inpatient episodes. We then constructed and analysed the structure of this network using established methods from network science such as degree distribution, betweenness centrality and small-world characteristics. The analysis showed the service to be a complex system with scale-free, small-world network properties. This finding has implications for the structure and resilience of the service as such networks, whilst being robust in general, may be vulnerable to outages at specific key nodes. We also identified such potential hubs and bottlenecks in the system based on a variety of network measures. It is hoped that such a holistic, system-wide description of a hospital service may provide better metrics for hospital strain and serve to help planners engineer systems that are as robust as possible to external shocks.
Figures

Figures from the paper (4 more)


Reference graph
Works this paper leans on
-
[1]
Hospital Accident and Emergency Act ivity; 2018
NHS England and NHS Digital. Hospital Accident and Emergency Act ivity; 2018. 11 Abbreviation Ward area AE or A&E Emergency department Angio Angiopgraphy CDU clinical decision unit (short stay) Clinic Referrals and appointments within the hospital CT Computer tomography Echo Trans-thoracic echocardiography HDU High-dependency unit ICU Intensive care IR In...
work page 2018
-
[2]
Keogh B, Culliford D, Guerrero-Ludue˜ na R, Monks T. Exploring e mergency department 4- hour target performance and cancelled elective operations: A reg ression analysis of routinely collected and openly reported NHS trust data. BMJ Open. 2018
work page 2018
-
[3]
Wong DJN, Harris SK, Moonesinghe SR, Moonesinghe SR, Wong DJN , Harris SK, et al. Cancelled operations: a 7-day cohort study of planned adult inpatie nt surgery in 245 UK National Health Service hospitals. British Journal of Anaesthesia. 2018;121(4):730–738
work page 2018
-
[4]
Martinez DA, Kane EM, Jalalpour M, Scheulen J, Rupani H, Toteja R, et al. An Electronic Dashboard to Monitor Patient Flow at the Johns Hopkins Hospital: Co mmunication of Key Performance Indicators Using the Donabedian Model. Journal of M edical Systems. 2018 Aug;42(8):133
work page 2018
-
[5]
Hospital level ana lysis to improve patient flow
Khanna S, Boyle J, Good N, Bugden S, Scott M. Hospital level ana lysis to improve patient flow. Studies in health technology and informatics. 2013;188:65–71. 12
work page 2013
-
[6]
Discharge timeliness and its impac t on hospital crowding and emergency department flow performance
Khanna S, Sier D, Boyle J, Zeitz K. Discharge timeliness and its impac t on hospital crowding and emergency department flow performance. Emergen cy Medicine Australasia. 2016 Apr;28(2):164–170
work page 2016
-
[7]
For ecasting the Emer- gency Department Patients Flow
Afilal M, Yalaoui F, Dugardin F, Amodeo L, Laplanche D, Blua P. For ecasting the Emer- gency Department Patients Flow. Journal of Medical Systems. 20 16 Jul;40(7):175
-
[8]
Khanna S, Boyle J, Good N, Bell A, Lind J. Analysing the emergency department patient journey: Discovery of bottlenecks to emergency department pa tient flow. EMA - Emergency Medicine Australasia. 2017 Feb;29(1):18–23
work page 2017
Show all 37 references
-
[9]
A quest for the structur e of intra- and postoperative surgical team networks: does the small-world property evolve ove r time? Social Network Analysis and Mining
Ebadi A, Tighe PJ, Zhang L, Rashidi P. A quest for the structur e of intra- and postoperative surgical team networks: does the small-world property evolve ove r time? Social Network Analysis and Mining. 2019 Dec;9(1):7
2019
-
[10]
Network science
Barab´ asi AL, P´ osfai M. Network science. Cambridge University Press; 2016
2016
-
[11]
Challenges in network science: Applications to infrastructures, climate, socia l systems and economics
Havlin S, Kenett DY, Ben-Jacob E, Bunde A, Cohen R, Hermann H , et al. Challenges in network science: Applications to infrastructures, climate, socia l systems and economics. European Physical Journal: Special Topics. 2012 Nov;214(1):273– 293
2012
-
[12]
The structure and function of complex networks
Newman MEJ. The structure and function of complex networks . SIAM Review. 2003;45(2):167–256
2003
-
[13]
Mod- elling disease outbreaks in realistic urban social networks
Eubank S, Guclu H, Anil Kumar VS, Marathe MV, Srinivasan A, Tor oczkai Z, et al. Mod- elling disease outbreaks in realistic urban social networks. Nature. 2004;429(6988):180–184
2004
-
[14]
Diameter of the World-Wide We b
Albert R, Jeong H, Barab´ asi AL. Diameter of the World-Wide We b. Nature. 1999;401(6749):130–131
1999
-
[15]
Analysis of the U.S
An C, O’Malley AJ, Rockmore DN, Stock CD. Analysis of the U.S. pat ient referral network. Statistics in Medicine. 2018;37(5):847–866
2018
-
[16]
Network a nalysis of patient flow in two UK acute care hospitals identifies key sub-networks for A&E pe rformance
Bean DM, Stringer C, Beeknoo N, Teo J, Dobson RJB. Network a nalysis of patient flow in two UK acute care hospitals identifies key sub-networks for A&E pe rformance. PLOS ONE. 2017 Oct;12(10):e0185912
2017
-
[17]
Scale-fr ee and hierarchical structures in complex networks
Barab´ asi AL, Dezso D, Ravasz E, Yook SH, Oltvai Z. Scale-fr ee and hierarchical structures in complex networks. AIP Conference. 2003
2003
-
[18]
Error and att ack tolerance of complex networks
Crucitti P, Latora V, Marchiori M, Rapisarda A. Error and att ack tolerance of complex networks. In: Physica A: Statistical Mechanics and its Applications . vol. 340. North-Holland
-
[19]
Collective dynamics of ‘small-world’ netw orks
Watts DJ, Strogatz SH. Collective dynamics of ‘small-world’ netw orks. Nature. 1998 Jun;393(6684):440–442
1998
-
[20]
Network ’small-world-ness’: A quantita tive method for determ- ining canonical network equivalence
Humphries MD, Gurney K. Network ’small-world-ness’: A quantita tive method for determ- ining canonical network equivalence. PLoS ONE. 2008;3(4)
2008
-
[21]
The Ubiquity of Small- World Networks
Telesford QK, Joyce KE, Hayasaka S, Burdette JH, Laurienti PJ. The Ubiquity of Small- World Networks. Brain Connectivity. 2011;1(5):367–375
2011
-
[22]
Network structure and the diffusion of kno wledge
Cowan R, Jonard N. Network structure and the diffusion of kno wledge. Journal of Economic Dynamics and Control. 2004 Jun;28(8):1557–1575. 13
2004
-
[23]
Exploring network structur e, dynamics, and function using NetworkX
Hagberg AA, Schult DA, Swart PJ. Exploring network structur e, dynamics, and function using NetworkX. In: 7th Python in Science Conference (SciPy 2008 ); 2008. p. 11–15
2008
-
[24]
The igraph software package for complex ne twork research
Gabor Csardi TN. The igraph software package for complex ne twork research. InterJournal. 2006;p. 1695
2006
-
[25]
Cytoscape: A software Environment for integrated models of biomolecular intera ction networks
Shannon P, Markiel A, Ozier O, Baliga NS, Wang JT, Ramage D, et a l. Cytoscape: A software Environment for integrated models of biomolecular intera ction networks. Genome Research. 2003 Nov;13(11):2498–2504
2003
-
[26]
Power-Law Distributions in Em pirical Data
Clauset A, Shalizi CR, Newman MEJ. Power-Law Distributions in Em pirical Data. SIAM Review. 2009;51(4):661–703
2009
-
[27]
Bootstrap Methods: Another Look at the Jackknife
Efron B. Bootstrap Methods: Another Look at the Jackknife . The Annals of Statistics. 1979 Jan;7(1):1–26
1979
-
[28]
Title Analysis of Heavy Tailed Distributions; 2019
Gillespie C. Title Analysis of Heavy Tailed Distributions; 2019
2019
-
[29]
T he architecture of com- plex weighted networks
Barrat A, Barthelemy M, Pastor-Satorras R, Vespignani A. T he architecture of com- plex weighted networks. Proceedings of the National Academy of S ciences. 2004 Mar;101(11):3747–3752
2004
-
[30]
Assortativity in complex networks
Noldus R, Mieghem PV. Assortativity in complex networks. Journ al of Complex Networks. 2014;3(4):507–542
2014
-
[31]
The worldwide air transportation network: Anomalous centrality, community structure, and cities’ global role s
Mossa S, Turtschi A, Amaral LaN, Guimer` a R. The worldwide air transportation network: Anomalous centrality, community structure, and cities’ global role s. Proceedings of the National Academy of Sciences of the United States of America. 200 5;102(22):7794–7799
-
[32]
How Correla ted Are Network Centrality Measures? Connections (Toronto, Ont)
Valente TW, Coronges K, Lakon C, Costenbader E. How Correla ted Are Network Centrality Measures? Connections (Toronto, Ont). 2008;28(1):16–26
2008
-
[33]
The importanc e of bottlenecks in protein networks: Correlation with gene essentiality and expressio n dynamics
Yu H, Kim PM, Sprecher E, Trifonov V, Gerstein M. The importanc e of bottlenecks in protein networks: Correlation with gene essentiality and expressio n dynamics. PLoS Com- putational Biology. 2007;3(4):713–720
2007
-
[34]
Mean-field theory for scale- free random networks
Barab´ asi AL, Albert R, Jeong H. Mean-field theory for scale- free random networks. Physica A: Statistical Mechanics and its Applications. 1999 Oct;272(1-2):17 3–187
1999
-
[35]
The Small World of the American Corpo rate Elite, 1982-2001
Davis FD, Yoo M, Baker WE. The Small World of the American Corpo rate Elite, 1982-2001. Strategic Organization. 2003 Aug;1(3):301–326
1982
-
[36]
Entropic origin of d isassortativity in complex networks
Johnson S, Torres JJ, Marro J, Mu˜ noz MA. Entropic origin of d isassortativity in complex networks. Physical Review Letters. 2010;104(10)
2010
-
[37]
The struc ture of interurban traffic: A weighted network analysis
De Montis A, Barth´ elemy M, Chessa A, Vespignani A. The struc ture of interurban traffic: A weighted network analysis. Environment and Planning B: Pla nning and Design. 2007;34(5):905–924. 14
2007
Reviewed August 14, 2026 · model on record in the stance chip above.
Discussion (0). Continue with ORCID to comment.