REVIEW 5 major objections 5 minor 55 references
Why Authors Don't Visualize Uncertainty
T0 review · 5 major / 5 minor · reviewed 2026-08-14 · deepseek-v4-flash
Pith's one-line read Omitting uncertainty from a chart is not neutral: viewers judge charts against imagined models, so without uncertainty the model is almost unspecified and showing uncertainty necessarily narrows interpretations.
desk verdict Empirically valuable study of why authors omit uncertainty, but the formal 'necessarily reduces degrees of freedom' claim is oversold and should be reframed as a testable hypothesis. read the letter →
The pith
A machine-rendered reading of the paper's core claim, the machinery that carries it, and where it could break.
The reading
What carries the argument
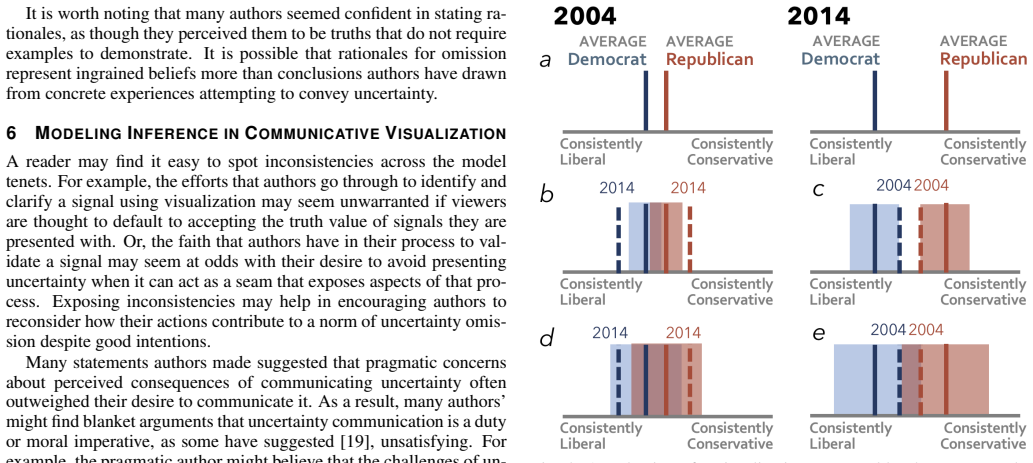
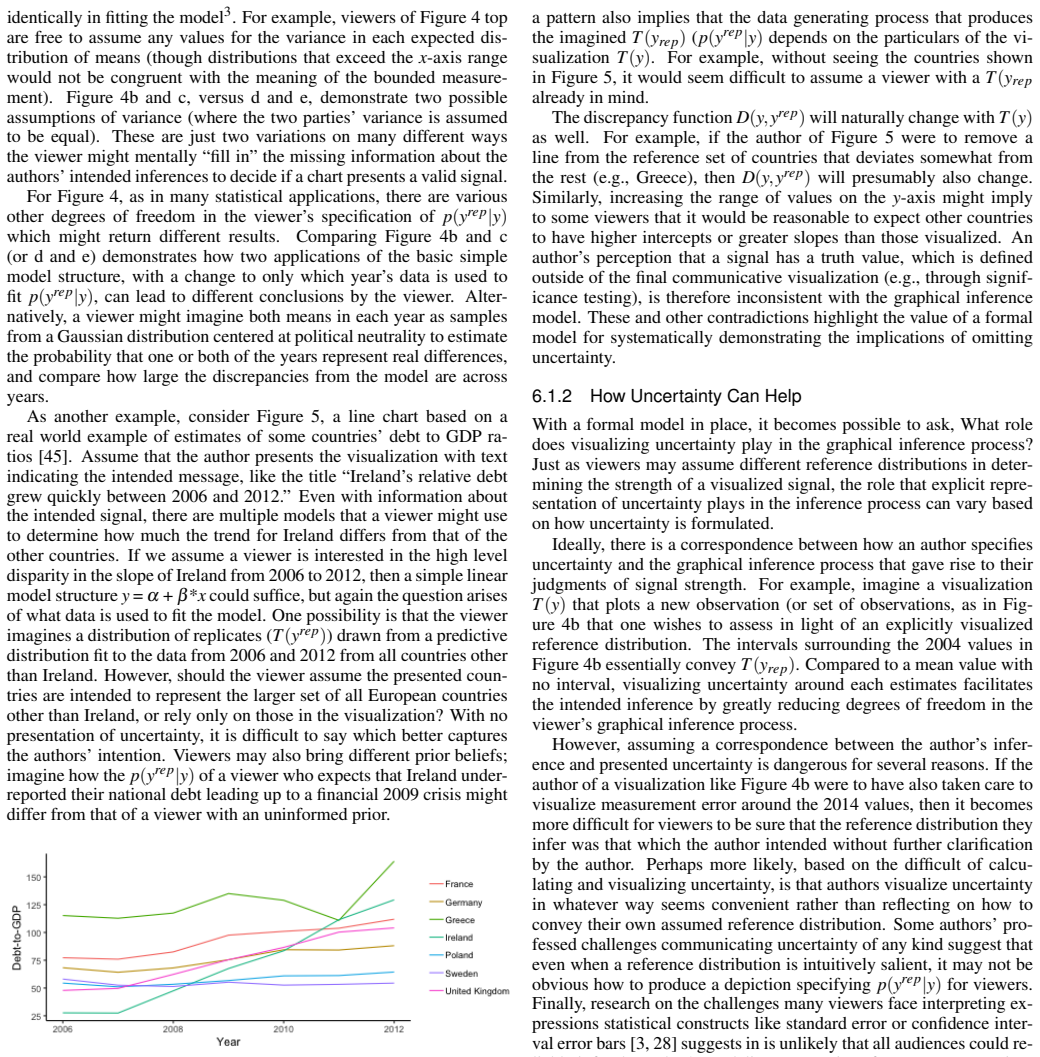
The central mechanism is the implicit posterior predictive model check, a formal analogy between visual inspection and statistical model checking. A viewer of a chart is modeled as constructing an imagined distribution of replicated data $T(y_{\mathrm{rep}})$ from a model that depends on the observed data, the viewer's priors, and the viewer's assumptions about variance and comparison cases, and then judging how discrepant the displayed data are from that distribution. The argument uses this mechanism to convert the rhetorical observation that authors treat visualization as "signal" into a precise statement: with no uncertainty shown, the viewer's model specification is underdetermined, so uncertainty representation narrows the space of models a viewer can plausibly entertain. Constructed examples in the paper—a two-period two-party attitude chart and a multi-country debt-to-GDP line chart—show how varying the assumed variance or the comparison data changes the conclusion a viewer would draw.
What would settle it
Take a single chart designed to support an inference and render two versions, one without uncertainty and one with explicit intervals or a distribution, then measure the spread of viewers' conclusions or perceived signal strength across a large sample. The paper's claim predicts that the no-uncertainty version will produce a wider spread of inferences; observing no reduction when uncertainty is added would falsify the central claim. A more targeted version would ask viewers to identify which reference distribution the chart came from and test whether uncertainty annotations improve agreement.
Extended reading notes
Core claim
The paper's claim is that uncertainty representation necessarily reduces the degrees of freedom in a viewer's statistical inferences, stated formally as "uncertainty representation necessarily constrains the set of possible models." In the proposed account, looking at a chart is an implicit posterior predictive model check: a viewer mentally generates a reference distribution $T(y_{\mathrm{rep}})$ from a model that is fit to the observed data and their prior beliefs, then compares the chart to that distribution to decide whether the signal is real. Without uncertainty, the viewer must choose variance, the data used to fit the model, the comparison set, and the model structure on their own, so different viewers can reach different conclusions from the same chart. Visualized uncertainty supplies information about the reference distribution the author had in mind, moving some of that interpretive burden from the viewer to the author; the paper grants that uncertainty does not eliminate ambiguity, because viewers can still misinterpret intervals or infer a different model than intended.
Load-bearing premise
The whole argument rests on the assumption that viewers actually judge charts by doing something like an implicit model check—mentally comparing the chart to an imagined set of replications—and that without uncertainty the space of models they can imagine is wide enough that different viewers will genuinely diverge; if real viewers do not run such comparisons, or if their mental model space stays narrow even without uncertainty, the conclusion that uncertainty necessarily reduces degrees of freedom does not follow.
Editorial extensions
If this is right
- In a chart that omits uncertainty, viewers must fill in the missing statistical assumptions themselves; different viewers may therefore walk away with different conclusions from the same graphic.
- Showing uncertainty narrows the set of interpretations but does not make interpretation unique: intervals can be misread as confidence limits or as data ranges, so authors still need to explain the reference model behind the uncertainty.
- The rhetorical model implies that better uncertainty-encoding techniques alone will not change practice; authors' beliefs about signal, process, and credibility also have to shift.
- Because the formal argument is logical rather than ethical, it offers a way to argue for uncertainty communication that does not depend on claims about moral duty.
- Tools that help authors calculate, explain, and visualize uncertainty, and that let authors express the reference distribution behind their own analysis, are a direct practical consequence.
Reading between the lines
- An extension the paper does not develop: if omission leaves the reference distribution underdetermined, then the persuasive effect of a chart may depend as much on the priors viewers bring as on the data shown; tests could compare conclusions across viewers with different domain priors on the same no-uncertainty chart.
- Another testable extension is whether the degrees-of-freedom argument changes author behavior: researchers could show authors the spread of interpretations their own charts produce with and without uncertainty and measure whether they then choose to include uncertainty.
- The paper gestures toward decision-theoretic reasoning in its discussion; a fuller formal treatment would model the worst-case decision a viewer could make under omission versus inclusion, which would make the cost of omission concrete in specific policy or consumer settings.
Signed reviews
Editorial analysis
A structured set of objections, weighed in public.
Referee Report
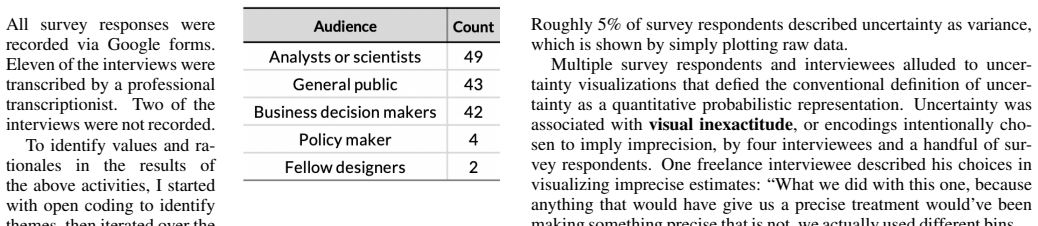
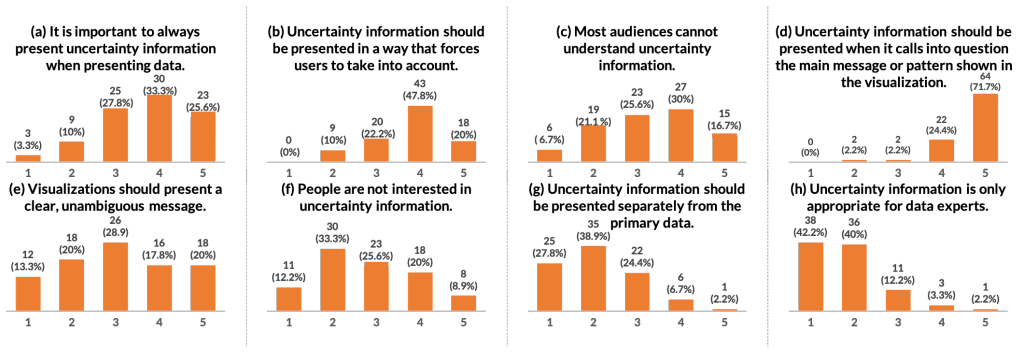
Summary. This paper investigates why visualization authors omit uncertainty from their graphics. The author reports a survey of 90 visualization authors recruited via Twitter and interviews with 13 influential visualization practitioners, documenting a tension between authors' professed belief that uncertainty matters and their frequent omission of it. The paper contributes a three-tenet rhetorical model of uncertainty omission (visualization as signal; process validates signal; uncertainty obfuscates signal), and then adapts Gelman's graphical-inference framework to argue that uncertainty communication 'necessarily reduces degrees of freedom in viewers' statistical inferences.' It closes with recommendations for future tools and evaluations.
Significance. The empirical contribution is valuable: it is one of the few direct, systematic elicitations of practitioner rationales for uncertainty omission, and the paper is transparent about its recruitment, coding process, and sample limitations. The rhetorical model is a plausible and useful synthesis that can orient future HCI and visualization research. The formal model is a thought-provoking adaptation of existing statistical-inference ideas rather than a new derivation, and it is presented through illustrative examples. The main weakness is that the central formal claim is stated more strongly than the supporting argument and the manuscript's own caveats allow. Rephrasing the claim as 'can reduce degrees of freedom under a specified interpretation model' would make the paper defensible; the qualitative and rhetorical contributions do not need to change.
major comments (5)
- [Section 6.1, Figure 4] The claim that uncertainty visualization 'necessarily reduces degrees of freedom' in viewers' inferences is not established by the formalism presented. No operational definition is given for 'degrees of freedom' or for the viewer's model space, and the argument is carried by constructed examples rather than a derivation. More importantly, the necessity claim relies on a hidden monotonicity assumption: that adding an uncertainty encoding always removes more interpretive ambiguity than it introduces. This assumption is doubtful given the paper's own citations [3,28], which show that viewers systematically misinterpret confidence intervals and error bars. Section 6.1.2 concedes that an uncertainty visualization does not ensure that viewers infer the author's intended reference distribution and that some audiences cannot reliably infer modeling assumptions from standard uncertainty displays. The logically supported conclusion is thus that uncertainty can reduce degrees of freedom under a specified interpretation model, not that it necessarily does. Because Section 6 presents this formalism as providing 'logical ground' against omission, this is a load-bearing issue.
- [Abstract vs. Section 8] The abstract states that uncertainty communication 'necessarily reduces degrees of freedom in viewers' statistical inferences,' but the Conclusion says that uncertainty 'reduces (though does not necessarily eliminate) degrees of freedom in viewers' inferences.' These are different claims, and the manuscript should state one consistent claim. The strong 'necessarily' version is what drives the argument against omission, while the weaker version is what the analysis in Section 6.1.2 actually supports. The discrepancy should be resolved by tempering the abstract and Section 6's stronger formulations.
- [Sections 3.1.2 and 7.0.1] The paper acknowledges in Section 3.1.2 and Section 7.0.1 that the survey and interview samples are convenience samples that likely overrepresent authors sympathetic to uncertainty visualization. This acknowledged limitation should be more carefully reflected in the scope of the rhetorical model. The three tenets in Section 5 are inferred from this sample, and the premise in Section 5.1 that uncertainty omission is a norm is supported partly by self-reported estimates from the same respondents. The empirical characterization is still a useful contribution, but the paper should frame the rhetorical model as a hypothesis about a specific population of social-media-recruited practitioners rather than as a general account of 'authors.'
- [Section 6.1] The formal argument assumes that viewers judge visualized signal strength through an implicit posterior predictive model check, with a reference distribution p(yrep|y) drawn from a 'seemingly infinite' space in the absence of uncertainty. This assumption is asserted and illustrated, not tested empirically or derived from first principles. If viewers do not perform such model comparisons, or if their implicit model space is narrow even without uncertainty, the formal conclusion does not follow. The paper could strengthen the argument by providing at least a minimal formal characterization of the relevant model space and the interpretation mapping from an uncertainty display to p(yrep|y).
- [Section 6.1.2] The sentence 'This reduces the amount of information that a viewer must mentally fill in, which would seem to necessarily reduce variance in interpretations across viewers' is a hedged intuition, not a proof. The hedge 'would seem to' indicates that the author is aware that the step is not fully demonstrated. The paper should either provide a concrete argument for why adding uncertainty information cannot introduce additional interpretive variance, or explicitly scope the claim to situations where viewers share the intended interpretation of the uncertainty encoding.
minor comments (5)
- [Section 3.2] 'In gain a deeper understanding' should be 'To gain a deeper understanding.'
- [Section 6.1] In the phrase 'T (rrep ) is drawn from a null plot distribution,' the symbol 'rrep' appears to be a typo for 'yrep.'
- [Section 6.1.2] 'in is unlikely that all audiences could reliably infer' should be 'it is unlikely that all audiences could reliably infer.'
- [Section 8] 'a formal model of of graphical statistical inference' contains a duplicated 'of.'
- [Section 6.1.2] 'permissable' should be 'permissible.'
Circularity Check
No significant circularity; the formal claim is an analytic adaptation of external graphical-inference theory, and the empirical results are self-contained.
full rationale
The paper's empirical contributions, including the survey/interview characterization and the rhetorical model of uncertainty omission, are grounded in participant responses and open coding rather than in the paper's own conclusions. The formal argument in Section 6 is explicitly presented as an adaptation of Gelman's external graphical-inference theory [24,25] and Buja et al. [6,7]; no parameter is fitted to a subset of data and then renamed a prediction, and no 'uniqueness theorem' is imported from the authors' own prior work. The claim that uncertainty representation constrains viewers' model space follows from the model's definitional setup: a viewer compares the visualization to an implicit reference distribution p(yrep|y), and encoding a reference distribution narrows the space of possible implicit models. This is an analytic conditional of the proposed framework, not a circular derivation, and the paper itself repeatedly concedes the limits of the claim. Section 6.1.2 states that 'an uncertainty visualization does not necessarily ensure that all viewers formulate T(yrep), p(yrep|y), or even T(y) in the same way,' and Section 8 softens the conclusion to 'uncertainty reduces (though does not necessarily eliminate) degrees of freedom in viewers' inferences.' The self-citations that appear, such as [29] for visualization rhetoric, [30] for uncertainty visualization evaluation, and [31,34,37] for uncertainty display techniques, are background references or pointers to prior technique papers; they are not load-bearing justifications of the central formal or empirical claims. No pattern of self-definition, fitted-input-called-prediction, self-citation-load-bearing, uniqueness-imported-from-authors, ansatz-smuggled-via-citation, or renaming-known-result is present. The main weakness is the strength of the word 'necessarily' in the abstract, but that is a correctness or scope concern about the argument's assumptions, not circularity.
Assumptions & free parameters
assumptions (4)
- domain assumption Uncertainty omission is a norm in communicative visualization (Section 5.1).
- domain assumption Viewers judge visualizations by implicit comparison to a reference distribution, modeled as a posterior predictive check (Section 6.1).
- domain assumption Without explicit uncertainty, the viewer's model space is 'seemingly infinite,' so uncertainty necessarily reduces degrees of freedom (Section 6.1.2).
- domain assumption Survey and interview respondents are sufficiently representative that their stated rationales reveal field-wide beliefs (Sections 3.1.2 and 7.0.1).
Cite this review
Pith. "Pith review of Why Authors Don't Visualize Uncertainty." pith.science (2026). https://pith.science/paper/HQ5YEXGN
@misc{pith2026190801697,
  author       = {Pith},
  title        = {Pith review of: Why Authors Don't Visualize Uncertainty},
  year         = {2026},
  howpublished = {\url{https://pith.science/paper/HQ5YEXGN}},
  note         = {Machine review of arXiv:1908.01697}
}
read the original abstract
Clear presentation of uncertainty is an exception rather than rule in media articles, data-driven reports, and consumer applications, despite proposed techniques for communicating sources of uncertainty in data. This work considers, Why do so many visualization authors choose not to visualize uncertainty? I contribute a detailed characterization of practices, associations, and attitudes related to uncertainty communication among visualization authors, derived from the results of surveying 90 authors who regularly create visualizations for others as part of their work, and interviewing thirteen influential visualization designers. My results highlight challenges that authors face and expose assumptions and inconsistencies in beliefs about the role of uncertainty in visualization. In particular, a clear contradiction arises between authors' acknowledgment of the value of depicting uncertainty and the norm of omitting direct depiction of uncertainty. To help explain this contradiction, I present a rhetorical model of uncertainty omission in visualization-based communication. I also adapt a formal statistical model of how viewers judge the strength of a signal in a visualization to visualization-based communication, to argue that uncertainty communication necessarily reduces degrees of freedom in viewers' statistical inferences. I conclude with recommendations for how visualization research on uncertainty communication could better serve practitioners' current needs and values while deepening understanding of assumptions that reinforce uncertainty omission.
Figures

Figures from the paper (2 more)
Reference graph
Works this paper leans on
- [1]
-
[2]
R. Beecham, J. Dykes, W. Meulemans, A. Slingsby, C. Turkay, and J. Wood. Map lineups: effects of spatial structure on graphical inference. IEEE transactions on visualization and computer graphics , 23(1):391– 400, 2016
work page 2016
- [3]
-
[4]
N. Boukhelifa and D. J. Duke. Uncertainty visualization: why might it fail? In CHI’09 Extended Abstracts on Human Factors in Computing Systems, pages 4051–4056. ACM, 2009
work page 2009
-
[5]
N. Boukhelifa, M.-E. Perrin, S. Huron, and J. Eagan. How data work- ers cope with uncertainty: A task characterisation study. In Proceedings of the 2017 CHI Conference on Human Factors in Computing Systems , pages 3645–3656. ACM, 2017
work page 2017
-
[6]
A. Buja, D. Asimov, C. Hurley, and J. A. McDonald. Elements of a viewing pipeline for data analysis. Dynamic graphics for statistics, pages 277–308, 1988
work page 1988
-
[7]
A. Buja, D. Cook, H. Hofmann, M. Lawrence, E.-K. Lee, D. F. Swayne, and H. Wickham. Statistical inference for exploratory data analysis and model diagnostics. Philosophical Transactions of the Royal Society A: Mathematical, Physical and Engineering Sciences , 367(1906):4361– 4383, 2009
work page 1906
-
[8]
A. Buja, D. Cook, and D. Swayne. Inference for data visualization. In Joint Statistics Meetings, August, 1999
work page 1999
Show all 55 references
-
[9]
Correll and M
M. Correll and M. Gleicher. Error bars considered harmful: Exploring al- ternate encodings for mean and error.Visualization and Computer Graph- ics, IEEE Transactions on, 20(12):2142–2151, 2014
2014
-
[10]
Correll, D
M. Correll, D. Moritz, and J. Heer. Value-suppressing uncertainty palettes. In Proceedings of the 2018 CHI Conference on Human Factors in Computing Systems, page 642. ACM, 2018
2018
-
[11]
J. W. Creswell, W. E. Hanson, V . L. Clark Plano, and A. Morales. Qual- itative research designs: Selection and implementation. The counseling psychologist, 35(2):236–264, 2007
2007
-
[12]
T. J. Davis and C. P. Keller. Modelling and visualizing multiple spatial uncertainties. Computers & Geosciences, 23(4):397–408, 1997
1997
-
[13]
de Finetti
B. de Finetti. Probabilities of probabilities: A real problem or a misun- derstanding. New Developments in the Applications of Bayesian methods, pages 1–10, 1977
1977
-
[14]
C. R. Ehlschlaeger, A. M. Shortridge, and M. F. Goodchild. Visualiz- ing spatial data uncertainty using animation. Computers & Geosciences, 23(4):387–395, 1997
1997
-
[15]
Erev and B
I. Erev and B. L. Cohen. Verbal versus numerical probabilities: Effi- ciency, biases, and the preference paradox. Organizational behavior and human decision processes, 45(1):1–18, 1990
1990
-
[16]
Fernandes, L
M. Fernandes, L. Walls, S. Munson, J. Hullman, and M. Kay. Uncertainty displays using quantile dotplots or cdfs improve transit decision-making. In Proceedings of the 2018 CHI Conference on Human Factors in Com- puting Systems, page 144. ACM, 2018
2018
-
[17]
Finger and A
R. Finger and A. M. Bisantz. Utilizing graphical formats to convey un- certainty in a decision-making task. Theoretical Issues in Ergonomics Science, 3(1):1–25, 2002
2002
-
[18]
Fischhoff
B. Fischhoff. Risk perception and communication unplugged: twenty years of process 1. Risk analysis, 15(2):137–145, 1995
1995
-
[19]
Fischhoff
B. Fischhoff. Communicating uncertainty fulfilling the duty to inform. Issues in Science and Technology, 28(4):63–70, 2012
2012
-
[20]
Fischhoff and A
B. Fischhoff and A. L. Davis. Communicating scientific uncertainty. Proceedings of the National Academy of Sciences , 111(Supplement 4):13664–13671, 2014
2014
-
[21]
Fischhoff and D
B. Fischhoff and D. MacGregor. Subjective confidence in forecasts. Jour- nal of Forecasting, 1(2):155–172, 1982
1982
-
[22]
Fischhoff, P
B. Fischhoff, P. Slovic, and S. Lichtenstein. Knowing with certainty: The appropriateness of extreme confidence. Journal of Experimental Psychol- ogy: Human perception and performance, 3(4):552, 1977
1977
-
[23]
Gabry, D
J. Gabry, D. Simpson, A. Vehtari, M. Betancourt, and A. Gelman. Visu- alization in bayesian workflow. Journal of the Royal Statistical Society: Series A (Statistics in Society), 182(2):389–402, 2019
2019
-
[24]
A. Gelman. A bayesian formulation of exploratory data analysis and goodness-of-fit testing*. International Statistical Review, 71(2):369–382, 2003
2003
-
[25]
A. Gelman. Exploratory data analysis for complex models. Journal of Computational and Graphical Statistics, 13(4):755–779, 2004
2004
-
[26]
D. M. Green, J. A. Swets, et al. Signal detection theory and psy- chophysics, volume 1. Wiley New York, 1966
1966
-
[27]
Griethe and H
H. Griethe and H. Schumann. The visualization of uncertain data: Meth- ods and problems. In SimVis, pages 143–156, 2006
2006
-
[28]
Hoekstra, R
R. Hoekstra, R. D. Morey, J. N. Rouder, and E.-J. Wagenmakers. Robust misinterpretation of confidence intervals. Psychonomic bulletin & review, 21(5):1157–1164, 2014
2014
-
[29]
Hullman and N
J. Hullman and N. Diakopoulos. Visualization rhetoric: Framing effects in narrative visualization. IEEE transactions on visualization and com- puter graphics, 17(12):2231–2240, 2011
2011
-
[30]
Hullman, X
J. Hullman, X. Qiao, M. Correll, A. Kale, and M. Kay. In pursuit of error: A survey of uncertainty visualization evaluation. IEEE transactions on visualization and computer graphics, 25(1):903–913, 2019
2019
-
[31]
Hullman, P
J. Hullman, P. Resnick, and E. Adar. Hypothetical outcome plots outper- form error bars and violin plots for inferences about reliability of variable ordering. PloS one, 10(11):e0142444, 2015
2015
-
[32]
C. R. Johnson and A. R. Sanderson. A next step: Visualizing errors and uncertainty. IEEE Computer Graphics and Applications , 23(5):6– 10, 2003
2003
-
[33]
A. Kale, M. Kay, and J. Hullman. Decision-making under uncertainty in research synthesis: Designing for the garden of forking paths. 2019
2019
-
[34]
A. Kale, F. Nguyen, M. Kay, and J. Hullman. Hypothetical outcome plots help untrained observers judge trends in ambiguous data. IEEE transactions on visualization and computer graphics, 2018
2018
-
[35]
M. Kay, T. Kola, J. R. Hullman, and S. A. Munson. When (ish) is my bus?: User-centered visualizations of uncertainty in everyday, mobile pre- dictive systems. In Proceedings of the 2016 CHI Conference on Human Factors in Computing Systems, pages 5092–5103. ACM, 2016
2016
-
[36]
M. W. Khaw, Z. Li, and M. Woodford. Risk aversion as a perceptual bias. Technical report, National Bureau of Economic Research, 2017
2017
-
[37]
Y .-S. Kim, L. Walls, P. Krafft, and J. Hullman. A bayesian cognition approach to improve data visualization. In Proceedings of the 2019 CHI Conference on Human Factors in Computing Systems. ACM, 2019
2019
-
[38]
Lichtenstein, B
S. Lichtenstein, B. Fischhoff, and L. D. Phillips. Calibration of proba- bilities: The state of the art to 1980. Technical report, DECISION RE- SEARCH EUGENE OR, 1981
1980
-
[39]
Lipschitz and O
R. Lipschitz and O. Strauss. Coping with uncertainty: a naturalistic decision-making process. Organizational Behavior and Human Decision Processes, 69(2):149–163, 1997
1997
-
[40]
A. M. MacEachren. Visualizing uncertain information. Cartographic Perspectives, (13):10–19, 1992
1992
-
[41]
Majumder, H
M. Majumder, H. Hofmann, and D. Cook. Validation of visual statistical inference, applied to linear models. Journal of the American Statistical Association, 108(503):942–956, 2013
2013
-
[42]
C. F. Manski. Communicating uncertainty in official economic statistics: an appraisal fifty years after morgenstern. Journal of Economic Litera- ture, 53(3):631–53, 2015
2015
-
[43]
C. F. Manski. Communicating uncertainty in policy analysis. Proceed- ings of the National Academy of Sciences, page 201722389, 2018
2018
-
[44]
C. F. Manski. The lure of incredible certitude. Technical report, National Bureau of Economic Research, 2018
2018
-
[45]
General government debt (indicator), 2019
OECD. General government debt (indicator), 2019
2019
-
[46]
M. J. Olson and D. V . Budescu. Patterns of preference for numerical and verbal probabilities. Journal of Behavioral Decision Making, 10(2):117– 131, 1997
1997
-
[47]
A. T. Pang, C. M. Wittenbrink, and S. K. Lodha. Approaches to uncer- tainty visualization. The Visual Computer, 13(8):370–390, 1997
1997
-
[48]
Political polarization in the american public, 2014
Pew Foundation. Political polarization in the american public, 2014
2014
-
[49]
Potter, M
K. Potter, M. Kirby, D. Xiu, and C. R. Johnson. Interactive visualization of probability and cumulative density functions.International journal for uncertainty quantification, 2(4), 2012
2012
-
[50]
C. D. Schunn and J. G. Trafton. The psychology of uncertainty in scien- tific data analysis. Handbook of the psychology of science, page 461e483, 2012
2012
-
[51]
Skeels, B
M. Skeels, B. Lee, G. Smith, and G. G. Robertson. Revealing uncer- tainty for information visualization. Information Visualization, 9(1):70– 81, 2010
2010
-
[52]
Thomson, E
J. Thomson, E. Hetzler, A. MacEachren, M. Gahegan, and M. Pavel. A typology for visualizing uncertainty. In Electronic Imaging 2005, pages 146–157. International Society for Optics and Photonics, 2005
2005
-
[53]
M. Webster. Communicating climate change uncertainty to policy- makers and the public. Climatic Change, 61(1):1–8, 2003
2003
-
[54]
Wickham, D
H. Wickham, D. Cook, H. Hofmann, and A. Buja. Graphical inference for infovis. IEEE Transactions on Visualization and Computer Graphics, 16(6):973–979, 2010
2010
-
[55]
C. M. Wittenbrink, A. T. Pang, and S. K. Lodha. Glyphs for visualiz- ing uncertainty in vector fields. IEEE transactions on Visualization and Computer Graphics, 2(3):266–279, 1996
1996
Reviewed August 14, 2026 · model on record in the stance chip above.
Discussion (0). Continue with ORCID to comment.