REVIEW 2 major objections 5 minor 60 references
Dusty Cloud Acceleration with Multiband Radiation
T0 review · 2 major / 5 minor · reviewed 2026-08-14 · deepseek-v4-flash
Pith's one-line read Even a modest ultraviolet component, 5–10 percent of the infrared flux, compresses and disrupts cold dusty clouds so that radiation pressure destroys most dust before the cloud can be significantly accelerated.
desk verdict First systematic multiband UV+IR radiation-hydrodynamics study of dusty cloud acceleration; clean numerics and a plausible sharp UV-disruption threshold, but with an unsecured assumption about dust survival above 1500 K. read the letter →
The pith
A machine-rendered reading of the paper's core claim, the machinery that carries it, and where it could break.
The reading
What carries the argument
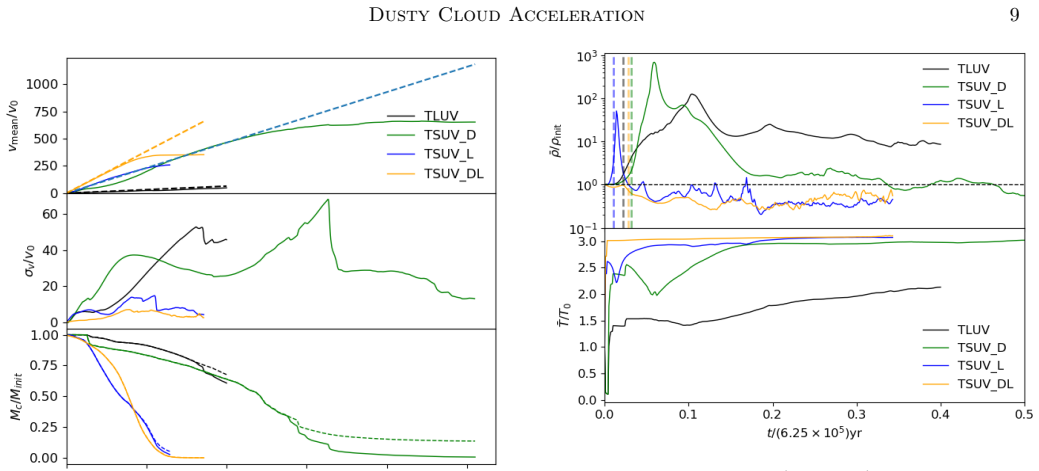
The load-bearing object is the two-band radiation-hydrodynamics setup with a passive dust tracer $s$ that marks cold dusty gas and is set to zero in cells above 1500 K, the assumed dust destruction/decoupling temperature; this tracer defines the cloud mass and the survival time. The dynamical mechanism is differential ultraviolet radiation pressure: with UV opacity $\kappa_{\rm uv}=100\,{\rm cm^2\,g^{-1}}$ versus a low, temperature-dependent Rosseland mean IR opacity, self-shielding makes the illuminated face of the cloud accelerate more than the shielded interior, giving a radiation crushing timescale $t_{\rm rad} = \sqrt{D_c/\Delta a_{\rm uv}}$. The paper uses this timescale, together with the mass-loss curves from the simulations, to argue that compression, re-expansion, and mixing with hot gas—not direct UV heating—destroy the cloud before significant bulk acceleration.
What would settle it
Run the TLMF 10 setup with the dust destruction/decoupling temperature raised to roughly $10^4$ K (or with an explicit grain-sputtering model); if the cloud then retains most of its mass while accelerating past 100 km/s, the 1500 K cutoff is the load-bearing assumption rather than a robust dynamical effect.
Extended reading notes
Core claim
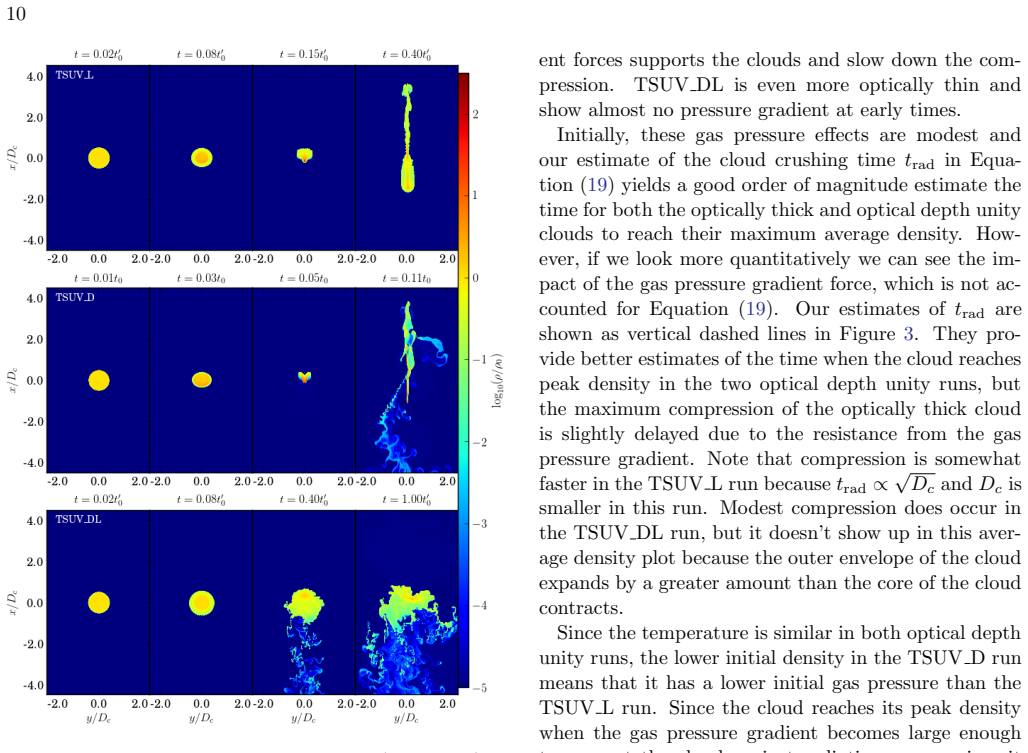
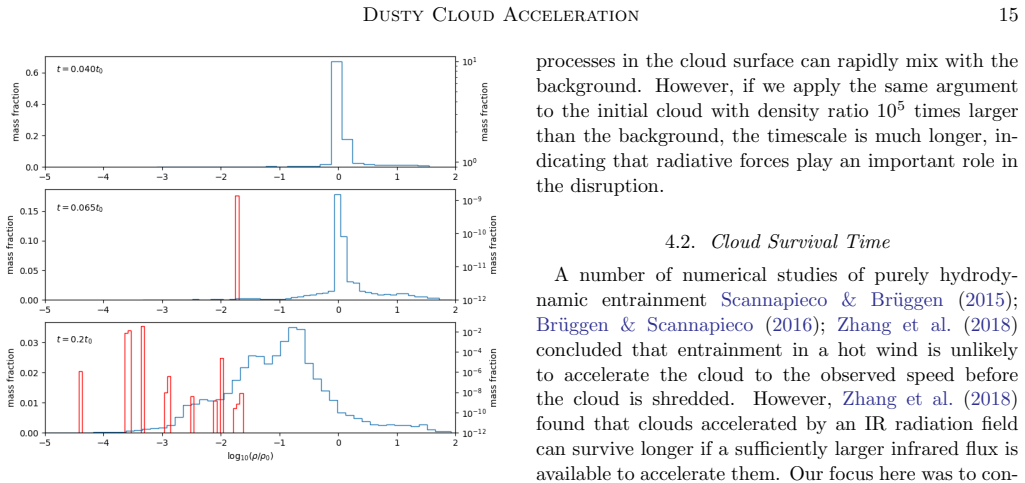
On the paper's own terms, the central discovery is that replacing or supplementing infrared radiation with ultraviolet radiation is generally detrimental to dusty cloud survival. Because the cloud is optically thick to UV but optically thin to IR, the UV flux is absorbed near the illuminated surface, creating a radiation-pressure gradient that crushes the cloud; gas pressure then drives re-expansion, and the resulting shear and Rayleigh-Taylor/Kelvin-Helmholtz instabilities mix the outer dusty layers with the hot background, raising them above the assumed 1500 K dust destruction temperature and removing them from the dusty-gas mass. Efficient IR cooling keeps the bulk of the gas near radiative equilibrium (below about 100 K), so destruction is dynamical rather than thermal. Even when UV is only 5–10 percent of the IR flux, this compression–re-expansion–mixing cycle shortens survival to roughly the radiation crushing timescale, whereas IR-only clouds retain most of their mass after several dynamical times and reach comparable velocities. The authors conclude that radiation pressure is most effective when the driving light has been reprocessed into the infrared.
Load-bearing premise
The claim that ultraviolet light destroys clouds before they can be accelerated rests on the assumption that dust is destroyed and decoupled from the gas once mixed gas exceeds about 1500 K.
Editorial extensions
If this is right
- Radiation-pressure driving of cold molecular outflows will be most efficient in highly obscured galaxies (ULIRGs and high-redshift star formers) where most stellar light is reprocessed into the infrared.
- In UV-dominated starbursts, cold dusty clouds are shredded within about $10^5$ years and travel only a few parsecs, so they cannot explain the hundreds-of-km/s outflows seen at large radii.
- Even a UV flux as small as 5–10 percent of the IR flux can cut cloud survival time dramatically, because the UV triggers the compression–re-expansion mixing cycle even when it contributes little to bulk acceleration.
- IR-only acceleration converts incident momentum into cloud momentum with relatively little disruption, reaching roughly 138 km/s with most of the initial mass intact after $2.5\times10^5$ yr in the fiducial case.
- Lower UV optical depth makes acceleration faster but disruption also faster, so optically thin UV-driven clouds reach higher velocities yet still lose most of their dusty mass.
Reading between the lines
- A more realistic treatment of grain destruction (e.g., sputtering as grains traverse hot gas) would likely smooth the sharp 1500 K cutoff; because the simulations find that gas crossing 500 K continues heating to above $10^5$ K, the qualitative conclusion should survive, but quantitative survival times could shift.
- The same compression–re-expansion mechanism should operate in cosmic-ray or hot-wind entrainment contexts whenever an external force accelerates the cloud surface faster than its interior; the survival-time metric used here could be adapted to compare driving mechanisms.
- Photoionization, which is neglected, would destroy CO and H$_2$ in the UV-illuminated envelope even where dust survives, so the effective molecular-cloud survival time in UV-rich environments is likely shorter than the dusty-gas survival time reported here.
- The sharp difference between the 1 percent and 5 percent UV-fraction runs suggests an observable diagnostic: galaxies with molecular outflows whose clouds appear filamentary and clumpy may be revealing UV contamination, whereas smoother, longer-lived clouds indicate IR-dominated driving.
Signed reviews
Editorial analysis
A structured set of objections, weighed in public.
Referee Report
Summary. This paper uses two-dimensional and three-dimensional radiation hydrodynamics simulations with Athena++ to study the acceleration of cold, dusty clouds by ultraviolet (UV) and infrared (IR) radiation fields. It introduces a two-band radiation treatment with a passive dust tracer that is destroyed/decoupled above 1500 K, and it analyzes cloud compression, mixing, mass loss, and bulk acceleration. The central finding is that UV radiation, even at about 5-10% of the IR flux, drives a compression/re-expansion cycle that enhances mixing with hot background gas, so that most dusty gas is destroyed before large velocities and flying distances are reached. IR-dominated fields accelerate clouds more gently and preserve them longer. The paper includes analytic estimates for acceleration, equilibrium temperature, and crushing time, and presents resolution, dimensionality, and reduced-speed-of-light checks.
Significance. If the central result holds, it refines previous IR-only radiation-pressure studies by showing that modest UV contamination can reverse the survival advantage of radiation-pressure-driven clouds. This is directly relevant to interpreting molecular outflows in ULIRGs and high-redshift star-forming galaxies, where the UV fraction in launch regions is uncertain. The paper's strengths are its systematic parameter survey, explicit numerical checks in Section 3.4, and parameter-free analytic estimates (Eqs. 17-19) that compare well with simulations. The identified destruction mechanism is physical: radiation-pressure-driven compression and mixing, not direct UV heating, destroys the cloud. The main caveat is that the survival diagnostic is tied to a single assumed dust destruction temperature with one-sided sensitivity tests.
major comments (2)
- [Sections 2.1 and 4.1] The dust destruction/decoupling temperature T_dest = 1500 K is load-bearing for the central claim. The passive scalar s is reset to zero in any cell above 1500 K, which both removes that gas from Mc in Eq. (12) and removes its UV/IR opacity from the radiation force via s in Eq. (9). The sensitivity tests described in Section 4.1 vary the threshold downward to 500 K and 1000 K; the argument that gas reaching 500 K quickly exceeds 1500 K explains why lowering the threshold does not matter. It does not, however, test the opposite direction: if dust survives or remains coupled above 1500 K, or if unresolved cold clumps persist in cells whose mean temperature exceeds 1500 K, the surviving mass and flying distance would be larger. Since the abstract and Section 5 conclude that most dust is destroyed before significant acceleration, this assumption should be probed with a higher threshold (e.g., 3000 K) or with a density-dependent decoupling prescription, and the resulting Mc(t), v_mean(t), and flying distance should be reported.
- [Section 3.4, Figures 10 and 12] The resolution and dimensionality checks are reassuring at the qualitative level, but the paper's central survival metric is Mc(t). Figure 12 shows that the peak mean density increases monotonically with resolution, and the text acknowledges that the core is not resolved at maximum compression; the 3D run is performed at the resolution of the low-resolution 2D run. Because the rate at which mass is stripped from the core into the mixing layer sets Mc(t), the authors should provide a quantitative comparison of Mc/Mc,0 at selected times (or of the half-mass survival time) for TLUV, TLUV LR, TLUV HR, and TLUV 3D, and state explicitly whether the mass-loss rate converges.
minor comments (5)
- [Section 2.1, Eq. (10)] The passive scalar equation has no source term, but the text describes a reset of s to zero above 1500 K; please state that this is applied as an operator-split or post-step reset so the numerical implementation is unambiguous.
- [Figure 2 caption] The caption says 'excepting TLUV D and TLUV L has the same a', but those run names do not appear in Table 1; the reference should be to TSUV D and TSUV L.
- [Throughout] There are several typographical errors that should be corrected: 'preformed' in Section 3, 'Gallilean' in Section 2.2, 'Kelvin-Helmholz' in Section 3.1, and 'lines of site' in Section 3.3.
- [Section 4.1 and Section 3.4] The phrase 'only a modest fraction is a temperatures significantly higher' should read 'at temperatures', and 'follow show little variation' in Section 3.4 should be reworded.
- [Equation (18)] The factor of 2 relating E_uv to F_uv/c is introduced without derivation; a one-line explanation would help readers reproduce the Teq estimate.
Circularity Check
No significant circularity: the UV-disruption finding is an independent simulation outcome, and the 1500 K dust-decoupling reset is a modeling assumption rather than a circular input.
full rationale
The derivation chain is self-contained. The analytic estimates in Eqs. (17)-(19) are parameter-free expressions derived from the adopted opacities, fluxes, and cloud geometry, and the simulations are evolved from stated initial conditions rather than tuned to the conclusion. The central UV-disruption result emerges from simulated compression, re-expansion, and mixing with the hot background, not from the definition of the survival metric; the passive-scalar reset at 1500 K is an assumed dust-destruction/decoupling prescription with external microphysical motivation and one-sided sensitivity tests at 500 K and 1000 K, which is a modeling caveat rather than a reduction of the conclusion to its inputs. Self-citations to Zhang et al. (2018) and related prior work supply the IR-only baseline, the survival-time definition, and some setup choices, but the paper re-runs IR-only cases (TLIR E and TLIR H) independently and the new UV and multiband runs are not forced by those citations. No fitted parameter is renamed as a prediction, and no load-bearing step invokes a self-cited uniqueness theorem. No circular step can be exhibited from the paper's equations or quoted text.
Assumptions & free parameters
free parameters (5)
- UV opacity kappa_uv =
100 cm^2/g
- IR opacity normalization =
10^-3/2 (T/10K)^2 cm^2/g, constant 10^1/2 cm^2/g above 100K
- Dust destruction/decoupling temperature T_dest =
1500K
- Reduced speed of light factor R =
0.01 (0.001 in TLUV R)
- Fiducial incident UV flux F_uv =
1.4 F0 = 4.9e12 L_sun/kpc^2
assumptions (5)
- domain assumption Initial cloud is in pressure equilibrium with a hot, diffuse background (density contrast 10^5)
- domain assumption Rosseland mean opacity approximation for IR dust opacity (Krumholz & Thompson 2012)
- ad hoc to paper Dust is perfectly coupled to gas below 1500K and is destroyed/decoupled above 1500K
- domain assumption Reduced speed of light approximation (R=0.01) preserves the ordering of characteristic timescales
- domain assumption Neglect of self-gravity, magnetic fields, photoionization, conduction, and scattering opacity
Cite this review
Pith. "Pith review of Dusty Cloud Acceleration with Multiband Radiation." pith.science (2026). https://pith.science/paper/C6ZZ5T6Y
@misc{pith2026190801775,
  author       = {Pith},
  title        = {Pith review of: Dusty Cloud Acceleration with Multiband Radiation},
  year         = {2026},
  howpublished = {\url{https://pith.science/paper/C6ZZ5T6Y}},
  note         = {Machine review of arXiv:1908.01775}
}
abstract
We perform two-dimensional and three-dimensional simulations of cold, dense clouds, which are accelerated by radiation pressure on dust relative to a hot, diffuse background gas. We examine the relative effectiveness of acceleration by ultraviolet and infrared radiation fields, both independently and acting simultaneously on the same cloud. We study clouds that are optically thin to infrared emission but with varying ultraviolet optical depths. Consistent with previous work, we find relatively efficient acceleration and long cloud survival times when the infrared band flux dominates over the ultraviolet flux. However, when ultraviolet is dominant or even a modest percentage ($\sim 5-10$\%) of the infrared irradiating flux, it can act to compress the cloud, first crushing it and then disrupting the outer layers. This drives mixing of outer regions of the dusty gas with the hot diffuse background to the point where most dust is not likely to survive or stay coupled to the gas. Hence, the cold cloud is unable to survive for a long enough timescale to experience significant acceleration before disruption even though efficient infrared cooling keeps the majority of the gas close to radiative equilibrium temperature ($T \lesssim 100$K). We discuss implications for observed systems, concluding that radiation pressure driving is most effective when the light from star-forming regions is efficiently reprocessed into the infrared.
Figures

Figures from the paper (10 more)




Reference graph
Works this paper leans on
-
[1]
2001, ApJL, 556, L11, doi: 10.1086/322860 Banda-Barrag´ an, W
Weinberg, D. 2001, ApJL, 556, L11, doi: 10.1086/322860 Banda-Barrag´ an, W. E., Parkin, E. R., Federrath, C.,
doi:10.1086/322860 2001
-
[2]
Crocker, R. M., & Bicknell, G. V. 2016, MNRAS, 455, 1309, doi: 10.1093/mnras/stv2405
- [3]
-
[4]
Benson, A. J., Bower, R. G., Frenk, C. S., et al. 2003, ApJ, 599, 38, doi: 10.1086/379160
doi:10.1086/379160 2003
-
[5]
Bolatto, A. D., Warren, S. R., Leroy, A. K., et al. 2013, Nature, 499, 450, doi: 10.1038/nature12351
-
[7]
Bruls, J. H. M. J., Vollm¨ oller, P., & Sch¨ ussler, M. 1999, A&A, 348, 233
work page 1999
-
[8]
Chevalier, R. A., & Clegg, A. W. 1985, Nature, 317, 44, doi: 10.1038/317044a0
doi:10.1038/317044a0 1985
-
[9]
2014, A&A, 562, A21, doi: 10.1051/0004-6361/201322464 Dusty Cloud Acceleration 19
Cicone, C., Maiolino, R., Sturm, E., et al. 2014, A&A, 562, A21, doi: 10.1051/0004-6361/201322464 Dusty Cloud Acceleration 19
Show all 60 references
-
[10]
W., Jiang, Y.-F., Stone, J
Davis, S. W., Jiang, Y.-F., Stone, J. M., & Murray, N. 2014, ApJ, 796, 107, doi: 10.1088/0004-637X/796/2/107
2014 doi
-
[11]
Draine, B. T. 2011, ApJ, 732, 100, doi: 10.1088/0004-637X/732/2/100
2011 doi
-
[12]
Erb, D. K. 2008, ApJ, 674, 151, doi: 10.1086/524727
2008 doi
-
[13]
Fabian, A. C. 2012, ARA&A, 50, 455, doi: 10.1146/annurev-astro-081811-125521
2012 doi
-
[14]
2008, MNRAS, 385, 2181, doi: 10.1111/j.1365-2966.2008.12991.x
Finlator, K., & Dav´ e, R. 2008, MNRAS, 385, 2181, doi: 10.1111/j.1365-2966.2008.12991.x
2008
-
[15]
E., Tremonti, C., Diamond-Stanic, A
Geach, J. E., Tremonti, C., Diamond-Stanic, A. M., et al. 2018, ApJL, 864, L1, doi: 10.3847/2041-8213/aad8b6
2018 doi
-
[16]
M., & Best, P
Heckman, T. M., & Best, P. N. 2014, ARA&A, 52, 589, doi: 10.1146/annurev-astro-081913-035722
2014 doi
-
[17]
2000, ApJS, 129, 493, doi: 10.1086/313421
Armus, L. 2000, ApJS, 129, 493, doi: 10.1086/313421
2000 doi
-
[18]
F., Quataert, E., & Murray, N
Hopkins, P. F., Quataert, E., & Murray, N. 2012, MNRAS, 421, 3522, doi: 10.1111/j.1365-2966.2012.20593.x
2012
-
[19]
Ipavich, F. M. 1975, ApJ, 196, 107, doi: 10.1086/153397
1975 doi
-
[20]
M., & Davis, S
Jiang, Y.-F., Stone, J. M., & Davis, S. W. 2014, ApJS, 213, 7, doi: 10.1088/0067-0049/213/1/7
2014 doi
-
[21]
Kim, J.-G., Kim, W.-T., & Ostriker, E. C. 2016, ApJ, 819, 137, doi: 10.3847/0004-637X/819/2/137 —. 2018, ApJ, 859, 68, doi: 10.3847/1538-4357/aabe27
2016 doi
-
[22]
I., McKee, C
Klein, R. I., McKee, C. F., & Colella, P. 1994, ApJ, 420, 213, doi: 10.1086/173554
1994 doi
-
[23]
D., Walter, F., et al
Krieger, N., Bolatto, A. D., Walter, F., et al. 2019, arXiv e-prints, arXiv:1907.00731. https://arxiv.org/abs/1907.00731
2019 arXiv
-
[24]
R., & Thompson, T
Krumholz, M. R., & Thompson, T. A. 2012, ApJ, 760, 155, doi: 10.1088/0004-637X/760/2/155 —. 2013, MNRAS, 434, 2329, doi: 10.1093/mnras/stt1174
2012 doi
-
[25]
K., Walter, F., Martini, P., et al
Leroy, A. K., Walter, F., Martini, P., et al. 2015, ApJ, 814, 83, doi: 10.1088/0004-637X/814/2/83
2015 doi
-
[26]
Martin, C. L. 1998, ApJ, 506, 222, doi: 10.1086/306219 —. 2005, ApJ, 621, 227, doi: 10.1086/427277
1998 doi
-
[27]
2015, MNRAS, 449, 2, doi: 10.1093/mnras/stv355
Quataert, E. 2015, MNRAS, 449, 2, doi: 10.1093/mnras/stv355
2015 doi
-
[28]
2016, A&A, 593, A30, doi: 10.1051/0004-6361/201628978 Mu˜ noz-Vergara, D., Nagar, N
Rupke, D. 2016, A&A, 593, A30, doi: 10.1051/0004-6361/201628978 Mu˜ noz-Vergara, D., Nagar, N. M., Ramakrishnan, V., et al. 2019, MNRAS, 487, 3679, doi: 10.1093/mnras/stz1572
2016 doi
-
[29]
Murray, N., M´ enard, B., & Thompson, T. A. 2011, ApJ, 735, 66, doi: 10.1088/0004-637X/735/1/66
2011 doi
-
[30]
Murray, N., Quataert, E., & Thompson, T. A. 2005, ApJ, 618, 569, doi: 10.1086/426067
2005 doi
-
[31]
2014, MNRAS, 443, 2018, doi: 10.1093/mnras/stu1271
Namekata, D., Umemura, M., & Hasegawa, K. 2014, MNRAS, 443, 2018, doi: 10.1093/mnras/stu1271
2014 doi
-
[32]
B., Morganti, R., et al
Oosterloo, T., Raymond Oonk, J. B., Morganti, R., et al. 2017, A&A, 608, A38, doi: 10.1051/0004-6361/201731781
2017 doi
-
[33]
D., Dav´ e, R., Kereˇ s, D., et al
Oppenheimer, B. D., Dav´ e, R., Kereˇ s, D., et al. 2010, MNRAS, 406, 2325, doi: 10.1111/j.1365-2966.2010.16872.x
2010
-
[34]
B., Hollenbach, D., Beckwith, S., et al
Pollack, J. B., Hollenbach, D., Beckwith, S., et al. 1994, ApJ, 421, 615, doi: 10.1086/173677
1994 doi
-
[35]
2014, ApJ, 780, 51, doi: 10.1088/0004-637X/780/1/51
Smith, D. 2014, ApJ, 780, 51, doi: 10.1088/0004-637X/780/1/51
2014 doi
-
[36]
2015, ApJ, 804, 137, doi: 10.1088/0004-637X/804/2/137
Proga, D., & Waters, T. 2015, ApJ, 804, 137, doi: 10.1088/0004-637X/804/2/137
2015 doi
-
[37]
2013, MNRAS, 428, 2966, doi: 10.1093/mnras/sts243
Puchwein, E., & Springel, V. 2013, MNRAS, 428, 2966, doi: 10.1093/mnras/sts243
2013 doi
-
[38]
C., & Skinner, M
Raskutti, S., Ostriker, E. C., & Skinner, M. A. 2016, ApJ, 829, 130, doi: 10.3847/0004-637X/829/2/130
2016 doi
-
[39]
L., Krumholz, M
Rosen, A. L., Krumholz, M. R., McKee, C. F., & Klein, R. I. 2016, MNRAS, 463, 2553, doi: 10.1093/mnras/stw2153
2016 doi
-
[40]
S., Veilleux, S., & Sanders, D
Rupke, D. S., Veilleux, S., & Sanders, D. B. 2002, ApJ, 570, 588, doi: 10.1086/339789
2002 doi
-
[41]
K., & Zweibel, E
Ruszkowski, M., Yang, H.-Y. K., & Zweibel, E. 2017, ApJ, 834, 208, doi: 10.3847/1538-4357/834/2/208
2017 doi
-
[42]
2015, ApJ, 805, 158, doi: 10.1088/0004-637X/805/2/158
Scannapieco, E., & Br¨ uggen, M. 2015, ApJ, 805, 158, doi: 10.1088/0004-637X/805/2/158
2015 doi
-
[43]
2018, A&A, 617, A38, doi: 10.1051/0004-6361/201833108
Schulz, R., Morganti, R., Nyland, K., et al. 2018, A&A, 617, A38, doi: 10.1051/0004-6361/201833108
2018 doi
-
[44]
2003, A&A, 410, 611, doi: 10.1051/0004-6361:20031279
Sedlmayr, E. 2003, A&A, 410, 611, doi: 10.1051/0004-6361:20031279
2003 doi
-
[45]
L., & Bland-Hawthorn, J
Shopbell, P. L., & Bland-Hawthorn, J. 1998, ApJ, 493, 129, doi: 10.1086/305108
1998 doi
-
[46]
A., & Ostriker, E
Skinner, M. A., & Ostriker, E. C. 2013, ApJS, 206, 21, doi: 10.1088/0067-0049/206/2/21 —. 2015, ApJ, 809, 187, doi: 10.1088/0004-637X/809/2/187
2013 doi
-
[47]
W., & Ramirez-Ruiz, E
Socrates, A., Davis, S. W., & Ramirez-Ruiz, E. 2008, ApJ, 687, 202, doi: 10.1086/590046
2008 doi
-
[48]
S., Aravena, M., B´ ethermin, M., et al
Spilker, J. S., Aravena, M., B´ ethermin, M., et al. 2018, Science, 361, 1016, doi: 10.1126/science.aap8900
2018 doi
-
[49]
K., & Heckman, T
Strickland, D. K., & Heckman, T. M. 2007, ApJ, 658, 258, doi: 10.1086/511174 —. 2009, ApJ, 697, 2030, doi: 10.1088/0004-637X/697/2/2030
2007 doi
-
[50]
2019, MNRAS, 488, 1813, doi: 10.1093/mnras/stz1755
Batcheldor, D. 2019, MNRAS, 488, 1813, doi: 10.1093/mnras/stz1755
2019 doi
-
[51]
A., Quataert, E., Zhang, D., & Weinberg, D
Thompson, T. A., Quataert, E., Zhang, D., & Weinberg, D. H. 2016, MNRAS, 455, 1830, doi: 10.1093/mnras/stv2428 20
2016 doi
-
[52]
T.-H., & Milosavljevi´ c, M
Tsang, B. T.-H., & Milosavljevi´ c, M. 2015, MNRAS, 453, 1108, doi: 10.1093/mnras/stv1707
2015 doi
-
[53]
2005, ARA&A, 43, 769, doi: 10.1146/annurev.astro.43.072103.150610
Veilleux, S., Cecil, G., & Bland-Hawthorn, J. 2005, ARA&A, 43, 769, doi: 10.1146/annurev.astro.43.072103.150610
2005 arXiv
-
[54]
Veilleux, S., Rupke, D. S. N., & Swaters, R. 2009, ApJL, 700, L149, doi: 10.1088/0004-637X/700/2/L149
2009 doi
-
[55]
D., Leroy, A
Walter, F., Bolatto, A. D., Leroy, A. K., et al. 2017, ApJ, 835, 265, doi: 10.3847/1538-4357/835/2/265
2017 doi
-
[56]
2016, MNRAS, 460, L79, doi: 10.1093/mnrasl/slw056
Waters, T., & Proga, D. 2016, MNRAS, 460, L79, doi: 10.1093/mnrasl/slw056
2016 doi
-
[57]
G., & Ruszkowski, M
Wiener, J., Zweibel, E. G., & Ruszkowski, M. 2019, arXiv e-prints, arXiv:1903.01471. https://arxiv.org/abs/1903.01471
2019 arXiv
-
[58]
2018, Galaxies, 6, 114, doi: 10.3390/galaxies6040114
Zhang, D. 2018, Galaxies, 6, 114, doi: 10.3390/galaxies6040114
2018 doi
-
[59]
Zhang, D., & Davis, S. W. 2017, ApJ, 839, 54, doi: 10.3847/1538-4357/aa6935
2017 doi
-
[60]
W., Jiang, Y.-F., & Stone, J
Zhang, D., Davis, S. W., Jiang, Y.-F., & Stone, J. M. 2018, ApJ, 854, 110, doi: 10.3847/1538-4357/aaa8e4
2018 doi
-
[61]
A., Murray, N., & Quataert, E
Zhang, D., Thompson, T. A., Murray, N., & Quataert, E. 2014, ApJ, 784, 93, doi: 10.1088/0004-637X/784/2/93
2014 doi
Reviewed August 14, 2026 · model on record in the stance chip above.
Discussion (0). Continue with ORCID to comment.