REVIEW 3 major objections 4 minor 1 cited by
Modelling depletion by re-accretion of gas from a dusty disc in post-AGB stars
T0 review · 3 major / 4 minor · reviewed 2026-08-14 · deepseek-v4-flash
Pith's one-line read Re-accretion of metal-poor gas from a circumbinary disc can reproduce the observed depletion of post-AGB stars, provided the disc begins with a mass near $10^{-2}\,M_\odot$ and initial accretion rates of at least about…
desk verdict Solid, useful MESA study of depletion by re-accretion, but the headline accretion-rate constraint is a factor of ~6 too strong once the uncalibrated wind law is varied, so the abstract oversells the lower bound. read the letter →
The pith
A machine-rendered reading of the paper's core claim, the machinery that carries it, and where it could break.
The reading
What carries the argument
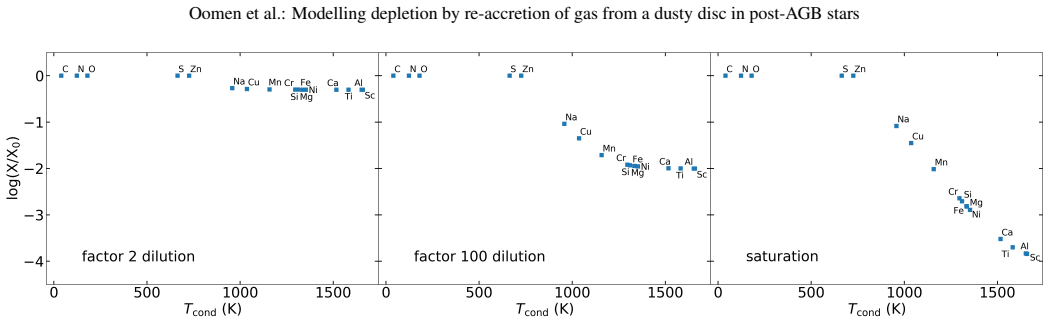
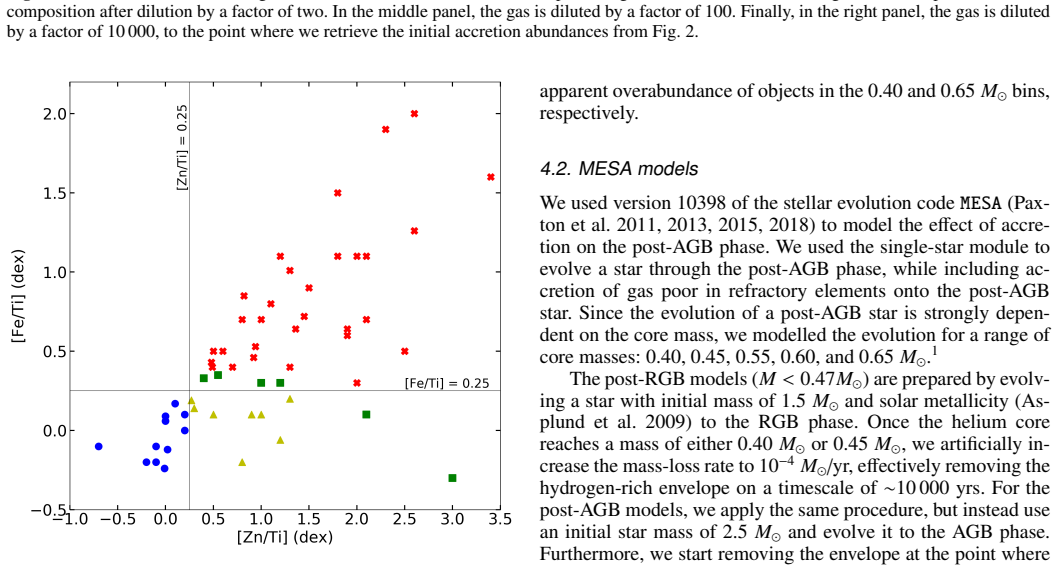
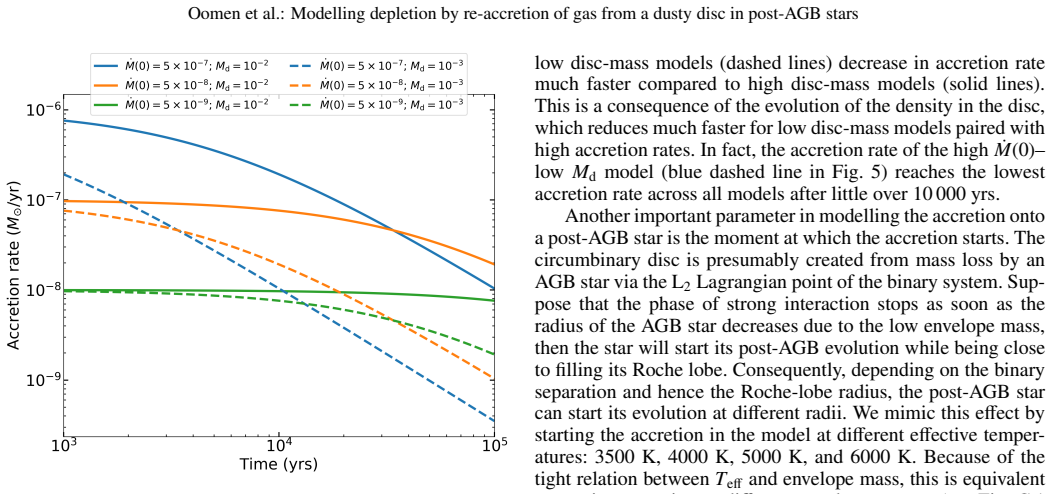
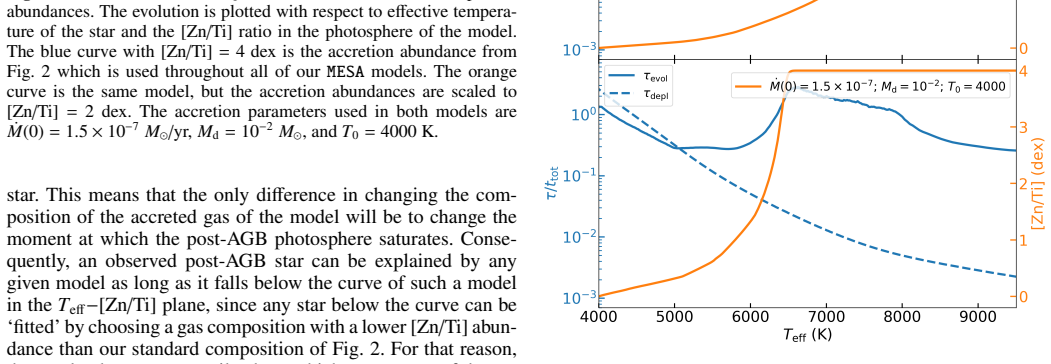
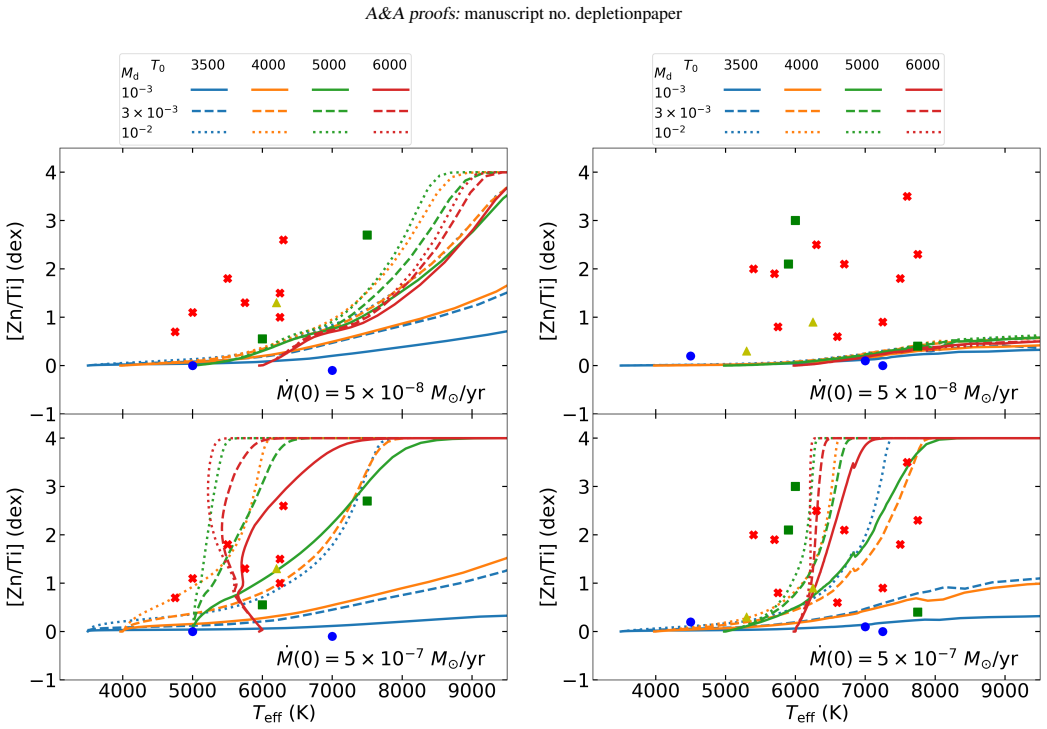
The load-bearing mechanism is gas dilution of the outer convective envelope by a time-dependent accretion flow. The disc drains viscously with rate $\dot{M}(t)=\dot{M}(0)(1+4\dot{M}(0)t/M_d)^{-3/2}$, where $\dot{M}(0)$ is the initial accretion rate and $M_d$ the initial disc mass; half the inflowing gas goes to the post-AGB star and half to the companion. The accreted gas has refractory-element abundances suppressed by up to $-4$ dex relative to the star's initial composition (calibrated from the most depleted observed objects), and as it mixes into the shrinking convective envelope it drives down photospheric $[\mathrm{Zn/Ti}]$ at a rate set by the ratio of the depletion timescale to the evolutionary timescale. The comparison is made in the $T_\mathrm{eff}$ versus $[\mathrm{Zn/Ti}]$ plane, where an observed star must lie on or below a model curve if some choice of accreted composition is to explain it.
What would settle it
A decisive test would be to measure the disc mass of a strongly depleted star with $T_\mathrm{eff}\lesssim5000$ K and luminosity above $7500\,L_\odot$: the model requires $\dot{M}(0)\gtrsim3\times10^{-7}\,M_\odot\,\mathrm{yr}^{-1}$ and $M_d\sim10^{-2}\,M_\odot$ for such an object, so a disc found below $10^{-3}\,M_\odot$ would falsify the required parameter range. A second check is to compare turn-off temperatures of depletion patterns with independently measured orbital separations; the model's single accreted composition predicts they should not vary, while observed variation would show the input-composition assumption is wrong.
Extended reading notes
Core claim
The paper's central claim is that the chemical peculiarity called depletion in disc-type post-AGB stars is produced by re-accretion of metal-poor gas from a circumbinary disc, and that this mechanism works without fine tuning only when the disc starts massive and feeds the binary fast. Using models that add a refractory-element-poor gas to evolving post-AGB envelopes and comparing them with 58 observed stars, the paper finds that initial accretion rates below about $5\times10^{-8}\,M_\odot\,\mathrm{yr}^{-1}$ rarely produce depleted photospheres before the star becomes hot, while initial rates of $\gtrsim3\times10^{-7}\,M_\odot\,\mathrm{yr}^{-1}$ together with disc masses near $10^{-2}\,M_\odot$ reproduce the observed depleted stars, including cool, mildly depleted post-RGB objects. The same accretion delays the stellar evolution track, extending the post-AGB phase by a factor of two to five. The paper also argues that the diversity of depletion patterns follows from how far dilution has proceeded: plateau patterns are partially diluted envelopes, saturated patterns have converged to the composition of the accreted gas, and the turn-off temperature itself reflects the composition of the gas supplied by the disc.
Load-bearing premise
The models assume one universal chemical composition for the accreted gas, fixed by the most depleted stars in the sample; if the real accreted gas is less metal-poor or differs from star to star, the predicted depletion curves, minimum accretion rates, and required disc masses all shift.
Editorial extensions
If this is right
- Observed depletion becomes a signpost of a massive infant disc: stars that are depleted at low effective temperature must have started with $M_d\sim10^{-2}\,M_\odot$ and $\dot{M}(0)\gtrsim3\times10^{-7}\,M_\odot\,\mathrm{yr}^{-1}$.
- Post-AGB lifetimes are not set by nuclear burning and winds alone; accretion can stretch them by a factor of two for low-mass post-RGB stars and up to five for more massive post-AGB stars, so planetary-nebula formation and dispersal calculations should include this effect.
- Saturated abundance patterns should be common because massive post-AGB stars dilute their envelopes quickly; plateau patterns should be rarer and preferentially found in the slower-evolving post-RGB systems.
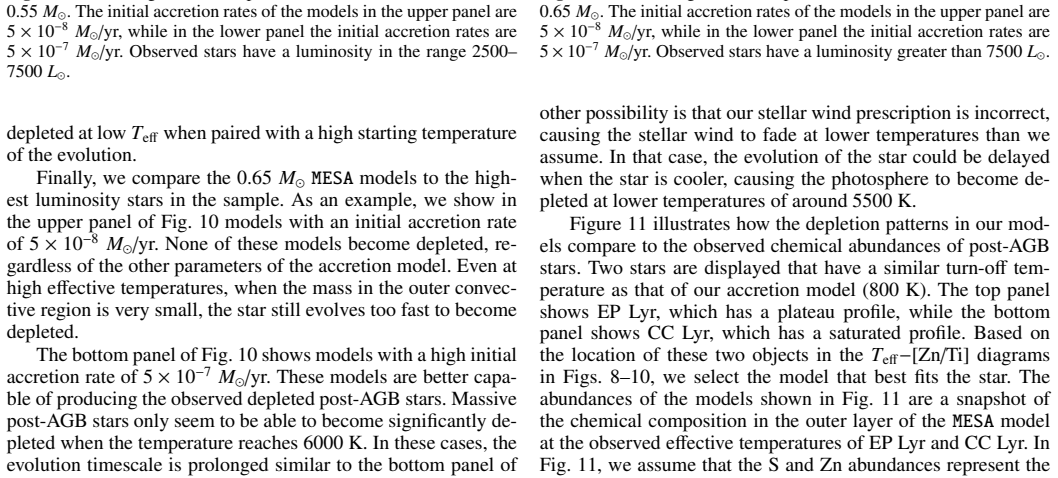
- Post-RGB stars can become depleted below about 5000 K, while $0.65\,M_\odot$ post-AGB stars only deplete above roughly 6000 K, cleanly separating the two populations in the $T_\mathrm{eff}$ versus $[\mathrm{Zn/Ti}]$ plane.
Reading between the lines
- If the required disc masses are correct, then non-depleted disc stars are probably not missing the accretion mechanism but started with smaller discs or began accreting later; the paper's own dilution logic implies their accreted gas may also be less depleted.
- A testable consequence the paper leaves implicit is that the observed spread in turn-off temperatures (800 to 1500 K) should correlate with orbital separation, because the inner gas-disc radius is set by binary properties while dust sublimation is set by stellar luminosity; interferometric disc radii could check this.
- Because accretion extends post-AGB lifetimes by factors of two to five, counts of post-AGB stars and planetary nebulae may imply lower birth rates than previously estimated, and population synthesis using these lifetimes would revise inferred binary-interaction rates.
- A direct extension would apply the same accretion prescription to post-RGB binaries with measured orbital periods, since the paper predicts lower accretion rates suffice there; a sample with pulsation-based luminosities could test the luminosity-bin classification.
Signed reviews
Editorial analysis
A structured set of objections, weighed in public.
Referee Report
Summary. The paper models the post-AGB and post-RGB evolution of stars that accrete refractory-depleted gas from a circumbinary disc, using MESA tracks for core masses 0.40-0.65 Msun and a viscous disc model for the time-dependent accretion rate. The accreted-gas abundance pattern is calibrated from the most depleted observed post-AGB stars, and the model tracks are compared in the Teff-[Zn/Ti] plane with a sample of 58 Galactic disc-type post-AGB stars whose luminosities are estimated from Gaia DR2 distances. The main claims are that high initial accretion rates (≳3e-7 Msun/yr) and large initial disc masses (~1e-2 Msun) are needed to reproduce depleted post-AGB stars, that accretion can extend the post-AGB evolution timescale by factors of 2-5, that unsaturated plateau patterns should be more common among post-RGB stars, and that post-RGB stars can become depleted at lower effective temperatures than post-AGB stars.
Significance. If the quantitative conclusions hold, this is a useful step in connecting circumbinary discs to the depletion phenomenon and to post-AGB lifetimes and planetary-nebula formation. The paper has genuine strengths: it is the first to my knowledge to treat the time-dependent accretion from a viscous disc self-consistently in detailed MESA post-AGB models; it uses a homogeneous 58-star observational sample; it compares tracks in the observable Teff-[Zn/Ti] plane; and it includes explicit sensitivity tests for mixing depth (Fig. 15) and wind strength (Fig. 16). The qualitative mechanism, re-accretion of dust-free gas producing photospheric depletion, is supported by the models. The quantitative headline constraints, however, are conditional on two assumptions that the paper itself identifies as uncertain: the universal adopted composition of the accreted gas, and the adopted cool-wind mass-loss law. Because both assumptions affect the inferred accretion-rate and disc-mass thresholds, the significance of the stated constraints is lower than the abstract implies.
major comments (3)
- [Sect. 3.2 and Fig. 2; Sect. 4.3]
- [Sect. 4.2.1, Eq. (1), and Fig. 16]
- [Sect. 4.1.1-4.1.2 and Tables A.1-A.2]
minor comments (4)
- [Tables A.2 and A.1]
- [Fig. 16 caption and Sect. 4.2.1]
- [Sect. 4.2.2]
- [Sect. 4.2 and marketplace statement]
Circularity Check
The saturated depletion pattern is the input accretion composition by construction; the accretion-rate and disc-mass constraints are independent forward-model results.
-
self definitional
[Sect. 3.2, Figs. 2 and 3 (right panel); composition adopted for the MESA models in Sect. 4.2.2]
"In order to determine the chemical composition of the accreted material, we used the observed chemical abundances in depleted post-AGB objects as a basis. ... Since the abundances of the most refractory elements, such as Sc, are around −4 dex relative to solar, we take the accretion abundance of Ti to be −4 dex. ... fixing the abundance of Zn and Ti to 0 dex and −4 dex, respectively, yields the abundance pattern shown in Fig. 2. ... At this point, we retrieve the chemical composition of the accreted gas from Fig. 2."
The accreted-gas abundance pattern in Fig. 2 is not derived from first principles; it is calibrated to the most depleted observed post-AGB stars, with Ti fixed at −4 dex and Zn at 0 dex based on IRAS 11472-0800. The model's 'saturated' depletion pattern is obtained by diluting until the mixture converges to exactly this input composition, as the paper states: 'we retrieve the chemical composition of the accreted gas from Fig. 2.' The paper then identifies that saturated profile as similar to IRAS 11472-0800 and uses such patterns to argue that accretion reproduces the observed depletion. For the saturated and maximum-depletion level, this is a tautology: the model output is the empirical calibration by construction.
full rationale
The paper's central quantitative claim about accretion rates (≳ 3×10^-7 Msun/yr) and disc masses (∼ 10^-2 Msun) is a genuine forward-model constraint: a grid of MESA models with varying initial accretion rate, disc mass, and starting temperature is compared with observed stars in the Teff-[Zn/Ti] plane, and the requirement that model tracks reach the observed depletion values at low effective temperature is not an algebraic identity with the model inputs. The wind-strength sensitivity in Fig. 16 is a robustness concern about the adopted Schröder-Cuntz prescription, not a circularity. The same-author citation to Oomen et al. (2018) is used to exclude close-orbit stars and thereby favour high disc masses; it is load-bearing for the disc-mass conclusion, but it is a separately published empirical result, so it does not by itself create a self-referential loop. The genuinely circular element is the saturated depletion pattern: the maximum depletion level and the shape of the saturated abundance curve are predetermined by Fig. 2, which was calibrated from the most depleted stars. The paper is transparent about this limitation, but the step still reduces by construction, so the overall score is 6 rather than 0-2.
Assumptions & free parameters
free parameters (7)
- Accreted gas abundance pattern =
Ti at -4 dex, Zn at 0 dex, linear interpolation in condensation temperature
- Initial accretion rate onto the post-AGB star =
Grid 5e-9 to 5e-7 Msun/yr; constrained to above about 3e-7 Msun/yr for luminous post-AGB stars
- Initial disc mass =
Grid 1e-3, 3e-3, and 1e-2 Msun; favoured value near 1e-2 Msun
- Accretion start temperature =
3500, 4000, 5000, and 6000 K
- Fraction of inflowing gas accreted by the post-AGB star =
0.5
- Mixing depth for accreted material =
Down to the He II convection zone at about 80,000 K
- Disc model constants =
alpha = 0.01, eta = 2, IL = 1, zeta = 0.1
assumptions (7)
- domain assumption Circumbinary discs around post-AGB binaries are formed by L2 mass loss and contain metal-poor gas because dust is removed by radiation pressure.
- domain assumption The Rafikov (2016b) viscous evolution equation for circumbinary disc accretion applies to post-AGB binaries.
- domain assumption The post-AGB star can be modelled as a single star with accretion; binarity enters only through the accretion rate.
- ad hoc to paper Accreted material is instantly mixed down to the He II convection zone in the 1D model.
- domain assumption Post-AGB evolution depends only on current core mass, envelope mass, and thermal pulse phase, not on the initial model mass.
- domain assumption The post-AGB wind is described by the Schroeder-Cuntz (2005) RGB wind at low temperatures and the Miller Bertolami (2016) CSPN wind at high temperatures, with an arbitrary transition.
- domain assumption MESA version 10398 with the specified nuclear network and input physics is a faithful model of post-AGB evolution.
Cite this review
Pith. "Pith review of Modelling depletion by re-accretion of gas from a dusty disc in post-AGB stars." pith.science (2026). https://pith.science/paper/Q75JBCYP
@misc{pith2026190801788,
  author       = {Pith},
  title        = {Pith review of: Modelling depletion by re-accretion of gas from a dusty disc in post-AGB stars},
  year         = {2026},
  howpublished = {\url{https://pith.science/paper/Q75JBCYP}},
  note         = {Machine review of arXiv:1908.01788}
}
abstract
Many disc-type post-asymptotic giant branch (post-AGB) stars are chemically peculiar, showing underabundances of refractory elements in their photospheres that correlate with condensation temperature. The aim of this paper is to investigate how accretion from a circumbinary disc can cause this phenomenon of depletion and how this impacts the evolution of post-AGB stars. We used the \texttt{MESA} code to evolve stars in the post-AGB phase, while including accretion of metal-poor gas. We compared the models to a sample of 58 observed disc-type post-AGB stars with chemical abundance data. For each of these stars, we estimated the luminosity and the mass using the Gaia distance. We modelled the accretion rate onto the binary from a viscously evolving disc for a range of initial accretion rates and disc masses. We find that large initial accretion rates ($\gtrsim 3\times10^{-7}$ $M_\odot$/yr) and large initial disc masses ($\sim10^{-2}$ $M_\odot$) are needed to reproduce the observed depleted post-AGB stars. Based on these high accretion rates, the evolution timescale of post-AGB stars can be significantly extended by a factor between two and five. We distinguish depletion patterns that are unsaturated (plateau profile) from those that are saturated, and we expect that post-red giant branch (post-RGB) stars are much more likely to show an unsaturated abundance pattern compared to post-AGB stars. Finally, because of the slower evolution of the low-mass post-RGB stars, we find that these systems can become depleted at lower effective temperatures ($< 5000$ K). We conclude that accretion from a circumbinary disc successfully accounts for the chemical peculiarity of post-AGB stars.
Figures


Figures from the paper (12 more)




Forward citations
Cited by 1 Pith paper
-
Spectroscopy of a sample of RV Tauri stars without IR excess
New high-resolution abundances for five RV Tauri stars without IR excess; V457 Cyg shows depletion and V894 Per appears to be a binary, not an RV Tauri star.
Reference graph
Works this paper leans on
-
[1]
& Lubow, S
Artymowicz, P. & Lubow, S. H. 1994, ApJ, 421, 651
1994
-
[2]
J., & Scott, P
Asplund, M., Grevesse, N., Sauval, A. J., & Scott, P. 2009, ARA&A, 47, 481
2009
- [3]
-
[4]
Bailer-Jones, C. A. L., Rybizki, J., Fouesneau, M., Mantelet, G., & Andrae, R. 2018, AJ, 156, 58 Blöcker, T. 1995, A&A, 299, 755
work page 2018
- [5]
- [6]
-
[7]
A., Clayton, G
Cardelli, J. A., Clayton, G. C., & Mathis, J. S. 1989, ApJ, 345, 245
1989
-
[8]
Cranmer, S. R. & Saar, S. H. 2011, ApJ, 741, 54 De Marco, O. & Izzard, R. G. 2017, PASA, 34, 1 De Ruyter, S., Van Winckel, H., Maas, T., et al. 2006, A&A, 448, 641 De Smedt, K., Van Winckel, H., Kamath, D., et al. 2016, A&A, 587, A6 D’Orazio, D. J., Haiman, Z., & MacFadyen, A. 2013, MNRAS, 436, 2997
work page 2011
Show all 70 references
-
[9]
D., Duffell, P., MacFadyen, A
Farris, B. D., Duffell, P., MacFadyen, A. I., & Haiman, Z. 2014, ApJ, 783, 134
2014
-
[10]
& Jorissen, A
Frankowski, A. & Jorissen, A. 2007, Baltic Astronomy, 16, 104 Gaia Collaboration, Brown, A. G. A., Vallenari, A., et al. 2018, A&A, 616, A1
2007
-
[11]
A., & Miller Bertolami, M
Gesicki, K., Zijlstra, A. A., & Miller Bertolami, M. M. 2018, Nature Astronomy, 2, 580
2018
-
[12]
2015, MNRAS, 453, 133
Gezer, I., Van Winckel, H., Bozkurt, Z., et al. 2015, MNRAS, 453, 133
2015
-
[13]
2019, MNRAS, 1918
Gezer, I., Van Winckel, H., Manick, R., & Kamath, D. 2019, MNRAS, 1918
2019
-
[14]
L., & Gonzalez, G
Giridhar, S., Lambert, D. L., & Gonzalez, G. 1998, ApJ, 509, 366
1998
-
[15]
L., & Gonzalez, G
Giridhar, S., Lambert, D. L., & Gonzalez, G. 2000, ApJ, 531, 521
2000
-
[16]
L., Reddy, B
Giridhar, S., Lambert, D. L., Reddy, B. E., Gonzalez, G., & Yong, D. 2005, ApJ, 627, 432
2005
-
[17]
K., & Lambert, D
Giridhar, S., Rao, N. K., & Lambert, D. L. 1994, ApJ, 437, 476
1994
-
[18]
& Wallerstein, G
Gonzalez, G. & Wallerstein, G. 1996, MNRAS, 280, 515
1996
-
[19]
2012, A&A, 542, A27
Gorlova, N., Van Winckel, H., Gielen, C., et al. 2012, A&A, 542, A27
2012
-
[20]
P., et al
Gorlova, N., Van Winckel, H., Ikonnikova, N. P., et al. 2015, MNRAS, 451, 2462
2015
-
[21]
L., Menu, J., et al
Hillen, M., de Vries, B. L., Menu, J., et al. 2015, A&A, 578, A40
2015
-
[22]
2016, A&A, 588, L1
Hillen, M., Kluska, J., Le Bouquin, J.-B., et al. 2016, A&A, 588, L1
2016
-
[23]
2014, A&A, 568, A12
Hillen, M., Menu, J., Van Winckel, H., et al. 2014, A&A, 568, A12
2014
-
[24]
2017, A&A, 599, A41
Hillen, M., Van Winckel, H., Menu, J., et al. 2017, A&A, 599, A41
2017
-
[25]
Horowitz, D. H. 1986, Journal of the American Association of Variable Star Observers (JAA VSO), 15, 223
1986
-
[26]
J., Van Winckel, H., Reyniers, M., et al
Hrivnak, B. J., Van Winckel, H., Reyniers, M., et al. 2008, AJ, 136, 1557
2008
-
[27]
& Jermyn, A
Izzard, R. & Jermyn, A. 2018, Galaxies, 6, 97 Article number, page 15 of 20 A&A proofs: manuscript no. depletionpaper Jofré, P., Heiter, U., & Soubiran, C. 2018, arXiv e-prints [arXiv:1811.08041]
2018 arXiv
-
[28]
& Boffin, H
Jones, D. & Boffin, H. M. J. 2017, Nature Astronomy, 1, 0117
2017
-
[29]
R., & Van Winckel, H
Kamath, D., Wood, P. R., & Van Winckel, H. 2014, MNRAS, 439, 2211
2014
-
[30]
R., & Van Winckel, H
Kamath, D., Wood, P. R., & Van Winckel, H. 2015, MNRAS, 454, 1468
2015
-
[31]
R., Van Winckel, H., & Nie, J
Kamath, D., Wood, P. R., Van Winckel, H., & Nie, J. D. 2016, A&A, 586, L5
2016
-
[32]
2011, Baltic Astronomy, 20, 65
Kipper, T. 2011, Baltic Astronomy, 20, 65
2011
-
[33]
2013, Baltic Astronomy, 22, 101
Kipper, T. 2013, Baltic Astronomy, 22, 101
2013
-
[34]
2018, A&A, 616, A153
Kluska, J., Hillen, M., Van Winckel, H., et al. 2018, A&A, 616, A153
2018
-
[35]
2019, A&A, 624, A60
Laverick, M., Lobel, A., Royer, P., et al. 2019, A&A, 624, A60
2019
-
[36]
R., Huber, D., et al
Li, T., Bedding, T. R., Huber, D., et al. 2018, MNRAS, 475, 981
2018
-
[37]
2018, A&A, 616, A2
Lindegren, L., Hernández, J., Bombrun, A., et al. 2018, A&A, 616, A2
2018
-
[38]
Linsky, J. L. & Haisch, B. M. 1979, ApJ, 229, L27
1979
-
[39]
2003, ApJ, 591, 1220
Lodders, K. 2003, ApJ, 591, 1220
2003
-
[40]
Luri, X., Brown, A. G. A., Sarro, L. M., et al. 2018, A&A, 616, A9
2018
-
[41]
Maas, T., Giridhar, S., & Lambert, D. L. 2007, ApJ, 666, 378
2007
-
[42]
2005, A&A, 429, 297
Maas, T., Van Winckel, H., & Lloyd Evans, T. 2005, A&A, 429, 297
2005
-
[43]
2003, A&A, 405, 271
Maas, T., Van Winckel, H., Lloyd Evans, T., et al. 2003, A&A, 405, 271
2003
-
[44]
2002, A&A, 386, 504
Maas, T., Van Winckel, H., & Waelkens, C. 2002, A&A, 386, 504
2002
-
[45]
MacFadyen, A. I. & Milosavljevi´c, M. 2008, ApJ, 672, 83
2008
-
[46]
2019, arXiv e-prints, arXiv:1906.10492
Manick, R., Kamath, D., Van Winckel, H., et al. 2019, arXiv e-prints, arXiv:1906.10492
2019 arXiv
-
[47]
2017, A&A, 597, A129
Manick, R., Van Winckel, H., Kamath, D., Hillen, M., & Escorza, A. 2017, A&A, 597, A129
2017
-
[48]
Marigo, P., Girardi, L., Weiss, A., Groenewegen, M. A. T., & Chiosi, C. 2004, A&A, 423, 995 Men’shchikov, A. B., Schertl, D., Tuthill, P. G., Weigelt, G., & Yungelson, L. R. 2002, A&A, 393, 867 Miller Bertolami, M. M. 2016, A&A, 588, A25
2004
-
[49]
2018, A&A, 620, A85
Oomen, G.-M., Van Winckel, H., Pols, O., et al. 2018, A&A, 620, A85
2018
-
[50]
2011, ApJS, 192, 3
Paxton, B., Bildsten, L., Dotter, A., et al. 2011, ApJS, 192, 3
2011
-
[51]
2013, ApJS, 208, 4
Paxton, B., Cantiello, M., Arras, P., et al. 2013, ApJS, 208, 4
2013
-
[52]
2015, ApJS, 220, 15
Paxton, B., Marchant, P., Schwab, J., et al. 2015, ApJS, 220, 15
2015
-
[53]
B., et al
Paxton, B., Schwab, J., Bauer, E. B., et al. 2018, ApJS, 234, 34
2018
-
[54]
D., & Tomida, K
Pejcha, O., Metzger, B. D., & Tomida, K. 2016, MNRAS, 461, 2527
2016
-
[55]
Pollard, K. H. & Cottrell, P. L. 1995, in ASP Conf. Ser. 83: IAU Colloq. 155: Astrophysical Applications of Stellar Pulsation, 409–+
1995
-
[56]
Pringle, J. E. 1991, MNRAS, 248, 754 Rafikov, R. R. 2016a, ApJ, 830, 7 Rafikov, R. R. 2016b, ApJ, 830, 8
1991
-
[57]
Rao, S. S. & Giridhar, S. 2014, Rev. Mexicana Astron. Astrofis., 50, 49
2014
-
[58]
S., Giridhar, S., & Lambert, D
Rao, S. S., Giridhar, S., & Lambert, D. L. 2012, MNRAS, 419, 1254
2012
-
[59]
1975, Memoires of the Societe Royale des Sciences de Liege, 8, 369
Reimers, D. 1975, Memoires of the Societe Royale des Sciences de Liege, 8, 369
1975
-
[60]
1989, in IAU Symposium, V ol
Renzini, A. 1989, in IAU Symposium, V ol. 131, Planetary Nebulae, ed. S. Torres- Peimbert, 391–400
1989
-
[61]
A., & Lèbre, A
Sabin, L., Wade, G. A., & Lèbre, A. 2015, MNRAS, 446, 1988 Schröder, K.-P. & Cuntz, M. 2005, ApJ, 630, L73 Schröder, K.-P. & Cuntz, M. 2007, A&A, 465, 593
2015
-
[62]
& Krolik, J
Shi, J.-M. & Krolik, J. H. 2015, ApJ, 807, 131
2015
-
[63]
H., Lubow, S
Shi, J.-M., Krolik, J. H., Lubow, S. H., & Hawley, J. F. 2012, ApJ, 749, 118
2012
-
[64]
H., Lubow, S
Shu, F. H., Lubow, S. H., & Anderson, L. 1979, ApJ, 229, 223
1979
-
[65]
H., et al
Tayar, J., Somers, G., Pinsonneault, M. H., et al. 2017, ApJ, 840, 17 van Winckel, H. 1995, PhD thesis, KU Leuven Van Winckel, H. 1997, A&A, 319, 561 Van Winckel, H. 2003, ARA&A, 41, 391 Van Winckel, H. 2017, in IAU Symposium, V ol. 323, Planetary Nebulae: Multi-Wavelength Pro...
2017
-
[66]
& Wood, P
Vassiliadis, E. & Wood, P. R. 1994, ApJS, 92, 125
1994
-
[67]
Waelkens, C., Lamers, H. J. G. L. M., Waters, L. B. F. M., et al. 1991, A&A, 242, 433
1991
-
[68]
Waelkens, C., Van Winckel, H., Waters, L. B. F. M., & Bakker, E. J. 1996, A&A, 314, L17
1996
-
[69]
Waters, L. B. F. M., Trams, N. R., & Waelkens, C. 1992, A&A, 262, L37
1992
-
[70]
& Ferguson, J
Weiss, A. & Ferguson, J. W. 2009, A&A, 508, 1343 Article number, page 16 of 20 Oomen et al.: Modelling depletion by re-accretion of gas from a dusty disc in post-AGB stars Appendix A: Observational data In this appendix we present the observational data collected from literatu...
2018
Reviewed August 14, 2026 · model on record in the stance chip above.
Discussion (0). Continue with ORCID to comment.