REVIEW 4 major objections 5 minor 75 references
Multiwavelength Period-Luminosity and Period-Luminosity-Color relations at maximum-light for Mira variables in the Magellanic Clouds
T0 review · 4 major / 5 minor · reviewed 2026-08-14 · deepseek-v4-flash
Pith's one-line read Maximum-light measurements of Mira variables produce period-luminosity relations with up to 30% less scatter than mean-light relations, offering a more precise distance indicator.
desk verdict Solid multiwavelength extension of the old max-light Mira PLR result; the top-decile definition deserves a synthetic test, but the core scatter reduction is likely real. read the letter →
The pith
A machine-rendered reading of the paper's core claim, the machinery that carries it, and where it could break.
The reading
What carries the argument
The key operational object is the maximum-light magnitude, defined as the mean of all observed epochs within the brightest ten percent of the peak-to-peak amplitude of each light curve in each band. To make simultaneous colors, the paper fits a Gaussian-process regression to the well-sampled I-band light curve and predicts the I-band magnitude at the epoch of each V-band observation. This phase-matched photometry, combined with the ten-percentile maximum-light definition, is what produces tighter PL and PLC relations. The physical mechanism invoked is phase-dependent molecular absorption: at maximum light the star is hottest, TiO and water-vapor bands are weak, and the observed brightness is therefore less sensitive to temperature and layer variations that inflate scatter at fainter phases.
What would settle it
Recompute the maximum-light relations using an independent estimator of the true light-curve peak—for instance, the maximum of a Gaussian-process or Fourier fit, or the mean over a fixed phase window—and compare the dispersions with the ten-percentile results. If the up-to-30% scatter reduction disappears or diminishes substantially, the paper's central claim is an artifact of the chosen maximum-light definition. Alternatively, use continuous high-cadence photometry (as from a space telescope) to measure the rms scatter of maximum-light magnitudes over many tens of cycles; if that scatter is not smaller than the scatter at minimum light, the stability claim fails.
Extended reading notes
Core claim
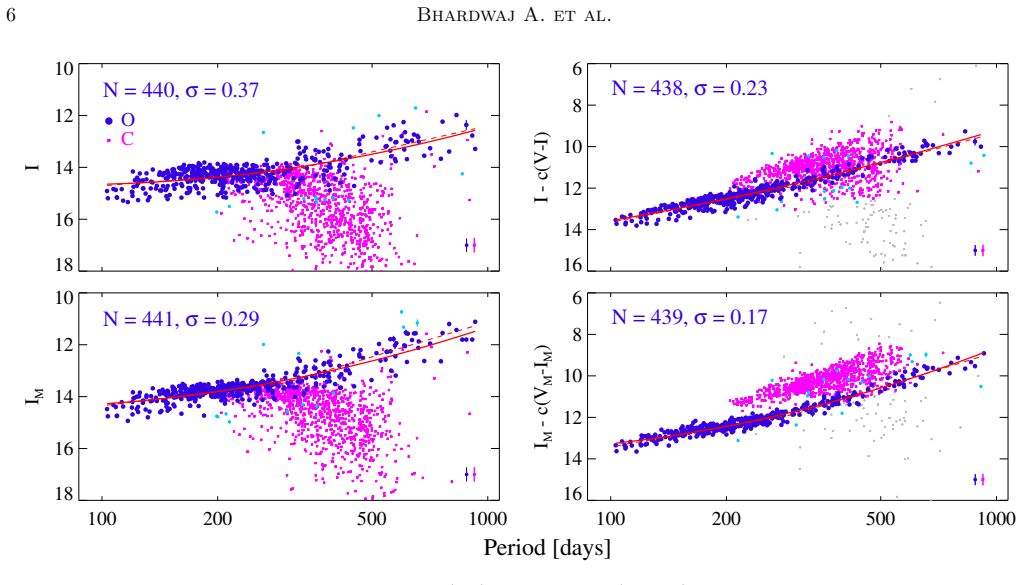
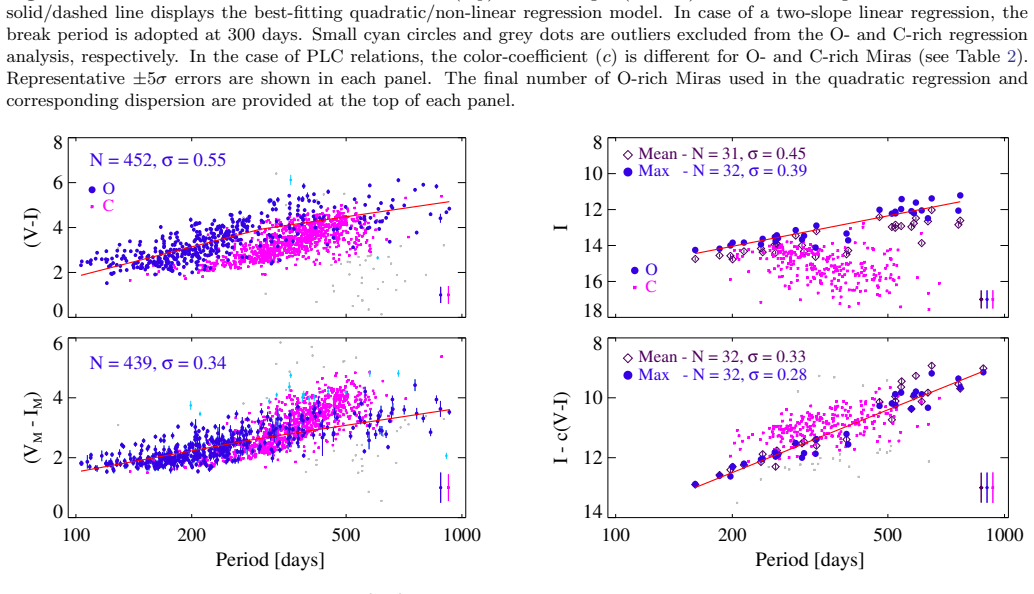
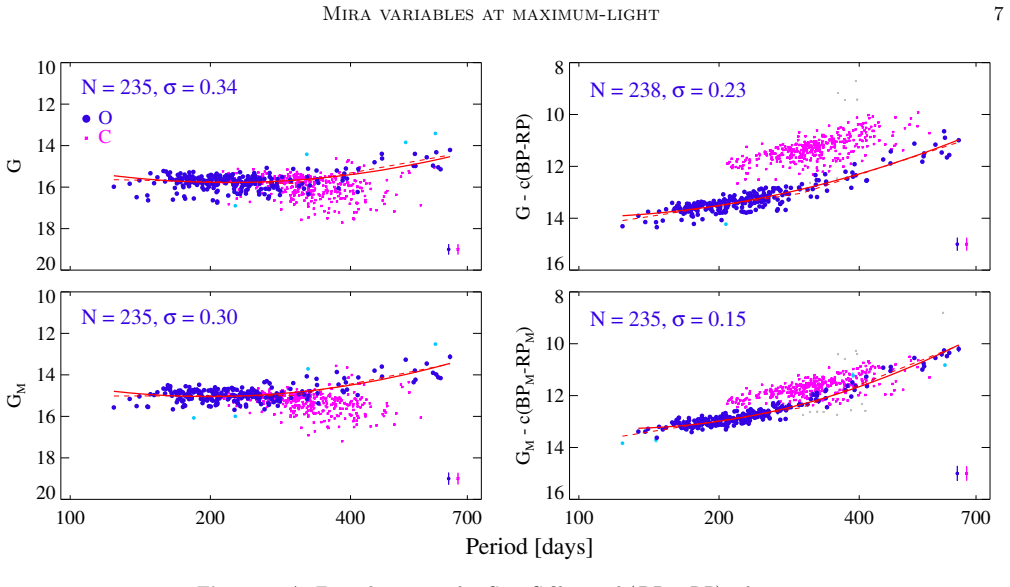
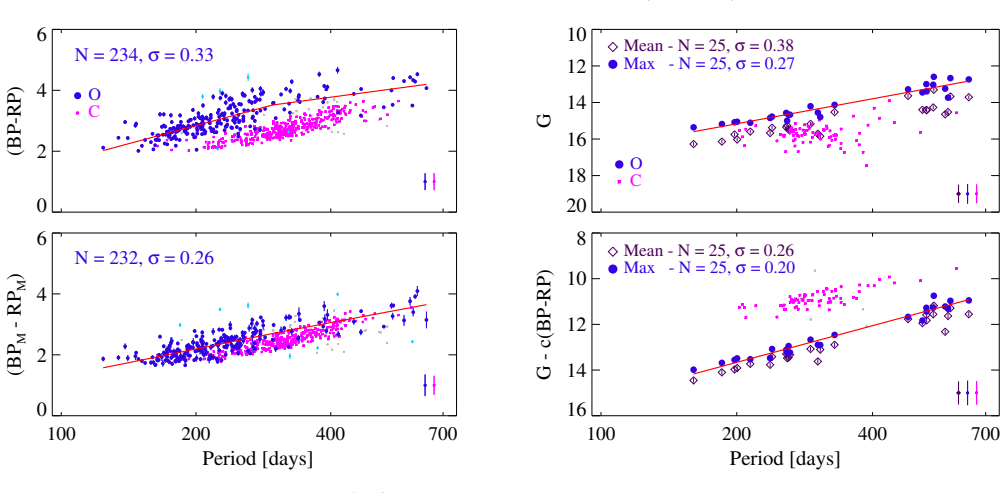
The central claim is that the empirical Period-Luminosity (PL) and Period-Luminosity-Color (PLC) relations for Mira variables are intrinsically tighter when evaluated at maximum light rather than at mean light. Using hundreds of oxygen-rich Miras in the Large Magellanic Cloud and smaller samples in the Small Magellanic Cloud, the paper measures dispersions that are up to roughly 30% smaller at maximum light in optical bands, with comparable or slightly smaller dispersions in the near-infrared. The paper further demonstrates that maximum-light magnitudes are more stable over multiple pulsation cycles than minimum-light magnitudes, and that maximum-light spectra show strong Balmer emission lines with weak TiO absorption, consistent with reduced molecular-band sensitivity at the warmest phase. On this basis, the paper locates a kink in the oxygen-rich Mira PL relation at about 300 days in the optical, shifting to about 350 days in the near-infrared, and derives a relative distance modulus of 0.48 ± 0.08 mag between the Large and Small Magellanic Clouds from maximum-light relations.
Load-bearing premise
The load-bearing premise is the operational definition of maximum light as the mean of the brightest ten percent of the peak-to-peak amplitude; if the top decile of epochs is a narrower range by construction (due to sampling or light-curve shape), the measured scatter reduction and cycle-to-cycle stability could be partly artifacts of that definition.
Editorial extensions
If this is right
- Maximum-light Mira PL/PLC relations can serve as a distance indicator with statistical precision competitive with classical Cepheids, even in optical bands where mean-light Mira relations are notoriously scattered.
- Because maximum-light magnitudes are stable across cycles, a single well-timed epoch near maximum could be sufficient to place a Mira on the relation, dramatically reducing the observing time needed for distance work.
- The reported tightenings predict that the color term in the PLC relation becomes smaller and more physically interpretable at maximum light, offering a clean test for stellar atmosphere models.
- The kink at 300–350 days gives an empirical anchor for when hot bottom burning begins to dominate in intermediate-mass AGB stars, which pulsation models can now be required to reproduce.
- The smaller statistical uncertainty in the LMC–SMC distance modulus (0.48 ± 0.08 mag) suggests that maximum-light Mira relations could help arbitrate between conflicting distance estimates to the Magellanic Clouds and beyond.
Reading between the lines
- If the molecular-band explanation is correct, the scatter reduction should strengthen toward bluer bands and weaken toward the infrared, a gradient that could be tested with more extensive near- and mid-infrared time series.
- The same maximum-light logic may apply to other large-amplitude pulsators, such as semi-regular variables or red supergiants, whose light curves also modulate via molecule formation; this would extend the method beyond Miras.
- A critical check the paper does not perform is to vary the ten-percentile window (e.g., top 5% or 20%) and the required number of epochs; if the scatter reduction is robust to those choices, the effect is more likely physical than procedural.
- If maximum-light stability holds in the Milky Way and in external galaxies with different metallicities, Mira maximum-light relations could become a backbone of the local distance ladder that does not depend on full phase coverage of each star.
Signed reviews
Editorial analysis
A structured set of objections, weighed in public.
Referee Report
Summary. This paper studies Mira variables in the Large and Small Magellanic Clouds using OGLE-III optical light curves, Gaia DR2 photometry, NIR data from Yuan et al. (2017) and Ita et al. (2018), and Kepler/LAMOST observations for a small sample. The authors define maximum-light magnitude as the mean of all epochs within the brightest 10% of the peak-to-peak amplitude, and derive Period-Luminosity and Period-Luminosity-Color relations at mean-, maximum-, and minimum-light. They report that the maximum-light relations have up to ~30% smaller scatter than the mean-light relations at optical wavelengths, that individual Miras show smaller cycle-to-cycle variations at maximum than at minimum light, and that spectra show weaker TiO bands at maximum light. They also report a break period near 300 days in the optical, shifting to ~350 days in the near-infrared, and derive a relative LMC-SMC distance modulus of Delta(mu) = 0.48 +/- 0.08 mag from maximum-light relations.
Significance. If the claimed effect is real, maximum-light Mira relations could provide an empirical distance indicator with smaller scatter than mean-light relations, and the apparent stability of maximum-light magnitudes would be a useful constraint on Mira atmosphere models. The paper makes good use of multiple independent public datasets and includes a robustness check using the single minimum numerical magnitude in the I-band. The multiwavelength comparison and the spectroscopic evidence from LAMOST are valuable. However, the central quantitative claims rely on an operational maximum-light definition whose statistical behavior is not fully controlled, and the cycle-to-cycle stability analysis is not described with enough detail to be reproduced. These issues are load-bearing for the paper's main conclusions.
major comments (4)
- [Section 2, maximum-light definition] The maximum-light magnitude is defined as the mean of all epochs within the brightest 10% of the peak-to-peak amplitude. This is a truncated average that restricts the phase window by construction, so a reduction in dispersion relative to the phase-averaged mean is expected even if the intrinsic cycle-to-cycle dispersion is unchanged. The robustness check in Section 3.1 using the single minimum numerical I-band magnitude removes the averaging effect but retains the phase-selection effect and is reported only for the I-band PLR. No analogous test is shown for the V-band, the Gaia-band relations, or the NIR relations. The authors should add a synthetic light-curve injection test that preserves the actual sampling patterns and known cycle-to-cycle scatter, reporting the expected dispersion reduction under the null hypothesis that maximum light is no more stable than mean light.
- [Section 4.1 and Figure 9] The claim that individual Miras have more stable maximum-light magnitudes over multiple pulsation cycles is central to the physical interpretation, but the methodology is not described. The text does not state how individual cycles are segmented, how the per-cycle maximum, minimum, and median magnitudes are estimated from the GPR predictions, how many cycles are used for each star, or how the criterion that the time coverage is equivalent to the period is applied. Without this information, Figure 9 cannot be reproduced and the comparison conflates the adopted maximum-light estimator with true cycle-to-cycle stability. The authors should specify the algorithm in detail and provide per-cycle statistics for at least the Kepler sample.
- [Section 3.1, F-test paragraph] The F-test is used to establish that the dispersion reduction is statistically significant, but it is applied after iterative 3-sigma outlier rejection and the final sample sizes differ between the mean- and maximum-light fits (Table 2, e.g., N_f = 440 vs 441 and 438 vs 439). The F distribution is not the correct null distribution for variance ratios of residuals from data-dependent clipped fits with different retained samples. A permutation or bootstrap test that applies the identical clipping procedure to each resample should be used to confirm that p < 0.05 is not an artifact of the clipping algorithm or of sample-size differences.
- [Section 5.2 and Table 6] The relative distance modulus Delta(mu) = 0.48 +/- 0.08 mag is obtained by combining three band estimates that differ by more than their formal errors: 0.45 +/- 0.08 (optical PLC), 0.46 +/- 0.08 (J), and 0.53 +/- 0.07 (K). The SMC's substantial line-of-sight depth and any metallicity-dependent differences in the color coefficients are not propagated into the quoted uncertainty. The statement that maximum-light relations provide a smaller statistical uncertainty is formally supported, but the improvement in precision is not demonstrated to survive these systematic uncertainties. The authors should either include these systematics in a combined uncertainty or restrict the claim to statistical precision only.
minor comments (5)
- [Section 3.1, final sentence of the F-test paragraph] The phrase "smaller than 0.05 dex" should read "smaller than 0.05" or "p < 0.05"; dex is a logarithmic unit and is not appropriate for a probability.
- [Figure 1 caption] The vertical dotted lines are described as showing V- and I-band magnitudes at the same epoch, but the figure would benefit from a legend or labels distinguishing the V and I magnitudes and the shaded ten-percentile region.
- [Section 5.1 and Tables 4-5] The abstract and conclusions state that maximum-light relations show up to 30% smaller scatter, but the NIR results in Table 5 show comparable or slightly larger scatter at maximum light in the J band (sigma = 0.15 mean vs 0.17 max for the quadratic fit). The wording should clearly restrict the 30% claim to optical wavelengths.
- [Section 4.2] The selection of Kepler Mira candidates from Banyai et al. (2013) and the criterion for calling a star a Mira candidate should be stated explicitly, since only two example stars are shown and the reader cannot assess how representative they are.
- [Section 2, extinction corrections] The paper says the median E(V-I) is taken when the reddening map does not provide a value within 2 arcsec, but it does not state how many stars are affected by this substitution; a brief statement of the sample fraction would be useful.
Circularity Check
No significant circularity: the max-light PL/PLC scatter comparison is an empirical measurement against public OGLE/Gaia/Kepler data, and the max-light definition is a measurement choice backed by a minimum-magnitude robustness check.
full rationale
The paper's central claim, that max-light PL and PLC relations have up to about 30% smaller scatter than their mean-light counterparts, is not derived from any fitted parameter or self-citation. The max-light magnitude is defined operationally as the mean of all epochs within the brightest ten percent of the peak-to-peak amplitude, but this is a measurement definition applied to public light curves, not a parameter fitted to the relations whose scatter is then reported. The paper explicitly tests this definition by using the single minimum numerical I-band magnitude as an alternative max-light estimate and finds similar dispersion (Section 3.1), which prevents the scatter reduction from reducing to the truncation-by-construction concern. Independent Kepler high-cadence photometry is also used to show cycle-to-cycle stability at maximum light (Section 4.1), so the central empirical result is externally benchmarked rather than self-referential. The GPR model of He et al. (2016) and the NIR templates of Yuan et al. (2017) involve overlapping authorship, but they are used as data-processing tools or secondary data sources rather than as the logical basis for the optical scatter comparison; the conclusion does not require accepting any unverified claim from those citations. The F-tests and break-period tests are standard statistical comparisons, not equations that assume the result. No equation in the paper equates the predicted max-light relation to its inputs by construction, and no fitted constant is renamed as a prediction. The reader's concern about the top-decile definition is a legitimate robustness/correctness question, but it is not circularity because the definition is not fitted to the target relation and is probed by an independent minimum-magnitude check. Overall, the derivation chain is self-contained and empirical, so the circularity score is 0.
Assumptions & free parameters
free parameters (4)
- Break period Pb =
300 days (optical), ~350 days (NIR)
- Max-light percentile threshold =
10%
- Color coefficient c in PLC relations =
Varies, e.g., 0.62 for LMC O-rich I-band
- Outlier clipping threshold =
3 sigma
assumptions (5)
- domain assumption The GPR model of He et al. (2016) can simultaneously model periodic and stochastic signals in Mira light curves.
- domain assumption OGLE-III O/C-rich classifications are accurate.
- domain assumption Reddening maps (Haschke et al. 2011) and the Cardelli et al. (1989) extinction law apply to these sight lines.
- domain assumption The LMC distance modulus from Pietrzynski et al. (2019) is used for absolute calibration of Galactic Center distances.
- domain assumption Most Miras toward the Galactic Center are O-rich.
Cite this review
Pith. "Pith review of Multiwavelength Period-Luminosity and Period-Luminosity-Color relations at maximum-light for Mira variables in the Magellanic Clouds." pith.science (2026). https://pith.science/paper/AN6Y3LUR
@misc{pith2026190801795,
  author       = {Pith},
  title        = {Pith review of: Multiwavelength Period-Luminosity and Period-Luminosity-Color relations at maximum-light for Mira variables in the Magellanic Clouds},
  year         = {2026},
  howpublished = {\url{https://pith.science/paper/AN6Y3LUR}},
  note         = {Machine review of arXiv:1908.01795}
}
abstract
We present Period-Luminosity and Period-Luminosity-Color relations at maximum-light for Mira variables in the Magellanic Clouds using time-series data from the Optical Gravitational Lensing Experiment (OGLE-III) and {\it Gaia} data release 2. The maximum-light relations exhibit a scatter typically up to $\sim 30\%$ smaller than their mean-light counterparts. The apparent magnitudes of Oxygen-rich Miras at maximum-light display significantly smaller cycle-to-cycle variations than at minimum-light. High-precision photometric data for Kepler Mira candidates also exhibit stable magnitude variations at the brightest epochs while their multi-epoch spectra display strong Balmer emission lines and weak molecular absorption at maximum-light. The stability of maximum-light magnitudes for Miras possibly occurs due to the decrease in the sensitivity to molecular bands at their warmest phase. At near-infrared wavelengths, the Period-Luminosity relations of Miras display similar dispersion at mean and maximum-light with limited time-series data in the Magellanic Clouds. A kink in the Oxygen-rich Mira Period-Luminosity relations is found at 300 days in the $VI$-bands which shifts to longer-periods ($\sim 350$~days) at near-infrared wavelengths. Oxygen-rich Mira Period-Luminosity relations at maximum-light provide a relative distance modulus, $\Delta \mu = 0.48\pm0.08$~mag, between the Magellanic Clouds with a smaller statistical uncertainty than the mean-light relations. The maximum-light properties of Miras can be very useful for stellar atmosphere modeling and distance scale studies provided their stability and the universality can be established in other stellar environments in the era of extremely large telescopes.
Figures

Figures from the paper (7 more)



Reference graph
Works this paper leans on
-
[1]
B´ anyai, E., Kiss, L. L., Bedding, T. R., et al. 2013, MNRAS, 436, 1576
work page 2013
-
[2]
Bhardwaj, A., Rejkuba, M., Minniti, D., et al. 2017, A&A, 605, A100
work page 2017
-
[3]
Bladh, S., H¨ ofner, S., Aringer, B., & Eriksson, K. 2015, A&A, 575, A105
work page 2015
-
[4]
Bowen, G. H. 1988, ApJ, 329, 299
1988
-
[5]
L., Srinivasan, S., van Loon, J
Boyer, M. L., Srinivasan, S., van Loon, J. T., et al. 2011, AJ, 142, 103
2011
-
[6]
A., Clayton, G
Cardelli, J. A., Clayton, G. C., & Mathis, J. S. 1989, ApJ, 345, 245
1989
- [7]
-
[8]
Piontek, R. A. 2000, AJ, 120, 2627
work page 2000
Show all 75 references
-
[9]
2018, A&A, 617, L1
Chiavassa, A., Freytag, B., & Schultheis, M. 2018, A&A, 617, L1
2018
-
[10]
Code, A. D. 1947, ApJ, 106, 309
1947
-
[11]
2012, RAA, 12, 1197 de Grijs, R., & Bono, G
Cui, X.-Q., Zhao, Y.-H., Chu, Y.-Q., et al. 2012, RAA, 12, 1197 de Grijs, R., & Bono, G. 2015, AJ, 149, 179 de Grijs, R., Wicker, J. E., & Bono, G. 2014, AJ, 147, 122 D´ ek´ any, I., Minniti, D., Catelan, M., et al. 2013, ApJL, 776, L19
2012
-
[12]
W., Glass, I
Feast, M. W., Glass, I. S., Whitelock, P. A., & Catchpole, R. M. 1989, MNRAS, 241, 375
1989
-
[13]
J., Hawley, S
Fraser, O. J., Hawley, S. L., & Cook, K. H. 2008, AJ, 136, 1242
2008
-
[14]
2017, A&A, 600, A137 Gaia Collaboration, Brown, A
Freytag, B., Liljegren, S., & H¨ ofner, S. 2017, A&A, 600, A137 Gaia Collaboration, Brown, A. G. A., Vallenari, A., et al. 2018, A&A, 616, A1
2017
-
[15]
1988, A&A, 192, 206
Gillet, D. 1988, A&A, 192, 206
1988
-
[16]
S., & Feast, M
Glass, I. S., & Feast, M. W. 1982, MNRAS, 199, 245
1982
-
[17]
S., & Lloyd Evans, T
Glass, I. S., & Lloyd Evans, T. 1981, Nature, 291, 303
1981
-
[18]
R., van Loon, J
Goldman, S. R., van Loon, J. T., Zijlstra, A. A., et al. 2017, MNRAS, 465, 403 Mira variables at maximum-light 17
2017
-
[19]
R., van Loon, J
Goldman, S. R., van Loon, J. T., G´ omez, J. F., et al. 2018, MNRAS, 473, 3835
2018
-
[20]
R., Boyer, M
Goldman, S. R., Boyer, M. L., McQuinn, K. B. W., et al. 2019, ApJ, 877, 49 Gravity Collaboration, Abuter, R., Amorim, A., et al. 2019, A&A, 625, L10
2019
-
[21]
K., & Duffau, S
Haschke, R., Grebel, E. K., & Duffau, S. 2011, AJ, 141, 158
2011
-
[22]
Z., Long, J., & Macri, L
He, S., Yuan, W., Huang, J. Z., Long, J., & Macri, L. M. 2016, AJ, 152, 164 H¨ ofner, S., & Olofsson, H. 2018, A&A Rv, 26, 1
2016
-
[23]
D., Riess, A
Huang, C. D., Riess, A. G., Hoffmann, S. L., et al. 2018, ApJ, 857, 67
2018
-
[24]
J., Scholz, M., & Wood, P
Ireland, M. J., Scholz, M., & Wood, P. R. 2011, MNRAS, 418, 114
2011
-
[25]
2011, MNRAS, 412, 2345
Ita, Y., & Matsunaga, N. 2011, MNRAS, 412, 2345
2011
-
[26]
2018, MNRAS, 481, 4206
Ita, Y., Matsunaga, N., Tanab´ e, T., et al. 2018, MNRAS, 481, 4206
2018
-
[27]
S., Stanek, K
Jayasinghe, T., Kochanek, C. S., Stanek, K. Z., et al. 2018, MNRAS, 477, 3145
2018
-
[28]
Joy, A. H. 1926, ApJ, 63, doi:10.1086/142979 —. 1947, ApJ, 106, 288 —. 1954, ApJS, 1, 39
1926 doi
-
[29]
M., Hendry, M
Kanbur, S. M., Hendry, M. A., & Clarke, D. 1997, MNRAS, 289, 428
1997
-
[30]
M., Ngeow, C., Nanthakumar, A., & Stevens, R
Kanbur, S. M., Ngeow, C., Nanthakumar, A., & Stevens, R. 2007, PASP, 119, 512
2007
-
[31]
Karakas, A. I. 2014, MNRAS, 445, 347
2014
-
[32]
2009, ApJ, 707, 632
Lacour, S., Thi´ ebaut, E., Perrin, G., et al. 2009, ApJ, 707, 632
2009
-
[33]
2018, A&A, 616, L13
Lebzelter, T., Mowlavi, N., Marigo, P., et al. 2018, A&A, 616, L13
2018
-
[34]
2018, A&A, 619, A47 Lloyd Evans, T
Liljegren, S., H¨ ofner, S., Freytag, B., & Bladh, S. 2018, A&A, 619, A47 Lloyd Evans, T. 1971, in The Magellanic Clouds, ed. A. B
2018
-
[35]
G., & Bowen, G
Luttermoser, D. G., & Bowen, G. H. 1992, in Cool Stars, Stellar Systems, and the Sun, ed. M. S. Giampapa & J. A. Bookbinder, Vol. 26, 558
1992
-
[36]
M., Ngeow, C.-C., Kanbur, S
Macri, L. M., Ngeow, C.-C., Kanbur, S. M., Mahzooni, S., & Smitka, M. T. 2015, AJ, 149, 117
2015
-
[37]
Marigo, P., Bressan, A., Nanni, A., Girardi, L., & Pumo, M. L. 2013, MNRAS, 434, 488
2013
-
[38]
2017, ApJ, 835, 77
Marigo, P., Girardi, L., Bressan, A., et al. 2017, ApJ, 835, 77
2017
-
[39]
2012, APSS, 341, 93
Matsunaga, N. 2012, APSS, 341, 93
2012
-
[40]
W., & Menzies, J
Matsunaga, N., Feast, M. W., & Menzies, J. W. 2009, MNRAS, 397, 933
2009
-
[41]
W., Feast, M
Matsunaga, N., Menzies, J. W., Feast, M. W., et al. 2017, MNRAS, 469, 4949
2017
-
[42]
T., Dupree, A
McDonald, I., van Loon, J. T., Dupree, A. K., & Boyer, M. L. 2010, MNRAS, 405, 1711
2010
-
[43]
W., Whitelock, P
Menzies, J. W., Whitelock, P. A., & Feast, M. W. 2015, MNRAS, 452, 910
2015
-
[44]
Merrill, P. W. 1940, Spectra of long-period variable stars (Chicago, Ill., The University of Chicago press [1940])
1940
-
[45]
2018, A&A, 618, A58
Mowlavi, N., Lecoeur-Ta¨ ıbi, I., Lebzelter, T., et al. 2018, A&A, 618, A58
2018
-
[46]
2018, MNRAS, 473, 3131
Muraveva, T., Subramanian, S., Clementini, G., et al. 2018, MNRAS, 473, 3131
2018
-
[47]
2006, ApJ, 638, 839 Pietrzy´ nski, G., Graczyk, D., Gallenne, A., et al
Nishiyama, S., Nagata, T., Kusakabe, N., et al. 2006, ApJ, 638, 839 Pietrzy´ nski, G., Graczyk, D., Gallenne, A., et al. 2019, Nature, 567, 200 Planck Collaboration, Aghanim, N., Akrami, Y., et al. 2018, ArXiv, 1807.06209
2006 arXiv
-
[48]
J., & Goldston, J
Reid, M. J., & Goldston, J. E. 2002, ApJ, 568, 931
2002
-
[49]
2004, A&A, 413, 903
Rejkuba, M. 2004, A&A, 413, 903
2004
-
[50]
2003, A&A, 400, 319
Sedlmayr, E. 2003, A&A, 400, 319
2003
-
[51]
2010, ApJ, 723, 1195
Riebel, D., Meixner, M., Fraser, O., et al. 2010, ApJ, 723, 1195
2010
-
[52]
2019, ApJ, 876, 85
Scolnic, D. 2019, ApJ, 876, 85
2019
-
[53]
G., Macri, L
Riess, A. G., Macri, L. M., Hoffmann, S. L., et al. 2016, ApJ, 826, 56
2016
-
[54]
J., & Boothroyd, A
Sackmann, I. J., & Boothroyd, A. I. 1992, ApJL, 392, L71
1992
-
[55]
J., Prieto, J
Shappee, B. J., Prieto, J. L., Grupe, D., et al. 2014, ApJ, 788, 48
2014
-
[56]
R., Kanbur, S
Simon, N. R., Kanbur, S. M., & Mihalas, D. 1993, ApJ, 414, 310
1993
-
[57]
C., Matsunaga, N., Matsuura, M., et al
Sloan, G. C., Matsunaga, N., Matsuura, M., et al. 2010, ApJ, 719, 1274
2010
-
[58]
C., Matsuura, M., Lagadec, E., et al
Sloan, G. C., Matsuura, M., Lagadec, E., et al. 2012, ApJ, 752, 140
2012
-
[59]
C., Kraemer, K
Sloan, G. C., Kraemer, K. E., McDonald, I., et al. 2016, ApJ, 826, 44 Soszy´ nski, I., Wood, P. R., & Udalski, A. 2013a, ApJ, 779, 167
2016
-
[60]
A., Udalski, A., et al
Soszynski, I., Dziembowski, W. A., Udalski, A., et al. 2007, Acta Astron., 57, 201 Soszy´ nski, I., Udalski, A., Szyma´ nski, M. K., et al. 2009, Acta Astron., 59, 239 —. 2011, Acta Astron., 61, 217 —. 2013b, Acta Astron., 63, 21
2007
-
[61]
2015, A&A, 573, A135 18 Bhardwaj A
Subramanian, S., & Subramaniam, A. 2015, A&A, 573, A135 18 Bhardwaj A. et al
2015
-
[62]
R., Creech-Eakman, M
Thompson, R. R., Creech-Eakman, M. J., & van Belle, G. T. 2002, ApJ, 577, 447
2002
-
[63]
R., Montalb´ an, J., et al
Trabucchi, M., Wood, P. R., Montalb´ an, J., et al. 2017, ApJ, 847, 139 —. 2019, MNRAS, 482, 929
2017
-
[64]
Vassiliadis, E., & Wood, P. R. 1993, ApJ, 413, 641
1993
-
[65]
Whitelock, P. A. 2012, APSS, 341, 123
2012
-
[66]
A., Feast, M
Whitelock, P. A., Feast, M. W., & Van Leeuwen, F. 2008, MNRAS, 386, 313
2008
-
[67]
A., Feast, M
Whitelock, P. A., Feast, M. W., van Loon, J. T., & Zijlstra, A. A. 2003, MNRAS, 342, 86
2003
-
[68]
2016, A&A, 587, A12
Wittkowski, M., Chiavassa, A., Freytag, B., et al. 2016, A&A, 587, A12
2016
-
[69]
2018, A&A, 613, L7
Wittkowski, M., Rau, G., Chiavassa, A., et al. 2018, A&A, 613, L7
2018
-
[70]
Wood, P. R. 2000, PASA, 17, 18 —. 2015, MNRAS, 448, 3829
2000
-
[71]
R., Alcock, C., Allsman, R
Wood, P. R., Alcock, C., Allsman, R. A., et al. 1999, in Asymptotic Giant Branch Stars, ed. T. Le Bertre, A. Lebre, & C. Waelkens, Vol. 191, 151
1999
-
[72]
2017, ApJS, 232, 16
Yao, Y., Liu, C., Deng, L., de Grijs, R., & Matsunaga, N. 2017, ApJS, 232, 16
2017
-
[73]
M., He, S., et al
Yuan, W., Macri, L. M., He, S., et al. 2017, AJ, 154, 149
2017
-
[74]
M., Javadi, A., Lin, Z., & Huang, J
Yuan, W., Macri, L. M., Javadi, A., Lin, Z., & Huang, J. Z. 2018, AJ, 156, 112
2018
-
[75]
2012, RAA, 12, 723
Zhao, G., Zhao, Y.-H., Chu, Y.-Q., Jing, Y.-P., & Deng, L.-C. 2012, RAA, 12, 723
2012
Reviewed August 14, 2026 · model on record in the stance chip above.
Discussion (0). Continue with ORCID to comment.