REVIEW 3 major objections 6 minor 72 references
RSATree: Distribution-Aware Data Representation of Large-Scale Tabular Datasets for Flexible Visual Query
T0 review · 3 major / 6 minor · reviewed 2026-08-14 · deepseek-v4-flash
Pith's one-line read A three-part data structure can answer arbitrary aggregate queries on billion-row tabular data in under a millisecond by combining R-tree partitioning, locality-sensitive hashing, and summed-area tables.
desk verdict RSATree is a genuine engineering contribution with a real under-specification problem: it never explains how per-subspace histograms with different local binning are merged for non-distributive measures. read the letter →
The pith
A machine-rendered reading of the paper's core claim, the machinery that carries it, and where it could break.
The reading
What carries the argument
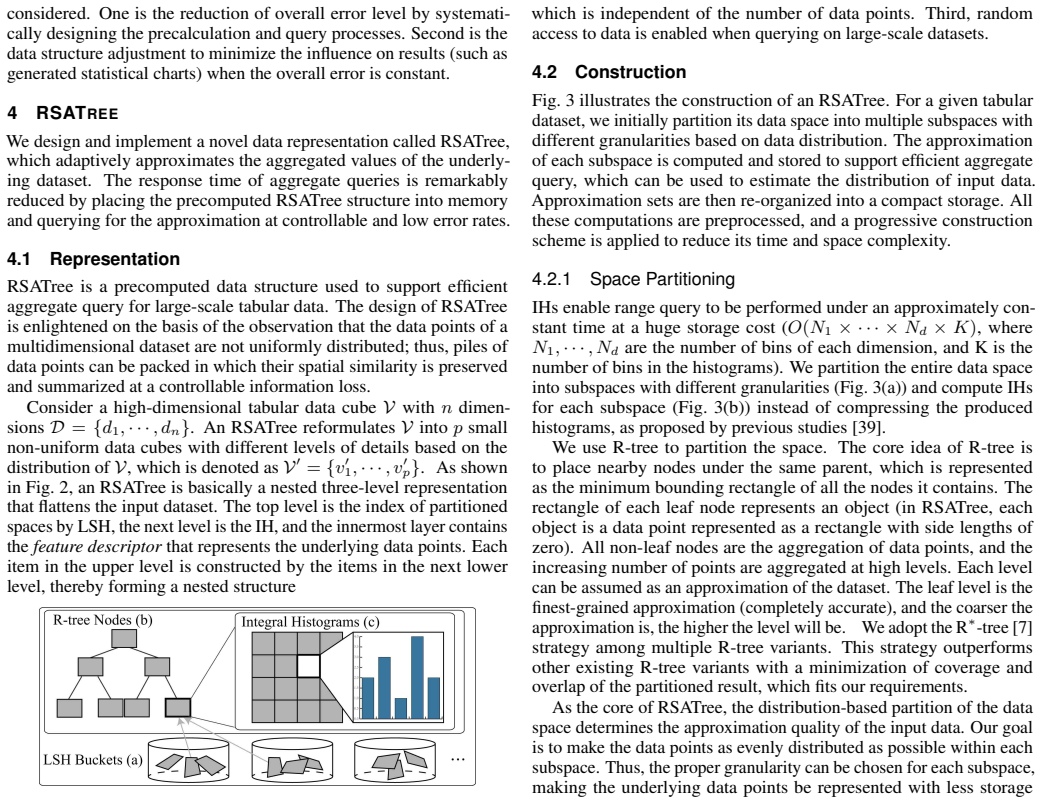
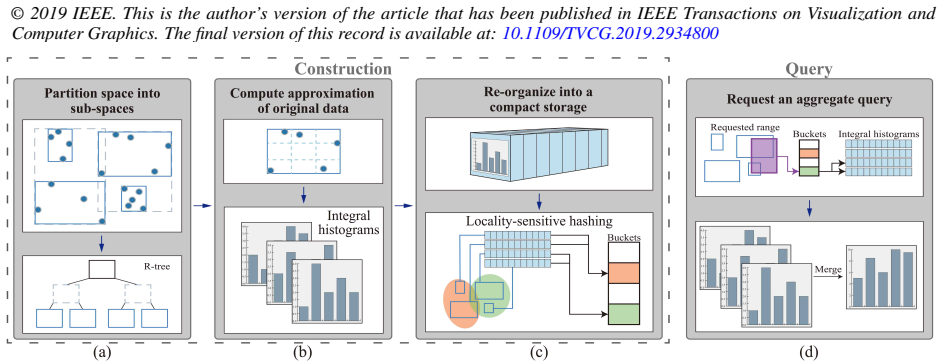
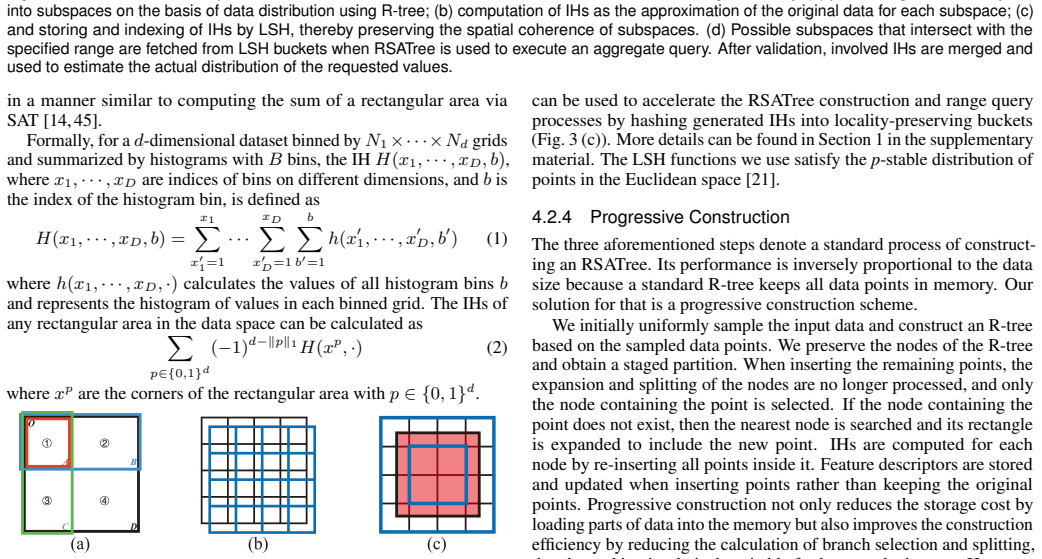
The central object is RSATree, a nested three-level data representation. The top level is a set of locality-sensitive hash buckets that group nearby subspaces; the middle level is a collection of integral histograms, one per R-tree subspace; the innermost feature descriptor stores the aggregate values, such as count, sum, or a histogram, for each cell. The load-bearing identity is the integral-histogram inclusion-exclusion formula, which computes the aggregate over any axis-aligned rectangle in constant time from $2^d$ corner values. The R-tree provides the distribution awareness: the modified R*-tree insertion criterion, minimizing area expansion weighted by density change, makes dense regions fine-grained and sparse regions coarse, which keeps storage low and error balanced across regions. The LSH buckets provide locality-preserving random access so a range query can fetch only the subspaces that intersect the query range.
What would settle it
Build an RSATree over a synthetic billion-row dataset whose distribution is a set of narrow Gaussian clusters, using a 2 percent uniform sample for the skeleton, then query ranges inside the smallest clusters; if the average relative error exceeds 10 percent or storage grows linearly with the number of inserted points, the uniform-sampling skeleton does not preserve the distribution.
Extended reading notes
Core claim
The paper's central claim is that the conflict between fast aggregate queries and flexible binning is not inherent. It introduces RSATree, a nested three-level representation: locality-sensitive hash buckets at the top that group spatially similar subspaces for random access; integral histograms in the middle that give constant-time rectangular aggregation; and feature descriptors at the leaf level that can hold counts, sums, or histograms depending on the measure. Construction uses an R*-tree variant whose insertion objective is modified to balance both area growth and density change, so subspaces track the distribution of points. Queries round the queried rectangle to the histogram grid, merge overlapping subspace histograms via the summed-area inclusion-exclusion formula, and return an approximate aggregate; a scale-alignment interaction step makes the computational grids coincide with integral-histogram cells as often as possible, more than halving errors. The experiments support the claim by showing near-constant response time as record count grows, construction time roughly linear in records, and storage that flattens once the progressive construction finishes, at the cost of a bounded average relative error.
Load-bearing premise
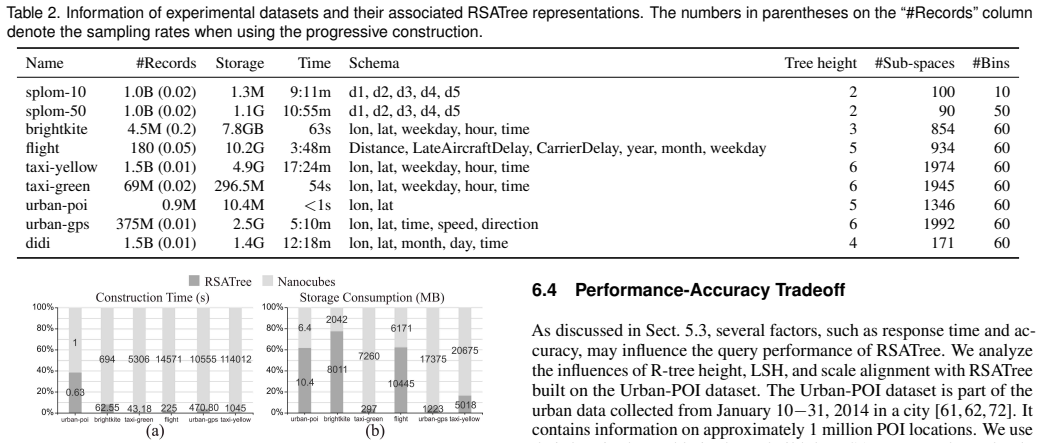
The load-bearing premise is that a uniform sample of the data yields an R-tree skeleton that preserves the true distribution, because all later points are inserted without re-splitting; the paper concedes that for the Flight dataset this fails, and storage keeps growing.
Editorial extensions
If this is right
- An analyst can change bin width continuously, switch to log-scale binning, or brush an arbitrary rectangular range and see an updated chart within interactive time, without rebuilding the data cube.
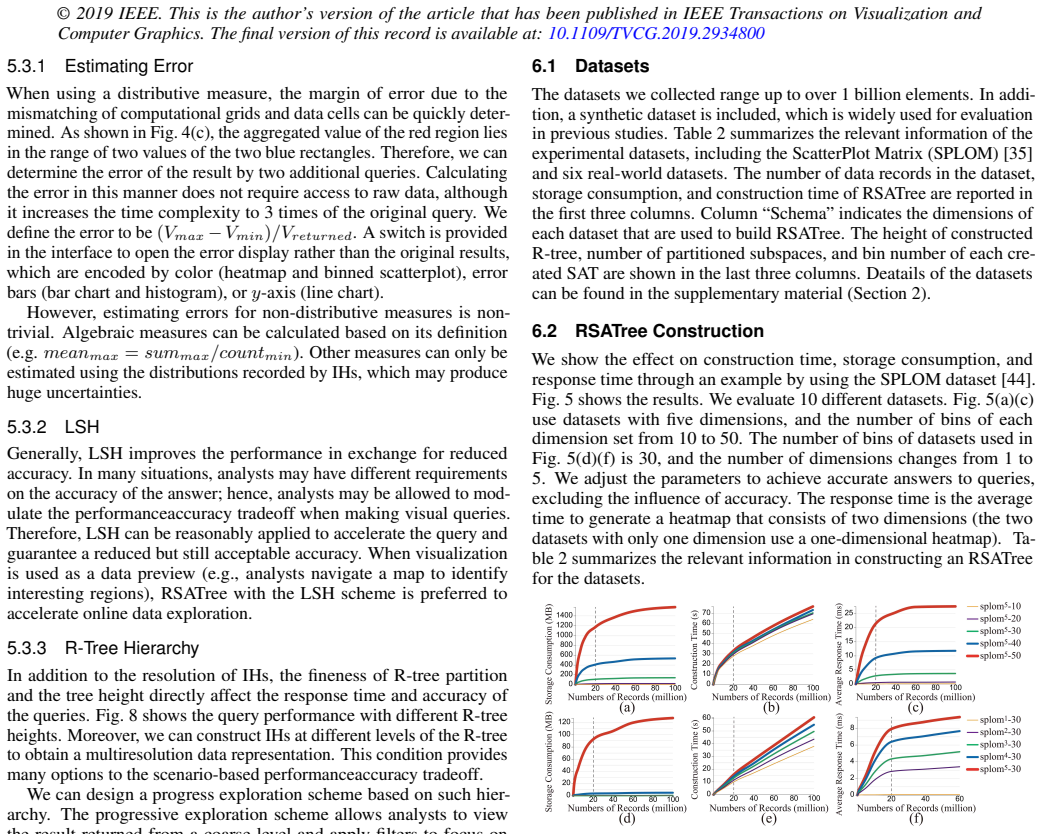
- Response time depends on the number of query bins and the candidate subspaces, not on the record count; the paper's plots show response time staying flat as datasets grow from hundreds of thousands to a billion records.
- Storage stays roughly constant after the initial sampled skeleton is built: the 1.0-billion-record synthetic set with 10 bins per dimension uses about 1.3 MB, and storage on large real datasets is smaller than a raw data cube.
- Approximate answers are controllable: average relative error is about 1 percent on the urban-POI dataset, 8 percent on Brightkite, and 9 percent on the Flight dataset, and scale alignment reduces error by more than half.
- Non-distributive measures such as median can be estimated from stored histograms, extending the approach beyond count and sum aggregates.
Reading between the lines
- If the uniform-sampling skeleton is the bottleneck, replacing it with stratified or learned sampling could fix the Flight-dataset failure mode while keeping the same storage-error trade-off; this is a natural next experiment.
- RSATree could be combined with active-view dimension reduction, where only the cubes associated with the current view are initialized, to make the approach work beyond five dimensions; the paper itself notes its low-dimensional limitation.
- The same machinery could answer quantile queries or moving-window aggregates over time series by using a finer local-histogram descriptor, since the storage form already supports histograms.
- A GPU or parallel backend could close the remaining latency gap to fixed-bin cubes, because the inclusion-exclusion formula and per-subspace merging parallelize naturally.
Signed reviews
Editorial analysis
A structured set of objections, weighed in public.
Referee Report
Summary. The paper introduces RSATree, a precomputed, memory-resident data structure for approximate aggregate queries over large tabular datasets. It combines an R*-tree-based adaptive space partitioning, locality-sensitive hashing for candidate lookup, and per-subspace integral histograms (IHs) to support arbitrary range queries and flexible binning without a fixed data-cube schema. Construction uses a progressive scheme that first builds the R-tree skeleton from a uniform sample and then inserts the remaining points without re-splitting. The authors report construction time, storage, and query latency on datasets up to 1.5 billion records, compare RSATree against Nanocubes and raw summed-area tables, and describe a web-based prototype and a small user study. The central claim is that RSATree enables 'arbitrary queries and flexible binning strategies' with low response time and low storage cost, including support for non-distributive measures estimated from recorded data distributions.
Significance. If the representation works as claimed, RSATree occupies a useful point in the design space: it promises interactive visual exploration with arbitrary binning on billion-row data, in contrast to precomputed-cube systems such as imMens, Nanocubes, and Hashedcubes that fix the binning schema. The paper is honest about several limitations, states design requirements R1–R4 clearly, and provides an experimental comparison with baseline structures. The central idea is interesting, but the load-bearing question of how per-subspace local histograms are merged for non-distributive measures is not addressed, and the absence of supplementary materials and code limits verification of the LSH-based query path and the reported measurements. Because the core representation is plausible and the query-merge issue is local in principle, the paper merits a major revision rather than rejection.
major comments (3)
- [§4.2.2 and §4.3 (Fig. 3(d))] The querying description leaves a critical gap for non-distributive measures. Section 4.2.2 states that each subspace's IH is built using 'the local range of data points in each subspace to enable dynamic binning,' so different subspaces generally have different histogram bin edges. Section 4.3 says that a query 'collects a set of histogram tables overlapping with R' and Fig. 3(d) says 'involved IHs are merged.' The paper never specifies how histograms with non-coincident bin boundaries are aligned or interpolated before merging. Directly summing counts in incompatible bins is incorrect, and the only alignment technique discussed, scale alignment in §5.2, aligns computational grids to IH cells for distributive aggregates rather than aligning histogram bins across subspaces. This gap matters because Table 1 explicitly claims support for non-algebraic measures, which rely on the recorded distributions. Please provide the exact merging/re-binning procedure and validate its error behavior on queries that span multiple subspaces.
- [§7.1, Fig. 6(c), Tables 2–3] The progressive construction scheme is load-bearing for the scalability claims, but its central assumption is acknowledged to fail on the Flight dataset: §7.1 states that 'the uniform sampling fails to capture the data distribution well,' and Fig. 6(c) shows storage continuing to grow after progressive construction begins. Table 2 still reports Flight as one of the experimental datasets, and Table 3 reports its mean ARE as 9.01%. Since these results are used to support the low-storage/low-error claim, the paper should either characterize the conditions under which uniform sampling preserves the data distribution, provide bounds on storage and error degradation when it does not, or describe a fallback partitioning strategy. As written, the claim is not robust across the presented datasets.
- [§4.2.3, §4.3, §6.1, §6.3] The manuscript defers essential details to a supplementary document that is not provided in the submission: the LSH range-query extension (§4.2.3, 'More details can be found in Section 1 in the supplementary material'), the batched IH query algorithm (§4.3), dataset details (§6.1), and the full user-study results (§6.3). No source code or data artifacts are supplied. Without these, the correctness of the LSH-based candidate selection and the reproducibility of the measurements cannot be assessed. Please include the supplementary material and, ideally, the implementation or detailed pseudocode for the core query path.
minor comments (6)
- [Table 1] The 'Demonstrated data size' row lists 10^12 for RSATree, but the largest dataset in Table 2 has 1.5×10^9 records; please correct the order of magnitude.
- [Abstract] The phrase 'a summed area table scheme to support interactive query of aggregated values with a linear computational complexity' is imprecise; SAT-based queries are O(1) in the grid resolution and the intended meaning should be clarified.
- [§6.3, Table 3] The user study with eight participants is reported only as a summary; Table 3 gives means and medians without confidence intervals or per-participant variability, and the qualitative questionnaire result is stated without supporting statistics. Please either provide the supplementary analysis or temper the claims.
- [§5.3.1] The error definition (Vmax−Vmin)/Vreturned is not normalized clearly; as stated, it can become very large when Vreturned is near zero, so the paper should define a bounded relative-error measure or state the intended convention explicitly.
- [§4.2.1] The modification of the R*-tree insertion penalty introduces a density change ratio and then simplifies it to (areanew/area)×(areanew−area), dropping the n/(n+1) factor; the text should state explicitly that this simplification is approximate for large n.
- [§4.3, Eq. (2)] The notation ‖p‖1 in Eq. (2) is used without defining p as a vector in {0,1}^d; please add the definition for clarity.
Circularity Check
No circularity: RSATree's claims are supported by external experiments and standard building blocks.
full rationale
RSATree is a systems construction paper: its central claim is that combining R*-tree partitioning, per-subspace integral histograms, and locality-sensitive hashing yields fast approximate aggregate queries with flexible binning. No first-principles result is derived from a fitted parameter, and no prediction is defined in terms of the quantity it is said to predict. The building blocks are standard and cited to independent prior work (R*-tree [7], integral histograms [52], LSH [21], summed-area tables [20]); no load-bearing premise is justified solely by the authors' own prior publications. The evaluation compares RSATree against raw summed-area baselines S1/S2 and Nanocubes on response time, storage, and error, which are external measurements rather than algebraic identities. Per-dataset choices such as sample rate, tree height, and bin count are reported in Table 2 and affect the performance/accuracy tradeoff, but they are not fitted to force the conclusion, and the paper explicitly acknowledges failure modes (Section 7.1: uniform sampling fails to capture the Flight dataset distribution; Section 7.2: RSATree does not support more than five dimensions well), showing the claims are falsifiable rather than protected. The under-specified merging of locally binned histograms across subspaces is a correctness/completeness risk, but it is not a circular reduction of a conclusion into its input. The derivation chain is therefore self-contained with respect to its own claims.
Assumptions & free parameters
free parameters (4)
- sampling_rate =
0.01 to 0.2 per dataset
- IH bin count =
60 (mostly), 10 or 50 for SPLOM
- R-tree height =
2 to 6
- scale size for scale alignment =
e.g., 3600
assumptions (4)
- domain assumption Uniform sampling of input data preserves the spatial distribution for R-tree construction.
- domain assumption R-tree orthogonal partitioning can represent complex high-dimensional distributions with low approximation error.
- domain assumption LSH with uniform sampling on range edges returns all integral histograms overlapping a query range.
- standard math Integral histogram inclusion-exclusion (Equation 2) over discretized grids approximates continuous range sums with bounded error.
Cite this review
Pith. "Pith review of RSATree: Distribution-Aware Data Representation of Large-Scale Tabular Datasets for Flexible Visual Query." pith.science (2026). https://pith.science/paper/IVKCJDH4
@misc{pith2026190802005,
  author       = {Pith},
  title        = {Pith review of: RSATree: Distribution-Aware Data Representation of Large-Scale Tabular Datasets for Flexible Visual Query},
  year         = {2026},
  howpublished = {\url{https://pith.science/paper/IVKCJDH4}},
  note         = {Machine review of arXiv:1908.02005}
}
read the original abstract
Analysts commonly investigate the data distributions derived from statistical aggregations of data that are represented by charts, such as histograms and binned scatterplots, to visualize and analyze a large-scale dataset. Aggregate queries are implicitly executed through such a process. Datasets are constantly extremely large; thus, the response time should be accelerated by calculating predefined data cubes. However, the queries are limited to the predefined binning schema of preprocessed data cubes. Such limitation hinders analysts' flexible adjustment of visual specifications to investigate the implicit patterns in the data effectively. Particularly, RSATree enables arbitrary queries and flexible binning strategies by leveraging three schemes, namely, an R-tree-based space partitioning scheme to catch the data distribution, a locality-sensitive hashing technique to achieve locality-preserving random access to data items, and a summed area table scheme to support interactive query of aggregated values with a linear computational complexity. This study presents and implements a web-based visual query system that supports visual specification, query, and exploration of large-scale tabular data with user-adjustable granularities. We demonstrate the efficiency and utility of our approach by performing various experiments on real-world datasets and analyzing time and space complexity.
Figures

Figures from the paper (5 more)


Reference graph
Works this paper leans on
-
[1]
S. Acharya, P. B. Gibbons, V . Poosala, and S. Ramaswamy. Join Synopses for Approximate Query Answering. In ACM SIGMOD Record, vol. 28, pp. 275–286. ACM, 1999
work page 1999
-
[2]
S. Agarwal, B. Mozafari, A. Panda, H. Milner, S. Madden, and I. Stoica. Blinkdb: queries with bounded errors and bounded response times on very large data. In Proceedings of the 8th ACM European Conference on Computer Systems, pp. 29–42. ACM, 2013
work page 2013
-
[3]
C. Ahlberg. Spotfire: an Information Exploration Environment. ACM SIGMOD Record, 25(4):25–29, 1996
work page 1996
-
[4]
H. Ahn, N. Mamoulis, and H. M. Wong. A Survey on Multidimensional Access Methods. Technical report, Hong Kong University of Science and Technology, 1997
work page 1997
-
[5]
D. Barbar´a and M. Sullivan. Quasi-Cubes: Exploiting approximations in multidimensional databases. ACM SIGMOD Record, 26(3):12–17, 1997
work page 1997
- [6]
-
[7]
N. Beckmann, H.-P. Kriegel, R. Schneider, and B. Seeger. The r*-tree: an efficient and robust access method for points and rectangles. In Acm Sigmod Record, vol. 19, pp. 322–331. Acm, 1990
work page 1990
-
[8]
M. Behrisch, F. Korkmaz, L. Shao, and T. Schreck. Feedback-Driven Interactive Exploration of Large Multidimensional Data Supported by Visual Classifier. In Visual Analytics Science and Technology (VAST), 2014 IEEE Conference on, pp. 43–52. IEEE, 2014
work page 2014
Show all 72 references
-
[9]
J. L. Bentley. Multidimensional Binary Search Trees in Database Ap- plications. IEEE Transactions on Software Engineering , (4):333–340, 1979
1979
-
[10]
Bertini and G
E. Bertini and G. Santucci. Give chance a chance: modeling density to enhance scatter plot quality through random data sampling. Information Visualization, 5(2):95–110, 2006
2006
-
[11]
Bostock, V
M. Bostock, V . Ogievetsky, and J. Heer. D3 Data-Driven Documents. IEEE Transactions on Visualization and Computer Graphics, 17(12):2301–2309, 2011
2011
-
[12]
Catarci, M
T. Catarci, M. F. Costabile, S. Levialdi, and C. Batini. Visual Query Sys- tems for Databases: A Survey. Journal of Visual Languages & Computing, 8(2):215–260, 1997
1997
-
[13]
Chakrabarti, M
K. Chakrabarti, M. Garofalakis, R. Rastogi, and K. Shim. Approximate query processing using wavelets. The International Journal on Very Large Data Bases, 10(2-3):199–223, 2001
2001
-
[14]
Chaudhuri, T
A. Chaudhuri, T. H. Wei, T. Y . Lee, H. W. Shen, and T. Peterka. Efficient Range Distribution Query for Visualizing Scientific Data. In Visualization Symposium (PacificVis), 2014 IEEE Pacific, pp. 201–208. IEEE, 2014
2014
-
[15]
Chaudhuri, G
S. Chaudhuri, G. Das, M. Datar, R. Motwani, and V . Narasayya. Over- coming limitations of sampling for aggregation queries. In International Conference on Data Engineering, pp. 534–542. IEEE, 2001
2001
-
[16]
Chaudhuri and U
S. Chaudhuri and U. Dayal. An Overview of Data Warehousing and OLAP Technology. ACM Sigmod record, 26(1):65–74, 1997
1997
-
[17]
H. Chen, W. Chen, H. Mei, Z. Liu, K. Zhou, W. Chen, W. Gu, and K.-L. Ma. Visual abstraction and exploration of multi-class scatterplots. IEEE Transactions on Visualization and Computer Graphics, 20(12):1683–1692, 2014
2014
-
[18]
W. Chen, F. Guo, and F.-Y . Wang. A survey of traffic data visualization. IEEE Transactions on Intelligent Transportation Systems , 16(6):2970– 2984, 2015
2015
-
[19]
W. Chen, Z. Huang, F. Wu, M. Zhu, H. Guan, and R. Maciejewski. Vaud: A visual analysis approach for exploring spatio-temporal urban data.IEEE Transactions on Visualization and Computer Graphics, 24(9):2636–2648, 2017
2017
-
[20]
F. C. Crow. Summed-Area Tables for Texture Mapping. In ACM SIG- GRAPH computer graphics, vol. 18, pp. 207–212. ACM, 1984
1984
-
[21]
Datar, N
M. Datar, N. Immorlica, P. Indyk, and V . S. Mirrokni. Locality-Sensitive Hashing Scheme Based on p-Stable Distributions. In Proceedings of the twentieth annual symposium on Computational geometry, pp. 253–262. ACM, 2004
2004
-
[22]
Derthick, J
M. Derthick, J. Kolojejchick, and S. F. Roth. An Interactive Visualization Environment for Data Exploration. In KDD, pp. 2–9, 1997
1997
-
[23]
Fekete and R
J.-D. Fekete and R. Primet. Progressive analytics: A computation paradigm for exploratory data analysis. arXiv preprint arXiv:1607.05162, 2016
2016 arXiv
-
[24]
Fisher, I
D. Fisher, I. Popov, S. Drucker, et al. Trust Me, I’m Partially Right: Incremental Visualization Lets Analysts Explore Large Datasets Faster. In Proceedings of the SIGCHI Conference on Human Factors in Computing Systems, pp. 1673–1682. ACM, 2012
2012
-
[25]
J. Gray, S. Chaudhuri, A. Bosworth, A. Layman, D. Reichart, M. Venka- trao, F. Pellow, and H. Pirahesh. Data Cube: A Relational Aggregation Operator Generalizing Group-By, Cross-Tab, and Sub-Totals.Data mining and knowledge discovery, 1(1):29–53, 1997
1997
-
[26]
A. Guttman. R-trees: A Dynamic Index Structure for Spatial Searching. In Proceedings of the 1984 ACM SIGMOD International Conference on Management of Data, pp. 47–57. ACM, 1984
1984
-
[27]
C. G. Healey and B. M. Dennis. Interest Driven Navigation in Visual- ization. IEEE Transactions on Visualization and Computer Graphics , 18(10):1744–1756, 2012
2012
-
[28]
Heer and B
J. Heer and B. Shneiderman. Interactive Dynamics for Visual Analysis. Queue, 10(2):30, 2012
2012
-
[29]
J. M. Hellerstein, P. J. Haas, and H. J. Wang. Online Aggregation. In Acm Sigmod Record, vol. 26, pp. 171–182. ACM, 1997
1997
-
[30]
Hensley, T
J. Hensley, T. Scheuermann, G. Coombe, M. Singh, and A. Lastra. Fast summed-area table generation and its applications. In Computer Graphics Forum, vol. 24, pp. 547–555. Wiley Online Library, 2005
2005
-
[31]
Huang, Y
Z. Huang, Y . Lu, E. Mack, W. Chen, and R. Maciejewski. Exploring the sensitivity of choropleths under attribute uncertainty. IEEE Transactions on Visualization and Computer Graphics, 2019
2019
-
[32]
Jermaine, A
C. Jermaine, A. Dobra, S. Arumugam, S. Joshi, and A. Pol. The Sort- Merge-Shrink Join. ACM Transactions on Database Systems (TODS) , 31(4):1382–1416, 2006
2006
-
[33]
Joshi and C
S. Joshi and C. Jermaine. Materialized Sample Views for Database Ap- proximation. IEEE Transactions on Knowledge and Data Engineering, 20(3):337–351, 2008
2008
-
[34]
Kamat, P
N. Kamat, P. Jayachandran, K. Tunga, and A. Nandi. Distributed and interactive cube exploration. In Data Engineering (ICDE), 2014 IEEE 30th International Conference on, pp. 472–483. IEEE, 2014
2014
-
[35]
Kandel, R
S. Kandel, R. Parikh, A. Paepcke, J. M. Hellerstein, and J. Heer. Pro- filer: Integrated Statistical Analysis and Visualization for Data Quality Assessment. In Proceedings of the International Working Conference on Advanced Visual Interfaces, pp. 547–554. ACM, 2012
2012
-
[36]
A. Kim, E. Blais, A. Parameswaran, P. Indyk, S. Madden, and R. Rubinfeld. Rapid Sampling for Visualizations with Ordering Guarantees.Proceedings of the VLDB Endowment, 8(5):521–532, 2015
2015
-
[37]
Kraska, A
T. Kraska, A. Beutel, E. H. Chi, J. Dean, and N. Polyzotis. The case for learned index structures. In Proceedings of the 2018 International Conference on Management of Data, SIGMOD ’18, pp. 489–504. ACM, New York, NY , USA, 2018. doi: 10.1145/3183713.3196909
2018
-
[38]
Lazaridis and S
I. Lazaridis and S. Mehrotra. Progressive Approximate Aggregate Queries with a Multi-Resolution Tree Structure. In ACM SIGMOD Record, vol. 30, pp. 401–412. ACM, 2001
2001
-
[39]
Lee and H.-W
T.-Y . Lee and H.-W. Shen. Efficient Local Statistical Analysis via Integral Histograms with Discrete Wavelet Transform. IEEE Transactions on Visualization and Computer Graphics, 19(12):2693–2702, 2013
2013
-
[40]
D. Li, H. Mei, Y . Shen, S. Su, W. Zhang, J. Wang, M. Zu, and W. Chen. Echarts: A declarative framework for rapid construction of web-based visualization. Visual Informatics, 2(2):136–146, 2018
2018
-
[41]
Q. Lin, W. Ke, J.-G. Lou, H. Zhang, K. Sui, Y . Xu, Z. Zhou, B. Qiao, and D. Zhang. BigIN4: Instant, Interactive Insight Identification for Multi-Dimensional Big Data. In Proceedings of the 24th ACM SIGKDD International Conference on Knowledge Discovery & Data Mining, pp. 547–5...
2018
-
[42]
L. Lins, J. T. Klosowski, and C. Scheidegger. Nanocubes for Real-Time Exploration of Spatiotemporal Datasets. IEEE Transactions on Visualiza- tion and Computer Graphics, 19(12):2456–2465, 2013
2013
-
[43]
Liu and J
Z. Liu and J. Heer. The Effects of Interactive Latency on Exploratory Visual Analysis. IEEE Transactions on Visualization and Computer Graph- ics, 20(12):2122–2131, 2014
2014
-
[44]
Z. Liu, B. Jiang, and J. Heer. imMens: Real-time Visual Querying of Big Data. In Computer Graphics Forum, vol. 32, pp. 421–430. Wiley Online Library, 2013. 10 © 2019 IEEE. This is the author’s version of the article that has been published in IEEE Transactions on Visualization...
2013
-
[45]
Martin and H.-W
S. Martin and H.-W. Shen. Transformations for V olumetric Range Dis- tribution Queries. In Visualization Symposium (PacificVis), 2013 IEEE Pacific, pp. 89–96. IEEE, 2013
2013
-
[46]
H. Mei, Y . Ma, Y . Wei, and W. Chen. The design space of construction tools for information visualization: A survey. Journal of Visual Languages & Computing, 44:120–132, 2018
2018
-
[47]
Mingliang, L
X. Mingliang, L. Pei, L. Mingyuan, F. Hao, Z. Hongling, Z. Bing, L. Yu- song, and Z. Liwei. Medical image denoising by parallel non-local means. Neurocomputing, 195:117–122, 2016
2016
-
[48]
Moritz, B
D. Moritz, B. Howe, and J. Heer. Falcon: Balancing interactive latency and resolution sensitivity for scalable linked visualizations. 2019
2019
-
[49]
C. A. Pahins, S. A. Stephens, C. Scheidegger, and J. L. Comba. Hashed- cubes: Simple, Low memory, Real-Time Visual Exploration of Big Data. IEEE Transactions on Visualization and Computer Graphics, 23(1):671– 680, 2017
2017
-
[50]
Y . Park, M. Cafarella, and B. Mozafari. Visualization-Aware Sampling for Very Large Databases. In IEEE 32nd International Conference on Data Engineering (ICDE), pp. 755–766. IEEE, 2016
2016
-
[51]
Poosala and V
V . Poosala and V . Ganti. Fast Approximate Query Answering Using Precomputed Statistics. In International Conference on Data Engineering, p. 252. IEEE, 1999
1999
-
[52]
F. Porikli. Integral Histogram: A Fast Way to Extract Histograms in Cartesian Spaces. In IEEE Computer Society Conference on Computer Vision and Pattern Recognition, vol. 1, pp. 829–836. IEEE, 2005
2005
-
[53]
Rahman, M
S. Rahman, M. Aliakbarpour, H. K. Kong, E. Blais, K. Karahalios, A. Parameswaran, and R. Rubinfield. I’ve Seen Enough: Incrementally Improving Visualizations to Support Rapid Decision Making.Proceedings of the VLDB Endowment, 10(11):1262–1273, 2017
2017
-
[54]
S. F. Roth, P. Lucas, J. A. Senn, C. C. Gomberg, M. B. Burks, P. J. Stroffolino, A. Kolojechick, and C. Dunmire. Visage: a User Interface Environment for Exploring Information. In Information Visualization’96, Proceedings IEEE Symposium on, pp. 3–12. IEEE, 1996
1996
-
[55]
H. Samet. The Quadtree and Related Hierarchical Data Structures. ACM Computing Surveys (CSUR), 16(2):187–260, 1984
1984
-
[56]
Sarvghad, B
A. Sarvghad, B. Saket, A. Endert, and N. Weibel. Embedded merge & split: Visual adjustment of data grouping. IEEE Transactions on Visualization and Computer Graphics, 25(1):800–809, 2018
2018
-
[57]
Shneiderman
B. Shneiderman. Dynamic queries for visual information seeking. IEEE software, 11(6):70–77, 1994
1994
-
[58]
Stolte, D
C. Stolte, D. Tang, and P. Hanrahan. Polaris: A System for Query, Analy- sis, and Visualization of Multidimensional Relational Databases. IEEE Transactions on Visualization and Computer Graphics, 8(1):52–65, 2002
2002
-
[59]
J. W. Tukey. Exploratory Data Analysis. Reading, Mass., 1977
1977
-
[60]
Vartak, S
M. Vartak, S. Rahman, S. Madden, A. Parameswaran, and N. Polyzotis. SEEDB: Efficient Data-Driven Visualization Recommendations to support Visual Analytics. Proceedings of the VLDB Endowment, 8(13):2182–2193, 2015
2015
-
[61]
F. Wang, W. Chen, Y . Zhao, T. Gu, S. Gao, and H. Bao. Adaptively explor- ing population mobility patterns in flow visualization. IEEE Transactions on Intelligent Transportation Systems, 18(8):2250–2259, 2017
2017
-
[62]
X. Wang, T. Gu, X. Luo, X. Cai, T. Lao, W. Chen, Y . Wu, J. Yu, and W. Chen. A user study on the capability of three geo-based features in analyzing and locating trajectories. IEEE Transactions on Intelligent Transportation Systems, 2018
2018
-
[63]
Z. Wang, N. Ferreira, Y . Wei, A. S. Bhaskar, and C. Scheidegger. Gaus- sian cubes: Real-time modeling for visual exploration of large multidi- mensional datasets. IEEE Transactions on Visualization and Computer Graphics, 23(1):681–690, 2017
2017
-
[64]
Wongsuphasawat, D
K. Wongsuphasawat, D. Moritz, A. Anand, J. Mackinlay, B. Howe, and J. Heer. V oyager: Exploratory Analysis via Faceted Browsing of Visu- alization Recommendations. IEEE Transactions on Visualization and Computer Graphics, 22(1):649–658, 2016
2016
-
[65]
J. Xia, G. Jiang, Y . Zhang, R. Li, and W. Chen. Visual subspace clustering based on dimension relevance. Journal of Visual Languages & Computing, 41:79–88, 2017
2017
-
[66]
J. Xia, F. Ye, W. Chen, Y . Wang, W. Chen, Y . Ma, and A. K. Tung. Ldsscanner: exploratory analysis of low-dimensional structures in high- dimensional datasets. IEEE transactions on visualization and computer graphics, 24(1):236–245, 2017
2017
-
[67]
M. Xu, H. Wang, S. Chu, Y . Gan, X. Jiang, Y . Li, and B. Zhou. Traffic sim- ulation and visual verification in smog. ACM Transactions on Intelligent Systems and Technology (TIST), 10(1):3, 2018
2018
-
[68]
M. Xu, Y . Wu, Y . Ye, I. Farkas, H. Jiang, and Z. Deng. Collective crowd formation transform with mutual information–based runtime feedback. In Computer Graphics Forum, vol. 34, pp. 60–73. Wiley Online Library, 2015
2015
-
[69]
Zgraggen, A
E. Zgraggen, A. Galakatos, A. Crotty, J.-D. Fekete, and T. Kraska. How progressive visualizations affect exploratory analysis. IEEE Transactions on Visualization & Computer Graphics, (8):1977–1987, 2017
1977
-
[70]
Y . Zhao, F. Luo, M. Chen, Y . Wang, J. Xia, F. Zhou, Y . Wang, Y . Chen, and W. Chen. Evaluating multi-dimensional visualizations for understanding fuzzy clusters. IEEE transactions on visualization and computer graphics, 25(1):12–21, 2018
2018
-
[71]
Z. Zhou, L. Meng, C. Tang, Y . Zhao, Z. Guo, M. Hu, and W. Chen. Visual abstraction of large scale geospatial origin-destination movement data. IEEE Transactions on Visualization and Computer Graphics, 25(1):43–53, 2018
2018
-
[72]
M. Zhu, W. Chen, J. Xia, Y . Ma, Y . Zhang, Y . Luo, Z. Huang, and L. Liu. Location2vec: a situation-aware representation for visual exploration of urban locations. IEEE Transactions on Intelligent Transportation Systems, 2019. 11
2019
Reviewed August 14, 2026 · model on record in the stance chip above.
Discussion (0). Continue with ORCID to comment.