REVIEW 4 major objections 7 minor 30 references
Multi-Strain Age-Structured Dengue Transmission Model: Analysis and Optimal Control
T0 review · 4 major / 7 minor · reviewed 2026-08-14 · deepseek-v4-flash
Pith's one-line read This paper argues that, in a four-strain age-structured dengue model of the Philippines, optimally delivered mosquito control and early medical care cut infections more than optimally delivered Dengvaxia vaccination.
desk verdict The Dengvaxia policy comparison collapses because vaccination removes people from the population instead of making them immune; the math is standard and the R0 derivation is fine, but the headline result is an artifact of that modeling choice. read the letter →
The pith
A machine-rendered reading of the paper's core claim, the machinery that carries it, and where it could break.
The reading
What carries the argument
The central object is a 17-dimensional scaled compartmental system in which susceptibility is indexed by the number of dengue strains a person has already had ($S_4$, $S_3$, $S_2$, $S_1$), so four serotypes are represented without tracking which strain infected whom; the two age groups $a$ and $b$ are the under-9/over-45 population and the 9-45 vaccine-eligible population. This structure lets the Dengvaxia control $u_3$ act only on previously infected 9-to-45-year-olds ($S_{1b}$, $S_{2b}$, $S_{3b}$), while transmission-reduction $u_1$ scales every infection term and medical-care $u_2$ scales every recovery term. The analysis machinery is Pontryagin's maximum principle applied to a Hamiltonian with quadratic control costs, giving explicit adjoint equations and a characterization of the three optimal controls.
What would settle it
Re-run the optimal-control simulation with $u_3$ transferring vaccinated susceptibles into the recovered classes $R_b$ (alive and immune) instead of subtracting them from the total population, leaving all other parameters unchanged, and compare the minimized infected totals; if Dengvaxia's total falls below the transmission-reduction total, the paper's central comparison is not robust.
Extended reading notes
Core claim
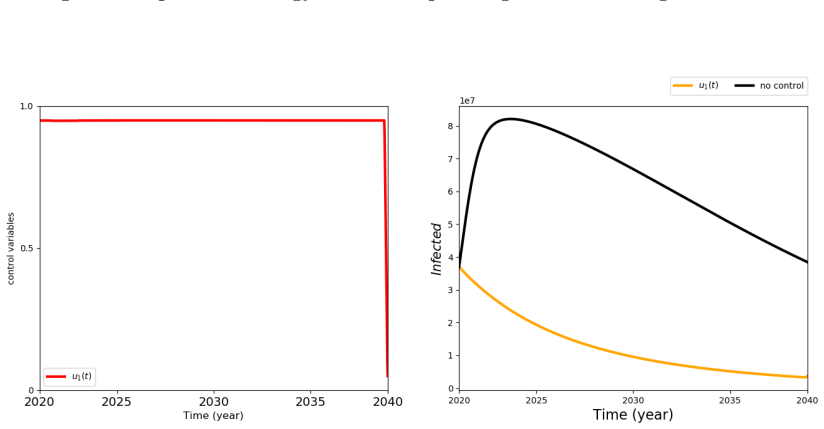
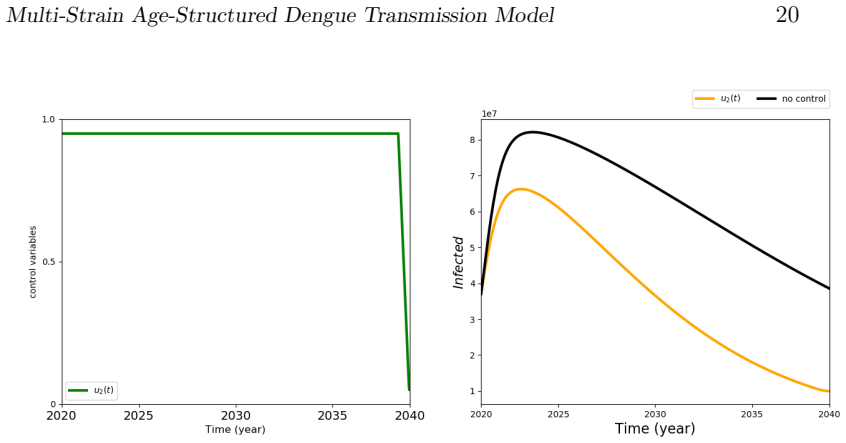
On the model's own terms, the main discovery is a ranking: with the same quadratic cost weights and a 2020-2040 horizon, the optimal transmission-reduction control $u_1$ produces a larger decrease in the total infected population than the optimal Dengvaxia vaccination control $u_3$, and combining $u_1$ with the early-medical-care control $u_2$ does even better. The model also yields a closed-form reproduction number $R_0$ that blends transmission in the two age groups and the rates at which people age between them, with stability when $R_0 < 1$. The numerical comparison rests on parameter choices from Philippine dengue surveillance and published transmission and recovery rates.
Load-bearing premise
The load-bearing premise is that vaccinating a susceptible 9-to-45-year-old removes that person from the population rather than making them immune and keeping them alive.
Editorial extensions
If this is right
- In the model, a sustained, well-run mosquito-control and early-treatment program yields a larger drop in dengue infections than a Dengvaxia campaign restricted to previously infected 9-to-45-year-olds.
- The optimal transmission-reduction and medical-care controls stay near their maximum for nearly the full 20-year horizon, so the modeled advantage depends on continuous effort, not a one-time campaign.
- The closed-form $R_0$ expression shows which age-group transmission and aging parameters drive endemicity, giving concrete targets for surveillance and intervention.
- Combining transmission reduction with proper medical care gives the largest modeled reduction, supporting integrated programs over a single intervention.
Reading between the lines
- A realistic vaccine that moves vaccinated susceptibles into an immune, alive class, rather than removing them from the population, could show a better Dengvaxia outcome than the paper reports; the removal assumption may bias the comparison.
- Because the model tracks only the number of past infections and not serotype identities, it cannot represent antibody-dependent enhancement; a strain-resolved model might assign a different value to a four-serotype vaccine.
- Equal cost weights $B_1=B_2=B_3=10^6$ are an assumption; if the real costs of vector control, clinic care, and vaccination differ substantially, the optimal mix of controls could shift even if the single-control ranking persists.
Signed reviews
Editorial analysis
A structured set of objections, weighed in public.
Referee Report
Summary. The paper proposes a deterministic compartmental model of dengue transmission with four serotypes, two age groups (9-45 years and the rest of the population), and state variables that track the number of previous infections rather than the specific infecting serotypes. It derives a basic reproduction number via the next-generation matrix, then formulates an optimal control problem over 2020-2040 with three controls: transmission reduction (u1), early medical care (u2), and Dengvaxia vaccination of seropositive 9-45-year-olds (u3). Using hand-calibrated parameters and stated initial conditions, the numerical simulations show that the optimal transmission-reduction strategy reduces the infected count more than the optimal Dengvaxia strategy, and the paper concludes that the usual intervention strategies are better than Dengvaxia.
Significance. If the comparison were reliable, the result would be directly relevant to dengue policy in the Philippines, where Dengvaxia has been banned, and the model's aggregation by number of previous infections is a useful dimensionality reduction for multi-strain dengue models. The R0 calculation is a standard, self-contained next-generation matrix derivation, and the optimal-control existence argument follows the usual Pontryagin route. However, the policy comparison is not supported as stated: vaccination is modeled as removal from the population, the parameters for non-primary infections and the initial conditions are not justified, and the printed optimality conditions contain inconsistencies. No code, sensitivity analysis, or reproducibility artifacts are provided, so the headline conclusion cannot be verified or interpreted.
major comments (4)
- [Section 3, Eq. (3)] The Dengvaxia control u3 is modeled as removal of seropositive susceptibles from the population rather than transfer to immunity: dS1b/dt, dS2b/dt, and dS3b/dt each contain -u3Sib, and dN/dt contains -u3(S3b+S2b+S1b), but no corresponding positive term adds these individuals to Rb or to any other compartment. Vaccinated persons therefore vanish from the system as if they had died, which reduces N and artificially increases the force of infection I/N on the remaining susceptibles while also lowering the future infected count by deleting susceptibles. Because the abstract's conclusion compares the optimal u3 strategy with the optimal u1 and u2 strategies, this unphysical removal mechanism is load-bearing; a corrected model should move u3Sib to an immune/recovered class with N conserved apart from natural and disease-induced deaths, and the simulations must be rerun under that model.
- [Section 3.2] The secondary, tertiary, and quaternary transmission coefficients are set as arbitrary fractions of the primary coefficients (alpha2a = 0.6125999 x alpha1a, alpha3a = 0.195696 x alpha1a, alpha4a = 0.017496 x alpha1a, with the same multipliers for group b), based only on the observed serotype distribution, and the recovery rates for later infections are taken as half of the primary recovery rates. These choices are not derived from data or from a mechanistic argument, and no sensitivity analysis is reported. Since Figures 2-5, and hence the ranking of controls, depend directly on these values, the headline result is an assumption-driven simulation rather than a robust finding. Parameter ranges and a sensitivity analysis (one-at-a-time or global) are needed before any policy conclusion can be drawn.
- [Section 3.3] The stated initial conditions imply that about 37 million of the approximately 110 million individuals are currently infected at t=0, i.e., roughly one-third of the population is simultaneously infectious. This is epidemiologically implausible for dengue and is not justified by any data source in the paper. Because the objective functional integrates I(t) over the whole 20-year horizon, this initial condition can dominate the optimal-control comparison and may bias the ranking of strategies. The authors should derive initial conditions from reported incidence or prevalence (for example by projecting the steady state or fitting to surveillance data) and show robustness to reasonable perturbations.
- [Section 3.1, Theorem 3.1] The optimality conditions as printed are not self-consistent and cannot be used to reproduce the simulations. In the proof, the equation for dH/du2 contains B3 u2 instead of B2 u2; the expression for Z in the theorem statement omits the gamma terms and lambda19 sum that appear in the later displayed Z within the proof; and the final characterization of u3* is 1/B3 [lambda12 S3b - lambda14 S2b - lambda16 S1b - lambda19(S3b+S2b+S1b)], which has the opposite signs from the expression (lambda12 S3b + lambda14 S2b + lambda16 S1b + lambda19(S3b+S2b+S1b))/B3 obtained from dH/du3 = 0. These discrepancies make it unclear whether the reported optimal controls and infected-count trajectories correspond to the stated problem.
minor comments (7)
- [Section 2, system (2)] In the equation for dS4B/dt, the quantity x is not defined; it is presumably 1 minus the other fractions, but this should be stated explicitly.
- [Section 2, definition of D] The domain D contains repeated conditions ('SiA >= 0' appears twice) and uses Ra and RB inconsistently with the scaled variables RA and RB.
- [Section 2, Theorem 2.1] The proof only checks nonnegativity on coordinate hyperplanes; it does not fully verify that the flow remains inside the simplex-type domain D, and the derivative inequality for the sum should be justified more carefully.
- [Section 3.2] The sentence assigning gamma1b = 2.0 x 10^{-7} and gamma1b = 3.0 x 10^{-7} sets the same parameter to two different values; presumably the second value is intended for gamma1a.
- [Section 3.3] The text refers to 'Theorem 4.1.1', but the optimal-control existence result is numbered Theorem 3.1 in the manuscript; this cross-reference should be corrected.
- [Section 3, control bounds] The controls are first said to range over the interval (0,1), but the optimization set Omega uses lower and upper bounds a=0.05 and b=0.95; this convention should be clarified.
- [Figures 2-5] The figures lack axis labels and clear legends, and the numerical method used to solve the optimal-control problem is not described; please add these details for reproducibility.
Circularity Check
No significant circularity; the policy comparison is a simulation output, not an identity or a fitted parameter renamed as a prediction.
full rationale
The paper's central comparison comes from numerically solving an optimal-control problem with explicitly stated model equations and literature-derived parameter estimates; it is not a fitted parameter renamed as a prediction, and no equation reduces to another by construction. The R0 calculation is a standard next-generation-matrix computation from the linearized infection subsystem and does not presuppose the reproduction number. The optimality system is derived from Pontryagin's maximum principle, and the control characterizations follow by differentiating the Hamiltonian; the equal cost weights B1=B2=B3=1e6 are imposed rather than derived, but imposing a cost weight is a modeling assumption, not a circular step. The most serious concern is that the Dengvaxia control u3 removes vaccinated susceptibles from the population through the terms -u3*Sib in the state equations and -u3(S3b+S2b+S1b) in dN/dt, rather than transferring them to the recovered class; this is an unphysical model assumption that may affect the quantitative policy comparison, but it is not circular because the conclusion is not encoded in that assumption by definition. There are no load-bearing self-citations and no uniqueness claim imported from the authors' prior work, so the derivation chain is self-contained.
Assumptions & free parameters
free parameters (12)
- Primary transmission coefficients alpha1a, alpha1b =
2.8125
- Secondary transmission coefficients alpha2a, alpha2b =
1.7229
- Tertiary transmission coefficients alpha3a, alpha3b =
0.550395
- Quaternary transmission coefficients alpha4a, alpha4b =
0.0478125
- Recovery rates beta =
beta1b=0.32833, beta1a=0.30, beta2-4b=0.164165, beta2-4a=0.15
- Infection death rates gamma =
gamma1a=3e-7, gamma1b=2e-7, gamma2-4a=6e-7, gamma2-4b=4e-7
- Birth and death rates mu, delta =
8.5e-4 and 4.5e-4
- Aging rates epsilon1, epsilon2 =
6.92e-5 each
- Initial conditions for all compartments =
Listed in Section 3.3
- Control cost weights B1, B2, B3 =
1e6 each
- Control bounds a, b =
0.05 and 0.95
- Time horizon T0, T1 =
2020 and 2040
assumptions (7)
- domain assumption Homogeneous mixing and mass action transmission
- domain assumption Vector population is not explicitly modeled; transmission is aggregated into alpha
- ad hoc to paper Two-pool age structure with constant transfer rates
- domain assumption Serotype identity is irrelevant; only the number of past infections matters
- ad hoc to paper Vaccinated susceptible people are removed from the population without becoming immune
- domain assumption All parameters are constant over the 20-year horizon
- ad hoc to paper Dengvaxia is given only to seropositive 9-45 year olds and confers immediate protection
Cite this review
Pith. "Pith review of Multi-Strain Age-Structured Dengue Transmission Model: Analysis and Optimal Control." pith.science (2026). https://pith.science/paper/ETAS5ZDV
@misc{pith2026190802196,
  author       = {Pith},
  title        = {Pith review of: Multi-Strain Age-Structured Dengue Transmission Model: Analysis and Optimal Control},
  year         = {2026},
  howpublished = {\url{https://pith.science/paper/ETAS5ZDV}},
  note         = {Machine review of arXiv:1908.02196}
}
read the original abstract
Dengue is a serious health problem in the Philippines. In 2016, the Department of Health of the country launched a dengue vaccination campaign using Dengvaxia. However, the campaign was mired with controversy and the use of Dengvaxia was banned in the country. This study proposes a mathematical model that represents the dynamics of the transmission of dengue with its four strains. Considering that the Dengvaxia vaccine was intended to be given only to people aging from 9 to 45 years old, the human population is divided into two age groups: from 9-45 years old and the rest of the population. Using this model and optimal control theory we simulate what could have been the effect of Dengvaxia in the number of dengue cases and then compare this with the other usual dengue intervention strategies. Results show that the best implementation of the usual strategies is better than that of Dengvaxia.
Figures


Figures from the paper (2 more)

Reference graph
Works this paper leans on
- [1]
-
[2]
A. Alto. Quicker, Cheaper, and Proudly Pinoy First Dengue Diagnostic Kit Developed by UP Manila Scientists, (2017). https://www.upm.edu.ph/node/2288
work page 2017
-
[3]
R. M. Anderson, Discussion: The Kermack-McKendrick epidemic thresh- old theorem. Bulletin of Mathematical Biology, 53(1-2) (1991), 1
work page 1991
- [4]
-
[5]
D. Bichara, A. Iggidr, & G. Sallet, Global analysis of multi-strains SIS, SIR and MSIR epidemic models. Journal of Applied Mathematics and Computing, 44(1-2) (2014), 273-292
work page 2014
-
[6]
Braun, Differential Equations and Their Applications, An Introduction to Applied Mathematics
M. Braun, Differential Equations and Their Applications, An Introduction to Applied Mathematics. Second edition. Springer-Verlag, New York Inc., 1975. Multi-Strain Age-Structured Dengue Transmission Model 22
work page 1975
-
[7]
A. de los Reyes V & J.M. Escaner IV, Dengue in the Philippines: model and analysis of parameters affecting transmission, Journal of Biological Dynamics, 12:1 (2018) 894-912
work page 2018
-
[8]
Department of Health (DOH) Philippines, Dengue Surveilance Update (Monthly dengue report), 2018
work page 2018
Show all 30 references
-
[9]
Department of Health (DOH) Philippines, Dengue (Health maps), 2018
2018
-
[10]
Derouich, A
M. Derouich, A. Boutayeb, & E.H. Twizell, A model of Dengue fever, BioMedical Engineering OnLine, 2(4) (2003)
2003
-
[11]
Driessche, & J
V. Driessche, & J. Watmough, Reproduction numbers and sub-threshold endemic equilibria for compartmental models of disease transmission, Math Biosci, 180 (2002), 29-48
2002
-
[12]
Heesterbeek, & J
Diekmann, J. Heesterbeek, & J. Metz, On the definition and the compu- tation of the basic reproductive ratio r0 in models for infectious diseases in heterogeneous populations, J Math Biol 28 (1990),365383
1990
-
[13]
Feng, & J
Z. Feng, & J. X. Velasco-Hernandez. Competitive exclusion in a vector host model for the Dengue fever. Journal of Mathematical Biology , 35 (1997), 523-544
1997
-
[14]
J. M. Hyman, & T. Laforce. Modeling the Spread of Influenza Among Cities, (2003)
2003
-
[15]
Kaplan, Advanced Calculus, 3rd ed., 1984
W. Kaplan, Advanced Calculus, 3rd ed., 1984
1984
-
[16]
W. O. Kermack, & A. G. McKendrick, Contributions to the mathematical theory of epidemics. II. The problem of endemicity. Proceedings of the Royal Society of London. Series A, containing papers of a mathematical and physical character, 138(834) (1932), 55-83
1932
-
[17]
S. Kim, A. de los Reyes V, & E. Jung. (2018). Mathematical model and intervention strategies for mitigating tuberculosis in the Philippines. Jour- nal of theoretical biology, 443, 100-112
2018
-
[18]
Kolman and D
B. Kolman and D. R. Hill, Elementary Linear Algebra with Applications (9th edition), 2008
2008
-
[19]
Larson, Elementary Linear Algebra 8th Edition
R. Larson, Elementary Linear Algebra 8th Edition . The Behrend College, The Pennsylvania State Univ., 2009
2009
-
[20]
Lenhart & J
S. Lenhart & J. Workman, Optimal Control Applied to Biological Models. Chapman & Hall/CRC Mathematical and Computational Biology Series, 2007. Multi-Strain Age-Structured Dengue Transmission Model 23
2007
-
[21]
Lope & J
J.E. Lope & J. Addawe, Analysis of age-structured malaria transmission model, Philippine Science Letters 5(2) (2012), 169-186
2012
-
[22]
Martcheva, An Introduction to Mathematical Epidemiology
M. Martcheva, An Introduction to Mathematical Epidemiology . Springer Science Business Media, New York, 2015
2015
-
[23]
M. S. M. Noorani, SEIR model for transmission of dengue fever in Selangor Malaysia. In International Journal of Modern Physics: Conference Series World Scientific Publishing Company , 9 (2012), 380- 389
2012
-
[24]
Nuraini, E
N. Nuraini, E. Soewong, & K. A. Sidarto . Mathematical Model of Dengue Disease Transmission with Severe DHF Compartment. Bulletin of the Malaysian Mathematical Sciences Society , 30(2) (2007), 143-157
2007
-
[25]
Pandey, A
A. Pandey, A. Mubayi, & J. Medlock. Comparing vector-host and SIR models for dengue transmission. Mathematical biosciences,246(2) (2013), 252-259
2013
-
[26]
Side, & M
S. Side, & M. S. M. Noorani, A SIR model for spread of dengue fever disease (simulation for South Sulawesi, Indonesia and Selangor, Malaysia), World Journal of Modeling and Simulation , 9(2) (2013), 96-105
2013
-
[27]
Tenenbaum & H
M. Tenenbaum & H. Pollard, Ordinary Differential Equations. Dover Pub- lications, Inc., 31 East 2nd Street, Mineola, N.Y., (11501) (1963)
1963
-
[28]
World Health Organization, Dengue and severe dengue (fact sheets), 2017
2017
-
[29]
World Health Organization, Dengue Control (fact sheets), 2017
2017
-
[30]
World Health Organization, Immunization, Vaccines and Biologicals (fact sheets), 2018
2018
Reviewed August 14, 2026 · model on record in the stance chip above.
Discussion (0). Continue with ORCID to comment.