REVIEW 4 major objections 6 minor 82 references
Varstrometry for Off-nucleus and Dual sub-Kpc AGN (VODKA): Methodology and Initial Results with Gaia DR2
T0 review · 4 major / 6 minor · reviewed 2026-08-14 · deepseek-v4-flash
Pith's one-line read Varstrometry turns quasar flicker into a black-hole-pair finder
desk verdict Useful methods paper with a correct analytic core and a genuinely useful extended-host systematic measurement, but the PMS validation of the Gaia excess-noise proxy is fragile and the candidate numbers are upper limits, not detections. read the letter →
The pith
A machine-rendered reading of the paper's core claim, the machinery that carries it, and where it could break.
The reading
What carries the argument
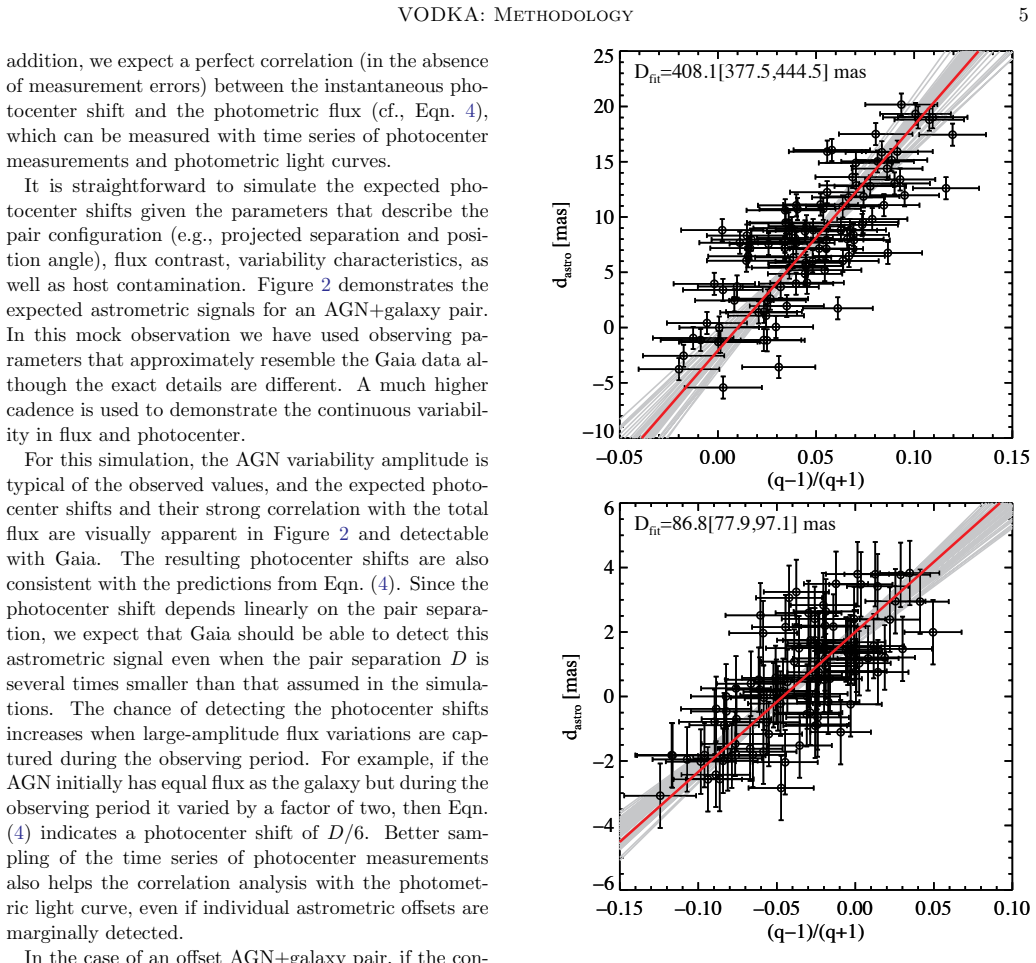
The named machinery is varstrometry, the photocenter wobble: for two unresolved components separated by $D$ with instantaneous flux ratio $q'\equiv f_2/f_1$, the photocenter sits at $d_{\rm astro}=(D/2)(q'-1)/(q'+1)$ along the pair axis. Because AGN vary stochastically and independently, this displacement executes bound, aperiodic motion and is linearly correlated with the total flux; its RMS for a dual AGN and for an off-nucleus single AGN is given by Eqns. (3) and (5). In Gaia DR2 the paper substitutes cataloged astrometric excess noise as an upper limit on this RMS and the G-band flux scatter as a proxy for photometric variability; the two proxies, together with the expected correlation of Eq. (4), carry the selection of sub-kpc candidates.
What would settle it
A decisive test: obtain diffraction-limited imaging (HST or VLBI) of SDSSJ000252.60-034345.1 at roughly 81 mas resolution spanning the 2014-2016 Gaia epoch; if no double source of comparable flux appears at the predicted 700 pc separation, the excess-noise-to-separation conversion fails. Alternatively, once epoch astrometry is available, check whether the photocenter of high-excess-noise quasars moves along a fixed axis and correlates with the G-band light curve as Eq. (4) requires; absence of that correlation means the excess is not varstrometry.
Extended reading notes
Core claim
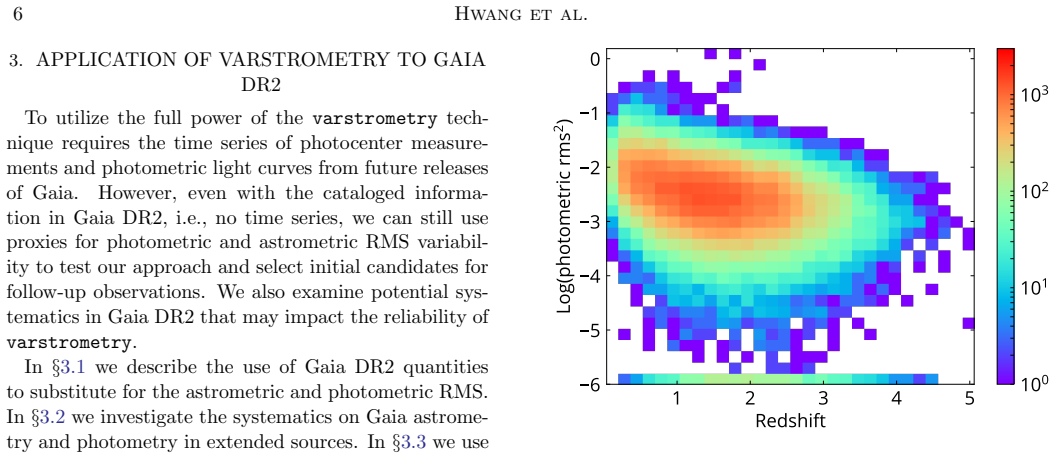
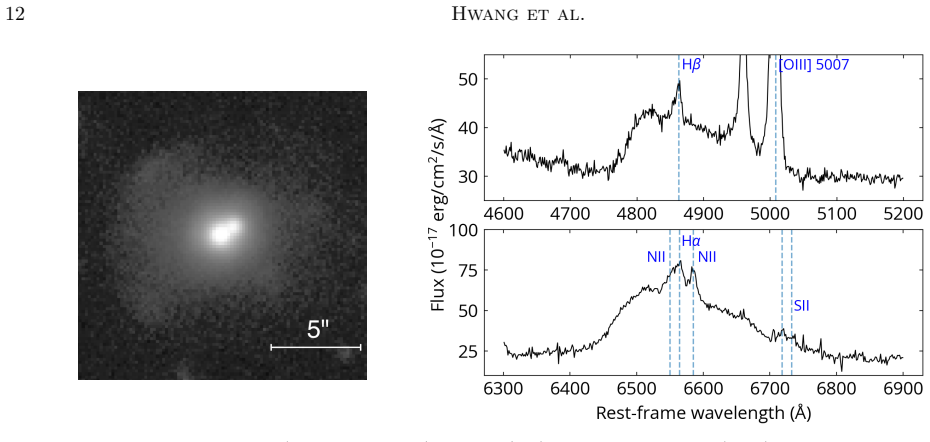
The paper's central claim is that variability-induced photocenter jitter can be detected or constrained with catalog-level Gaia DR2 data, and that it provides a previously missing route to sub-kpc dual and off-nucleus AGN. For an equal-flux pair with projected separation $D$, the expected astrometric RMS is approximately $(D/2)$ times the fractional photometric variability, so a 10% variability yields jitter at 5% of the separation; the paper tests this relation on 13 Gaia-unresolved pre-main-sequence binaries in Taurus-Auriga, where cataloged astrometric excess noise broadly tracks the jitter expected from Eq. (3). Applied to spectroscopically confirmed SDSS quasars brighter than $G=19.5$ and at $z>0.5$, the method combines photometric variability with astrometric excess noise above a roughly 1 mas reliability floor, and it identifies several hundred sub-kpc dual or off-nucleus AGN candidates, including SDSSJ000252.60-034345.1 at $z=1.39$ whose 3.7 mas excess noise would imply an 81 mas, about 700 pc, projected separation for an equal-flux pair. The paper also shows that extended host galaxies with $R_{50}>1''$ inflate Gaia's photometric and astrometric noise to roughly 15% and 10 mas, which is why the selection is restricted to redshifts where host light is subdominant.
Load-bearing premise
The load-bearing premise is that Gaia's reported astrometric excess noise is a faithful upper limit on variability-induced photocenter jitter in the selected quasars, rather than being dominated by extended-host morphology, scan-angle systematics, or faint unresolved companions.
Editorial extensions
If this is right
- A systematic census of sub-kpc dual and off-nucleus AGN becomes possible, filling the gap between about 10 pc and 1 kpc that current imaging surveys cannot fill.
- Non-detections of jitter become upper limits on offset distances for the whole quasar sample, so the technique can statistically constrain the wandering and recoiling supermassive black hole populations predicted by simulations.
- Once Gaia releases epoch astrometry and light curves, the predicted linear correlation between photocenter position and flux, with slope $D/2$, turns a candidate into a measured separation without additional imaging.
- The same proxy selection can be extended from SDSS quasars to the all-sky WISE quasar sample, turning a demonstration into a full-sky candidate catalog.
- For known test systems like CID-42, agreement between expected and measured jitter shows the method also applies to systems that Gaia catalogues as a single unresolved source.
Reading between the lines
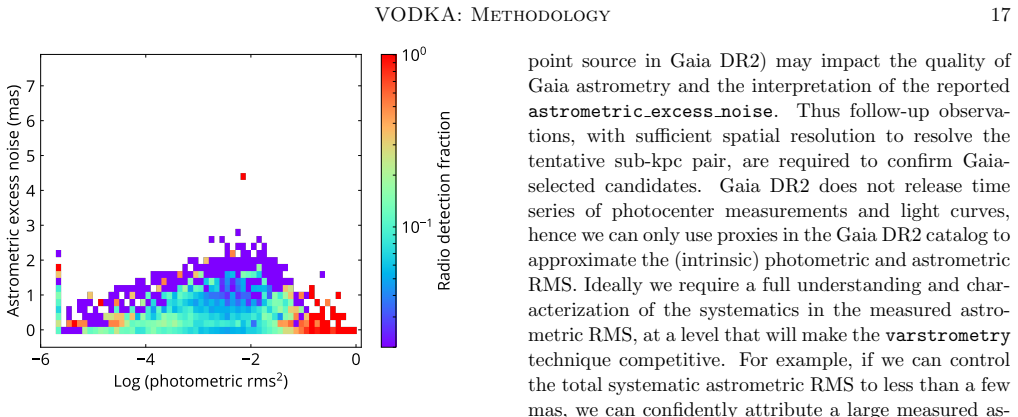
- If the roughly 1 mas excess-noise floor is partly instrumental, the inferred candidate fraction at $z>0.5$ should be read as an upper bound; matching a random subset against HST or VLBI imaging would calibrate the false-positive rate.
- The photocenter-flux correlation predicted by Eq. (4) can be tested with Gaia's future epoch data alone, and it would separate true varstrometry from host-morphology systematics without follow-up imaging.
- For small-separation lensed quasars, the time delay between images should produce the same jitter, so known lens systems could provide an independent validation and a way to measure image separations below Gaia's resolution.
- Because the jitter formula applies to any unresolved variable binary, the method could also serve as a Galactic surveyor for pre-main-sequence binaries and triple systems, not only for extragalactic AGN.
Signed reviews
Editorial analysis
A structured set of objections, weighed in public.
Referee Report
Summary. This paper introduces 'varstrometry,' a method to identify unresolved sub-kpc dual or off-nucleus AGN by detecting variability-induced astrometric jitter of the photocenter. The authors derive analytic scaling relations (Eqs. 1-5) between pair separation, flux ratio, photometric variability, and expected astrometric RMS; illustrate the signal with simulations; then test the idea on 13 pre-main-sequence binaries in Taurus-Auriga using Gaia DR2 astrometric excess noise (AEN) as a proxy for the intrinsic jitter. They characterize the impact of extended host galaxies on Gaia DR2 astrometry and photometry, present candidate sub-kpc dual/off-nucleus AGN and lensed quasars from spectroscopically confirmed SDSS quasars and WISE-selected samples, and discuss follow-up strategies. The central claim is that Gaia DR2 AEN, combined with photometric variability, can systematically identify and constrain sub-kpc AGN pairs, with a specific example of SDSSJ000252.60-034345.1 given a projected separation of 81 mas (700 pc).
Significance. If the feasibility claim is established, varstrometry would open a new, all-sky observational window on the poorly constrained sub-kpc separation regime of supermassive-black-hole pairs, complementing direct imaging and VLBI. The analytic derivation in Eqs. (1)-(5) is simple, correct, and parameter-free within its stated assumptions, and the paper is commendably transparent about Gaia DR2's limitations, explicitly noting that AEN is an upper limit and that time series are not yet available. The extended-host systematics study (Section 3.2) and the follow-up strategy (Section 5.2) are useful contributions. However, the feasibility validation on pre-main-sequence binaries is not yet robust enough to support the quantitative candidate statistics and separation inferences presented in Section 4.3.
major comments (4)
- [Section 3.3, Fig. 6, Table 1] The validation of the AEN proxy is fragile. The 13-point correlation between expected and cataloged AEN is carried primarily by the two systems with the largest measured AEN: GG Tau (AEN 6.97 mas vs. expected 1.49 mas) and RX J0438.2+2023 (AEN 12.08 mas vs. expected 8.21 mas). A simple re-analysis of Table 1 gives a Spearman rank correlation of about 0.74 (p approximately 0.003), but after excluding these two systems the correlation drops to about 0.64 with p approximately 0.07, no longer significant at the 5% level. GG Tau is a known multiple system with a circumbinary disk, and RX J0438.2+2023 has a projected separation of 0.464 arcsec, near the paper's own 0.5 arcsec cutoff for PSF-deviation effects. The authors should report the correlation statistic with significance for the full sample and for the sample excluding these two objects, and should justify why GG Tau is not simply an outlier against the model.
- [Section 3.3] No uncertainties are provided for the measured AEN values in Fig. 6. The text explicitly states that astrometric_excess_noise_sig cannot be converted to an uncertainty estimate for astrometric_excess_noise, and the figure therefore has error bars on the predicted axis only. As a result, the claim that the cataloged AEN is 'broadly consistent' with the expected jitter is not quantitatively testable. The authors should provide an empirical uncertainty or noise floor for AEN, for example from a matched control sample of single non-variable stars, and use it to assess the significance of the observed scatter and of individual candidate AEN values in Section 4.3.
- [Sections 3.1 and 4.3] The AEN proxy is not independently calibrated for quasars. The extended-host systematics are measured for z<0.6 inactive galaxies (Fig. 5), and the argument that they are negligible for z>0.5 quasars is based on the absence of a high-AEN tail in Fig. 9 rather than on a control sample of point-like sources with expected negligible varstrometric signal. The specific inferences in Section 4.3 — that 6% of about 37,000 z=0.5-1.5 quasars with AEN>1 mas are candidates, and that SDSSJ000252.60-034345.1 has a projected separation of 81 mas (700 pc) — assume that AEN is dominated by varstrometric jitter. The authors should either validate this assumption with a matched control sample (e.g., non-variable point sources or radio-loud quasars with expected low jitter) or explicitly present these numbers as order-of-magnitude illustrations with a systematic floor.
- [Section 3.3 and Eq. (3)] The prediction for the expected astrometric noise in the PMS test uses the Gaia DR2 photometric fractional variability f_G, measured from the same unresolved windows and the same 22-month baseline that also produce the astrometric excess noise. Shared window contamination and scanning-law systematics could therefore inflate the apparent correlation in Fig. 6. The paper acknowledges covariance between photometric and astrometric RMS for the quasar distribution (Fig. 9 caption) but not for the PMS validation. To strengthen the test, the expected AEN should be recomputed using independent photometric variability measurements from the literature light curves, or the covariance contribution should be estimated and subtracted.
minor comments (6)
- [Throughout] The symbol '&' appears in place of '≥' or '≳' in several places (e.g., '& 1 kpc', '& mas', '& 2 mas'); please correct these rendering errors.
- [Title and Abstract] The word 'off-nucleus' appears with a typographic ligature as 'off-nucleus'; please use a standard spelling.
- [Table 2] Several entries in Table 2 report 'nan' for parallax over error; please clarify whether these are missing values or undefined measurements, and how the reader should interpret them.
- [Fig. 6] The right-hand panel shows AEN versus separation but does not include error bars on the predicted axis; adding error bars and a correlation statistic would make the panel more informative.
- [Section 4.2] The statement that category (1) is 'a clean quasar sample' is stronger than the presented evidence supports, since 3 of the 9 objects have astrometric excess noise > 1 mas and may be of interest for varstrometry; please rephrase to allow for this.
- [References] The citation to 'Shen et al. 2019' appears as 'in prep' with placeholder arXiv number (arXiv:xxxx.xxxx); please provide a complete reference or remove the placeholder.
Circularity Check
No significant circularity: the varstrometry formalism is derived from the flux-weighted photocenter definition, and the feasibility check compares an unfitted prediction with Gaia DR2 astrometric excess noise.
full rationale
The derivation chain is self-contained. Equations (1)-(5) follow algebraically from the definition of the photocenter as the center of flux of an unresolved pair, with no fitted parameters and no use of the target result as an input. The feasibility demonstration in Section 3.3 computes an expected astrometric jitter from Equation (3) using literature separations and flux ratios plus Gaia DR2 photometric RMS, and compares it with the cataloged astrometric excess noise, an externally measured quantity. No parameter is fitted to the astrometric excess noise to produce the prediction; the comparison is a genuine, if approximate, external benchmark. The paper's self-citations (Shen 2012, Liu 2015, and the companion Shen et al. 2019) motivate the idea and describe follow-up population constraints, but they are not load-bearing for the equations or the DR2 validation: the formalism is re-derived here and the PMS test uses independent literature data. The quasar candidate selections in Sections 4.2-4.4 are explicitly presented as provisional candidates or upper limits, with the paper acknowledging that astrometric excess noise may be contaminated by extended hosts, faint companions, or systematics; this is a caveat about interpretation, not a circular reduction of the prediction to its inputs. The fragility of the Fig. 6 validation noted by skeptics concerns statistical robustness and possible duplicity systematics, but does not amount to the predicted quantity being defined in terms of the measured quantity. No circular step meeting the required standard of exhibiting a specific reduction is present.
Assumptions & free parameters
assumptions (5)
- domain assumption AGN vary stochastically with typical RMS amplitudes of about 0.1-0.2 mag on days-to-years timescales.
- domain assumption The two AGN components are spatially fixed over the Gaia DR2 observing baseline (2014-2016), so photocenter motion is due to flux variability, not orbital motion.
- domain assumption Astrometric excess noise from Gaia DR2 provides an upper limit on the intrinsic astrometric RMS of the photocenter.
- standard math Taylor expansion to leading order in fractional flux variation, with statistically independent variability between the two components.
- domain assumption Gaia DR2 photometric errors follow phot_g_mean_flux_error = sigma_G / sqrt(n_obs), so sigma_G reflects intrinsic variability after subtracting instrumental noise.
Cite this review
Pith. "Pith review of Varstrometry for Off-nucleus and Dual sub-Kpc AGN (VODKA): Methodology and Initial Results with Gaia DR2." pith.science (2026). https://pith.science/paper/FF3RP4XT
@misc{pith2026190802292,
  author       = {Pith},
  title        = {Pith review of: Varstrometry for Off-nucleus and Dual sub-Kpc AGN (VODKA): Methodology and Initial Results with Gaia DR2},
  year         = {2026},
  howpublished = {\url{https://pith.science/paper/FF3RP4XT}},
  note         = {Machine review of arXiv:1908.02292}
}
abstract
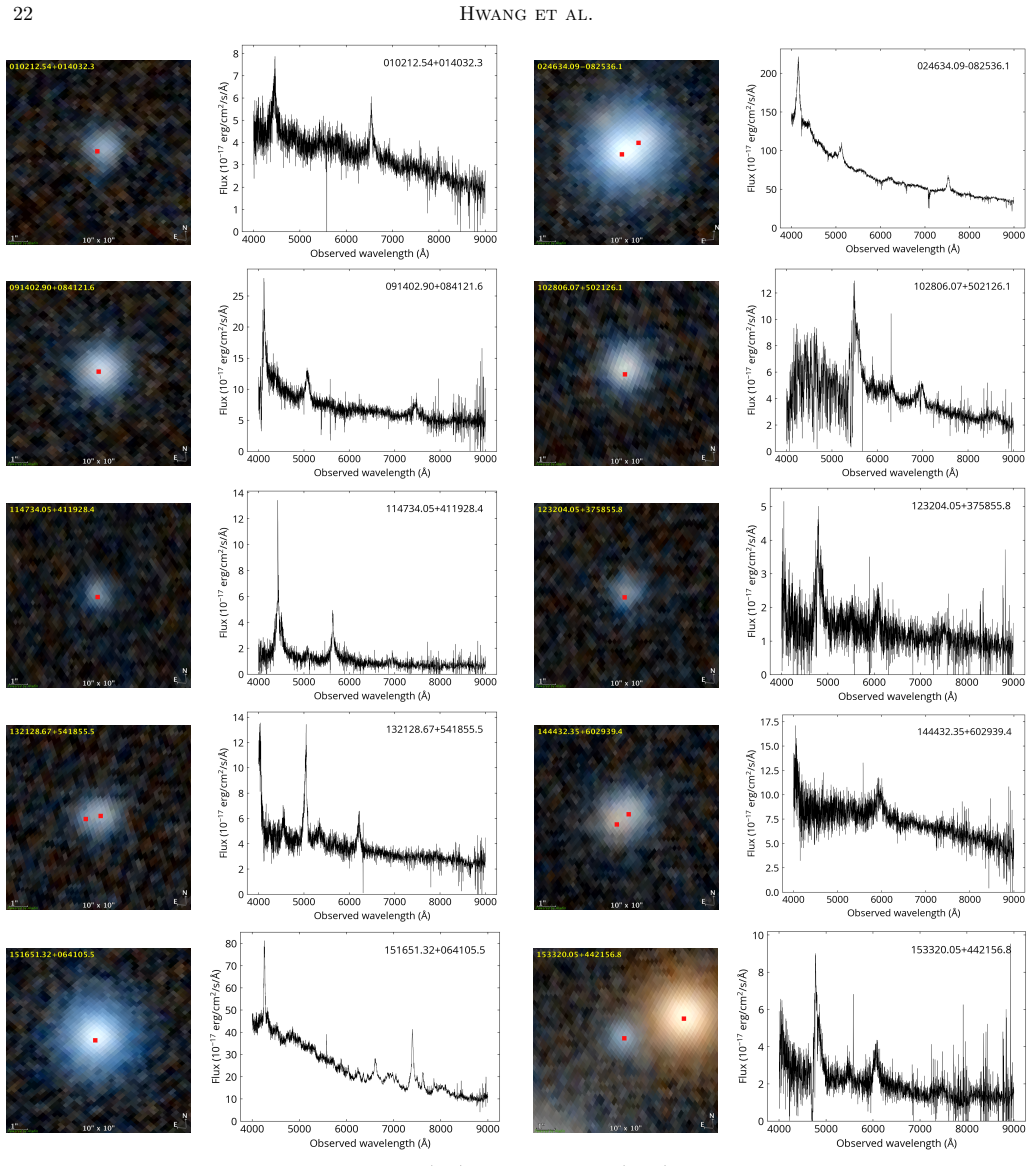
Gaia's milli-arcsec (mas) astrometric precision allows systematic identification of optically-selected sub-kpc dual active galactic nuclei (AGN), off-nucleus AGN, and small-scale lensed quasars by `varstrometry' -- where variability-induced astrometric jitter, i.e., temporal displacements of photocenter in unresolved sources, can be reasonably well detected or constrained. This approach extends systematic searches for small-scale ($\gtrsim$ mas) dual and off-nucleus AGN to poorly explored regime between $\sim 10$ pc and $\sim 1$ kpc, with Gaia's full sky coverage and depth to $G\sim 21$. We outline the general principles of this method and calculate the expected astrometric signals from the full time series of photocenter measurements and light curves. We demonstrate the feasibility of varstrometry by using Gaia DR2 data on a sample of variable pre-main sequence stars with known close companions. We find that extended host galaxies have a significant impact on the accuracy of astrometric and photometric variability in Gaia DR2, a situation to be improved in future Gaia releases. Using spectroscopically confirmed SDSS quasars, we present several examples of candidate sub-kpc off-nucleus or dual AGN selected from Gaia DR2. We discuss the merits and limitations of this method and follow-up strategy for promising candidates. We highlight Gaia's potential of systematically discovering and characterizing the sub-kpc off-nucleus and dual AGN population in the entire optical sky.
Figures


Figures from the paper (13 more)






Reference graph
Works this paper leans on
-
[1]
2019, arXiv e-prints, arXiv:1905.12221
Aihara, H., AlSayyad, Y., Ando, M., et al. 2019, arXiv e-prints, arXiv:1905.12221
arXiv 2019
-
[2]
2018, A&A, 616, A17
Arenou, F., Luri, X., Babusiaux, C., et al. 2018, A&A, 616, A17
2018
-
[3]
1998, MNRAS, 301, 161
Bailey, J. 1998, MNRAS, 301, 161
1998
-
[4]
G., Centrella, J., Choi, D.-I., et al
Baker, J. G., Centrella, J., Choi, D.-I., et al. 2006, ApJL, 653, L93
work page 2006
-
[5]
A., Phillips, M
Baldwin, J. A., Phillips, M. M., & Terlevich, R. 1981, PASP, 93, 5
1981
-
[6]
Romani, R. W. 2017, ApJ, 843, 14
work page 2017
-
[7]
Barrows, R. S., Comerford, J. M., Greene, J. E., & Pooley, D. 2017, ApJ, 838, 129
work page 2017
-
[8]
Barth, A. J., Bentz, M. C., Greene, J. E., & Ho, L. C. 2008, ApJL, 683, L119
work page 2008
Show all 82 references
-
[9]
H., White, R
Becker, R. H., White, R. L., & Helfand, D. J. 1995, ApJ, 450, 559
1995
-
[10]
C., Blandford, R
Begelman, M. C., Blandford, R. D., & Rees, M. J. 1980, Nature, 287, 307
1980
-
[11]
J., et al
Belokurov, V., Erkal, D., Deason, A. J., et al. 2017, MNRAS, 466, 4711
2017
-
[12]
A., & Evans, N
Belokurov, V. A., & Evans, N. W. 2002, MNRAS, 331, 649
2002
-
[13]
H., & Socrates, A
Blaes, O., Lee, M. H., & Socrates, A. 2002, ApJ, 578, 775
2002
-
[14]
D., & Narayan, R
Blandford, R. D., & Narayan, R. 1992, ARA&A, 30, 311
1992
-
[15]
Z., et al
Blecha, L., Sijacki, D., Kelley, L. Z., et al. 2016, MNRAS, 456, 961 Bogdanovi´ c, T. 2015, Astrophysics and Space Science Proceedings, 40, 103 Bogdanovi´ c, T., Reynolds, C. S., & Miller, M. C. 2007, ApJL, 661, L147
2016
-
[16]
2011, MNRAS, 410, 2113
Burke-Spolaor, S. 2011, MNRAS, 410, 2113
2011
-
[17]
G., Kelly, B
Centrella, J., Baker, J. G., Kelly, B. J., & van Meter, J. R. 2010, Reviews of Modern Physics, 82, 3069
2010
-
[18]
C., Magnier, E
Chambers, K. C., Magnier, E. A., Metcalfe, N., et al. 2016, arXiv e-prints, arXiv:1612.05560
2016 arXiv
-
[19]
2010, ApJ, 717, 209 —
Civano, F., Elvis, M., Lanzuisi, G., et al. 2010, ApJ, 717, 209 —. 2012, ApJ, 752, 49
2010
-
[20]
J., Strauss, M
Collinge, M. J., Strauss, M. A., Hall, P. B., et al. 2005, AJ, 129, 2542
2005
-
[21]
2011, Advanced Science Letters, 4, 181
Colpi, M., & Dotti, M. 2011, Advanced Science Letters, 4, 181
2011
-
[22]
M., & Greene, J
Comerford, J. M., & Greene, J. E. 2014, ApJ, 789, 112
2014
-
[23]
M., Pooley, D., Barrows, R
Comerford, J. M., Pooley, D., Barrows, R. S., et al. 2015, ApJ, 806, 219
2015
-
[24]
T., Neilsen, E., Gruendl, R., et al
Diehl, H. T., Neilsen, E., Gruendl, R., et al. 2016, in Proc. SPIE, Vol. 9910, Observatory Operations:
2016
-
[25]
2017, ApJ, 840, 31
Dosopoulou, F., & Antonini, F. 2017, ApJ, 840, 31
2017
-
[26]
2012, Advances in Astronomy, 2012, arXiv:1111.0664
Dotti, M., Sesana, A., & Decarli, R. 2012, Advances in Astronomy, 2012, arXiv:1111.0664
2012 arXiv
-
[27]
2018, ArXiv e-prints 1805.07359, arXiv:1805.07359
Ducourant, C., Wertz, O., Krone-Martins, A., et al. 2018, ArXiv e-prints 1805.07359, arXiv:1805.07359
2018 arXiv
-
[28]
Eracleous, M., & Halpern, J. P. 1994, ApJS, 90, 1
1994
-
[29]
W., Riello, M., De Angeli, F., et al
Evans, D. W., Riello, M., De Angeli, F., et al. 2018, A&A, 616, A4 Event Horizon Telescope Collaboration, Akiyama, K.,
2018
-
[30]
2019, ApJ, 875, L2
Alberdi, A., et al. 2019, ApJ, 875, L2
2019
-
[31]
D., et al
Fu, H., Yan, L., Myers, A. D., et al. 2012, ApJ, 745, 67 Gaia Collaboration, Prusti, T., de Bruijne, J. H. J., et al. 2016, A&A, 595, doi:10.1051/0004-6361/201629272 Gaia Collaboration, Brown, A. G. A., Vallenari, A., et al. 2018a, A&A, 616, A1 Gaia Collaboration, Mignard, F.,...
2012 doi
-
[32]
M., Neugebauer, G., & Matthews, K
Ghez, A. M., Neugebauer, G., & Matthews, K. 1993, AJ, 106, 2005
1993
-
[33]
M., White, R
Ghez, A. M., White, R. J., & Simon, M. 1997, ApJ, 490, 353
1997
-
[34]
2000, ApJL, 532, L29
Gould, A., & Rix, H.-W. 2000, ApJL, 532, L29
2000
-
[35]
D., Pardo, K., Greene, J
Goulding, A. D., Pardo, K., Greene, J. E., et al. 2019, arXiv e-prints, arXiv:1907.03757 Gravity Collaboration, Sturm, E., Dexter, J., et al. 2018, Nature, 563, 657
2019 arXiv
-
[36]
Haehnelt, M. G. 1994, MNRAS, 269, 199
1994
-
[37]
2000, Physical Review Letters, 85, 1158
Hu, W., Barkana, R., & Gruzinov, A. 2000, Physical Review Letters, 85, 1158
2000
-
[38]
Hughes, S. A. 2009, ARA&A, 47, 107
2009
-
[39]
P., Tremaine, S., & Witten, E
Hui, L., Ostriker, J. P., Tremaine, S., & Witten, E. 2017, PhRvD, 95, 043541 Jaffe, A. H., & Backer, D. C. 2003, ApJ, 583, 616 Kauffmann, G., Heckman, T. M., Tremonti, C., et al. 2003, MNRAS, 346, 1055
2017
-
[40]
Z., Blecha, L., & Hernquist, L
Kelley, L. Z., Blecha, L., & Hernquist, L. 2017, MNRAS, 464, 3131
2017
-
[41]
Kelly, B. C. 2007, ApJ, 665, 1489 20 Hwang et al
2007
-
[42]
J., Dopita, M
Kewley, L. J., Dopita, M. A., Sutherland, R. S., Heisler, C. A., & Trevena, J. 2001, ApJ, 556, 121
2001
-
[43]
M., Holley-Bockelmann, K., Berczik, P., & Just, A
Khan, F. M., Holley-Bockelmann, K., Berczik, P., & Just, A. 2013, ApJ, 773, 100
2013
-
[44]
1998, A&A, 331, 977
Kohler, R., & Leinert, C. 1998, A&A, 331, 977
1998
-
[45]
2003, ApJL, 582, L15
Komossa, S., Burwitz, V., Hasinger, G., et al. 2003, ApJL, 582, L15
2003
-
[46]
J., Shaya, E
Kristian, J., Groth, E. J., Shaya, E. J., et al. 1993, AJ, 106, 1330
1993
-
[47]
1993, A&A, 278, 129
Leinert, C., Zinnecker, H., Weitzel, N., et al. 1993, A&A, 278, 129
1993
-
[48]
Koposov, S. E. 2017, MNRAS, 472, 5023
2017
-
[49]
1978, in IAU Colloq
Lindegren, L. 1978, in IAU Colloq. 48: Modern Astrometry, ed. F. V. Prochazka & R. H. Tucker, 197–217
1978
-
[50]
2012, A&A, 538, A78
Lindegren, L., Lammers, U., Hobbs, D., et al. 2012, A&A, 538, A78
2012
-
[51]
2018, A&A, 616, A2
Lindegren, L., Hern´ andez, J., Bombrun, A., et al. 2018, A&A, 616, A2
2018
-
[52]
E., Shen, Y., & Strauss, M
Liu, X., Greene, J. E., Shen, Y., & Strauss, M. A. 2010, ApJL, 715, L30
2010
-
[53]
E., & Strauss, M
Liu, X., Guo, H., Shen, Y., Greene, J. E., & Strauss, M. A. 2018, ApJ, 862, 29
2018
-
[54]
2015, A&A, 580, A133 —
Liu, Y. 2015, A&A, 580, A133 —. 2016, A&A, 592, L4
2015
-
[55]
L., Ivezi´ c,ˇZ., Sesar, B., et al
MacLeod, C. L., Ivezi´ c,ˇZ., Sesar, B., et al. 2012, ApJ, 753, 106
2012
-
[56]
1988, Nature, 334, 325
Kayser, R. 1988, Nature, 334, 325
1988
-
[57]
V., & Goldin, A
Makarov, V. V., & Goldin, A. 2016, ApJS, 224, 19
2016
-
[58]
J., et al
Mateos, S., Alonso-Herrero, A., Carrera, F. J., et al. 2012, MNRAS, 426, 3271
2012
-
[59]
2013, Dynamics and Evolution of Galactic
Merritt, D. 2013, Dynamics and Evolution of Galactic
2013
-
[60]
2001, ApJ, 563, 34 M¨ uller-S´ anchez, F., Comerford, J., Stern, D., & Harrison, F
Nuclei, Princeton Series in Astrophysics (Princeton University Press) Milosavljevi´ c, M., & Merritt, D. 2001, ApJ, 563, 34 M¨ uller-S´ anchez, F., Comerford, J., Stern, D., & Harrison, F. A. 2016, ApJ, 830, 50
2001
-
[61]
2012, ApJ, 745, 119 Pˆ aris, I., Petitjean, P., Aubourg,´E., et al
Jayawardhana, R. 2012, ApJ, 745, 119 Pˆ aris, I., Petitjean, P., Aubourg,´E., et al. 2018, A&A, 613, A51
2012
-
[62]
B., Zavala, R
Rodriguez, C., Taylor, G. B., Zavala, R. T., et al. 2006, ApJ, 646, 49
2006
-
[63]
J., Dudik, R
Secrest, N. J., Dudik, R. P., Dorland, B. N., et al. 2015, ApJS, 221, 12
2015
-
[64]
H., et al
Sesar, B., Ivezi´ c,ˇZ., Lupton, R. H., et al. 2007, AJ, 134, 2236
2007
-
[65]
C., Zakamska, N., & Liu, X
Shen, Y., Hwang, H. C., Zakamska, N., & Liu, X. 2019, ApJ, submitted, arXiv:xxxx.xxxx
2019
-
[66]
M., Leinert, C., et al
Simon, M., Ghez, A. M., Leinert, C., et al. 1995, ApJ, 443, 625
1995
-
[67]
K., Dolag, K., Comerford, J
Steinborn, L. K., Dolag, K., Comerford, J. M., et al. 2016, MNRAS, 458, 1013
2016
-
[68]
F., & Pott, J.-U
Stern, J., Hennawi, J. F., & Pott, J.-U. 2015, ApJ, 804, 57
2015
-
[69]
V., Strauss, M
Strateva, I. V., Strauss, M. A., Hao, L., et al. 2003, AJ, 126, 1720
2003
-
[70]
2013, MNRAS, 431, 1383
Thomas, D., Steele, O., Maraston, C., et al. 2013, MNRAS, 431, 1383
2013
-
[71]
R., & Pontzen, A
Tremmel, M., Governato, F., Volonteri, M., Quinn, T. R., & Pontzen, A. 2018, MNRAS, 475, 4967
2018
-
[72]
2018, Frontiers in Astronomy and Space Sciences, 5, 11 Vanden Berk, D
Vallenari, A. 2018, Frontiers in Astronomy and Space Sciences, 5, 11 Vanden Berk, D. E., Wilhite, B. C., Kron, R. G., et al. 2004, ApJ, 601, 692
2018
-
[73]
2016, IAU Focus Meeting, 29, 285
Volonteri, M., Bogdanovi´ c, T., Dotti, M., & Colpi, M. 2016, IAU Focus Meeting, 29, 285
2016
-
[74]
2003, ApJ, 582, 559
Volonteri, M., Haardt, F., & Madau, P. 2003, ApJ, 582, 559
2003
-
[75]
J., Latham, D., Angel, J
Weymann, R. J., Latham, D., Angel, J. R. P., et al. 1980, Nature, 285, 641
1980
-
[76]
L., Becker, R
White, R. L., Becker, R. H., Helfand, D. J., & Gregg, M. D. 1997, ApJ, 475, 479
1997
-
[77]
1996, A&A, 314, 679
Wielen, R. 1996, A&A, 314, 679
1996
-
[78]
L., Eisenhardt, P
Wright, E. L., Eisenhardt, P. R. M., Mainzer, A. K., et al. 2010, AJ, 140, 1868
2010
-
[79]
1981, ApJ, 244, 723
Kristian, J. 1981, ApJ, 244, 723
1981
-
[80]
2011, ApJ, 738, 92
Yu, Q., Lu, Y., Mohayaee, R., & Colin, J. 2011, ApJ, 738, 92
2011
-
[81]
A., & Zakamska, N
Yuan, S., Strauss, M. A., & Zakamska, N. L. 2016, MNRAS, 462, 1603
2016
-
[82]
L., & Greene, J
Zakamska, N. L., & Greene, J. E. 2014, MNRAS, 442, 784 VODKA: Methodology 21 T able 2. List of genuine quasars that have significant non-zero parallaxes from Gaia DR2. Positions are also from Gaia DR2 and have precisions of∼ 0.04 mas. Some SDSS quasars have two Gaia matches wit...
2014
Reviewed August 14, 2026 · model on record in the stance chip above.
Discussion (0). Continue with ORCID to comment.