REVIEW 5 major objections 4 minor 14 references
Estimating the resilience to natural disasters by using call detail records to analyse the mobility of internally displaced persons
T0 review · 5 major / 4 minor · reviewed 2026-08-14 · deepseek-v4-flash
Pith's one-line read Displaced people after three disasters resettle as a two-exponential decay, with half resettled in four to five weeks.
desk verdict Useful applied paper with a new per-person resettlement metric, but the pre-disaster validation exposes a false-positive artifact that likely contaminates the two-exponential decay claim. read the letter →
The pith
A machine-rendered reading of the paper's core claim, the machinery that carries it, and where it could break.
The reading
What carries the argument
The central object is the two-exponential decay curve fitted to the weekly fraction of IDPs who have not yet resettled. It is computed from a mobility threshold: an individual is considered resettled in the first week after the disaster when their four-week rolling mean of a mobility metric (radius of gyration, logarithmic radius of gyration, temporal-uncorrelated entropy, or step entropy) drops to or below the pre-disaster average. The step-entropy metric is used for the main results because it is consistent with the stay-location method used to detect IDPs, sits between the other metrics, and responds to travel frequency and short-distance moves.
What would settle it
Compare CDR-derived resettlement dates against field-survey data for a known disaster cohort: if substantial numbers of people still living in camps or temporary shelters are classified as resettled by the mobility threshold, the proxy and the two-exponential decay claim would be falsified.
Extended reading notes
Core claim
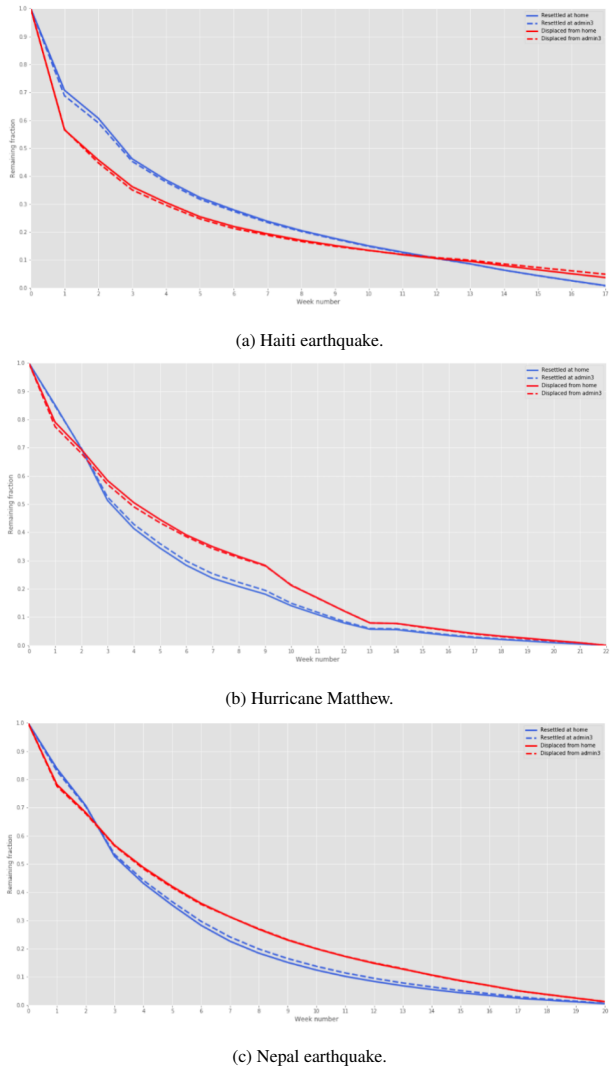
The paper claims that the resettlement rate of a disrupted population can be modelled very well by f(t) = α1 exp(−β1t) + α2 exp(−β2t), where t is weeks after the disaster and the two exponentials represent a faster-recovering group and a slower-recovering group. Applying four mobility metrics to call detail records from three disasters, the authors define an individual's resettlement date as the first post-disaster week in which the four-week rolling mean of the mobility metric falls to or below its pre-disaster mean. The resulting decay curves for the IDP group are clearly distinct from a control group, and for all three disasters half of the displaced persons are resettled within four to five weeks. The paper also argues that radius of gyration is less suitable because disaster disruption often appears as a decrease in long-distance travel and an increase in short-distance travel, which RoG can misread as recovery.
Load-bearing premise
The load-bearing premise is that an individual has resettled exactly when their four-week rolling average mobility metric first falls to or below its pre-disaster average, an operational proxy that the paper cannot validate against ground-truth resettlement records.
Editorial extensions
If this is right
- If the two-exponential shape is universal, the number of IDPs still displaced at any time can be estimated from an initial displacement count alone, without knowing resettlement locations.
- The fitted parameters give a quantitative, comparable measure of disaster resilience across events and across administrative regions, highlighting which areas recover slowest.
- Mobility-based monitoring can complement field surveys with near-real-time, interview-free estimates, and can capture displaced people who avoid official camps.
- The metric comparison warns that relying on radius of gyration alone underestimates the population still needing support because it misses increased short-distance travel frequency.
- The method provides a way to compare return-to-home versus resettle-elsewhere rates, suggesting that recovery of mobility and finding a new home take roughly similar times.
Reading between the lines
- Because the two-exponential fit collapses many individual trajectories into two rates, a natural next test is whether the fast and slow groups correspond to observable factors such as home damage severity, socioeconomic status, or whether people returned home versus resettled elsewhere.
- The same rolling-mean threshold could be applied to other sudden disruptions — disease outbreaks, conflict displacement, or climate evacuations — to test whether a universal recovery curve exists, though the paper does not claim this.
- A sharper validation would re-derive resettlement dates with different window lengths and a sustained-below-baseline criterion; if the two-exponential shape and the four-to-five-week half-life persist, the conclusion is much stronger.
- The control group likely contains some true IDPs, so the reported IDP–control contrast is conservative; a cleaner unaffected-region control would probably show an even larger separation.
Signed reviews
Editorial analysis
A structured set of objections, weighed in public.
Referee Report
Summary. The paper develops a method to estimate individual resettlement times after sudden-onset disasters using mobile phone call detail records. It defines resettlement as the first week after the disaster in which the four-week rolling mean of a mobility metric falls to or below the individual's pre-disaster mean, and applies this definition to three disasters (Haiti 2010, Nepal 2015, Hurricane Matthew in Haiti 2016) using four mobility metrics. The central claim is that the fraction of IDPs remaining disrupted decays as a sum of two exponentials, f(t) = α1 exp(−β1 t) + α2 exp(−β2 t), and that the decay rates are similar across disasters, with half of the displaced resettled within four to five weeks. The paper also compares the performance of the four metrics, argues that radius of gyration is unsuitable, and includes a control group and a pre-disaster self-validation as checks. The authors explicitly acknowledge the lack of ground-truth validation and several other limitations.
Significance. If the reported two-exponential decay law and cross-disaster similarity are real, the paper would make a valuable contribution to disaster-resilience measurement, potentially enabling near-real-time estimates of IDP numbers from CDR data. The use of actual operator data for three substantial disasters, the inclusion of a control group, and the attempt at internal validation are strengths; the paper also makes falsifiable predictions (parameter values and half-times). However, the significance is currently conditional: the pre-disaster self-validation in Appendix A shows that the resettlement estimator labels large fractions of the population as 'resettled' even in the absence of a disaster, which threatens the interpretation of the post-disaster decay curves. The lack of ground-truth validation, the absence of goodness-of-fit statistics, and the post hoc selection of the step-entropy metric further weaken the central claim.
major comments (5)
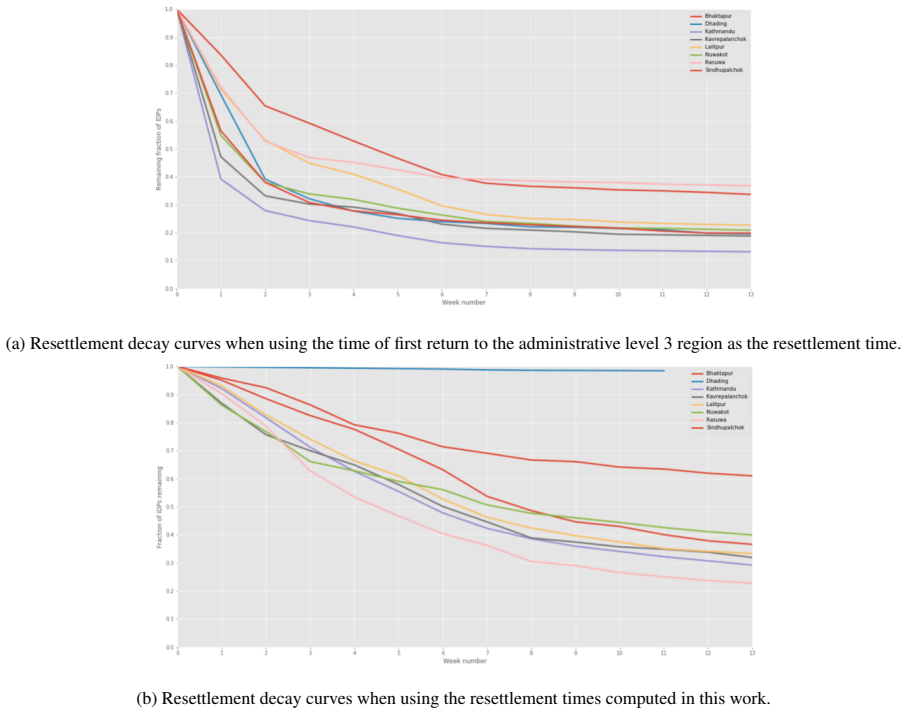
- [Section 2 and Appendix A, Figure 8] The pre-disaster validation curves in Figure 8 decay from essentially 100% to near zero for both the IDP and control groups during an undisrupted period. Since the resettlement date is defined as the first week the four-week rolling mean falls at or below the pre-disaster mean (Section 2, step 4), this decay demonstrates that stochastic fluctuations alone cause a large fraction of individuals to be classified as 'resettled' even with no disaster. The post-disaster decay curves used in all subsequent analysis are generated by the same first-passage rule, so the two-exponential fits in Section 3.2 are likely contaminated by this threshold-crossing artifact. The authors describe the pre-disaster recovery as 'expected' (Section 3.1) but do not quantify the false-positive rate or correct for it; without such a correction, the central claim that the decay curves measure resettlement dynamics is not supported.
- [Section 3.2, Table 3] The claim that the curves 'fit very well' to f(t) = α1 exp(−β1 t) + α2 exp(−β2 t) is not backed by any goodness-of-fit statistic (R², residuals, or model comparison). The reported 1σ parameter errors are not a substitute for a fit-quality measure. In addition, the assertion of 'similar' decay rates across disasters is based on visual inspection of Figure 3; no statistical test for the equivalence of the β parameters is provided, and Haiti's β1 = 0.63 is roughly three times larger than the other two (0.22), which weakens the abstract's summary claim.
- [Section 4.2.2] The decision to present only the step-entropy results after Section 3.1 is made after examining all four metrics, with one justification being that the step-entropy curve lies 'in the middle' of the others. This post hoc metric selection creates a risk of selection bias in the reported two-exponential parameters and half-times; the paper does not report the equivalent fits for the other metrics or apply a multiple-testing correction. To make the central result robust, the metric choice should be justified a priori or confirmed on held-out data.
- [Section 2 vs. Section 4.2.1] The method's key assumption is that 'disaster-induced disruption manifests as an increase only (not decrease) in the value of the mobility metric.' Section 4.2.1 then shows that for many IDPs disruption appears as a decrease in long-distance travel and an increase in short-distance travel, so that the radius-of-gyration metric can indicate recovery before true recovery. The paper acknowledges this for RoG but does not reconcile it with the original 'increase only' assumption for the remaining metrics. If other metrics are also sensitive to the mix of increases and decreases, the estimated resettlement dates are structurally biased.
- [Section 5] The paper acknowledges that no ground-truth validation has been performed and that individuals in camps or temporary accommodation may exhibit normal activity. This limitation, combined with the artifact documented in Appendix A, means that 'resettlement' as operationalized here is a proxy for the return of a mobility metric to its pre-disaster average, not an externally validated measure of resettlement. The central claim requires either an external validation or a redefined estimator whose pre-disaster false-positive rate is explicitly modeled and subtracted.
minor comments (4)
- [Section 2.1.1] The displayed formula for the radius of gyration is incomplete: the summand should be (r_i − r_c)^2, not (r_i − r_c); the text also says 'mean absolute deviation' after presenting a standard-deviation-like expression, which is inconsistent.
- [Figure 1] The solid/dotted line distinction between IDP and control groups in Figure 1 (and similar figures) is described only in the caption; labeling the lines directly or adding an in-figure legend would make the plots much easier to read.
- [Section 4.3.3] The sentence 'half of the displaced residents have resettled back at their home after four months' is imprecise because Table 4 reports 17 weeks for Haiti; please state the number of weeks as well as or instead of months.
- [Abstract] The abstract's statement that half of the displaced resettled within four to five weeks should be explicitly qualified as referring to the step-entropy metric, since Figure 1 shows that other metrics give different decay curves.
Circularity Check
No significant circularity: the paper's claims are empirical fits to an explicitly operational definition, not derivations from first principles, and the cited prior work is used as input rather than as proof.
full rationale
The paper defines resettlement operationally as the first post-disaster week in which the four-week rolling mean of a mobility metric falls to or below its pre-disaster baseline (Section 2, step 4). It then constructs decay curves from that definition and fits them to a sum of two exponentials (Section 3.2). This is a descriptive statistical summary of an explicitly defined quantity, not a derivation of that quantity from independent premises. The abstract's conditional statement about future disasters is explicitly speculative, not a claimed prediction. The only self-citation is the use of the authors' prior work [1] to identify IDPs; this is normal continuity and is not used to justify the central exponential-decay result. Appendix A's pre-disaster validation shows that the method also produces decay curves in undisturbed periods, which the authors acknowledge and interpret as baseline volatility; this raises a validity concern but does not make the argument circular. No equation or fitted parameter is shown to reduce to an input by construction, and no load-bearing conclusion is justified solely by a self-citation chain.
Assumptions & free parameters
free parameters (4)
- Four-week rolling mean window =
4 weeks
- Exponential fit coefficients for Haiti earthquake =
alpha1=0.43, alpha2=0.56, beta1=0.63, beta2=0.05
- Exponential fit coefficients for Hurricane Matthew =
alpha1=0.75, alpha2=0.26, beta1=0.22, beta2=0.03
- Exponential fit coefficients for Nepal earthquake =
alpha1=0.76, alpha2=0.24, beta1=0.22, beta2=0.03
assumptions (4)
- domain assumption The IDP identification method from the authors' prior work [1] correctly identifies internally displaced persons.
- domain assumption Disaster-induced disruption manifests as an increase, not a decrease, in the value of the mobility metric.
- domain assumption Return of a mobility metric to its pre-disaster level indicates that the individual has resettled.
- domain assumption The one-dimensional approximation of radius of gyration is adequate for detecting changes between pre- and post-disaster periods.
Cite this review
Pith. "Pith review of Estimating the resilience to natural disasters by using call detail records to analyse the mobility of internally displaced persons." pith.science (2026). https://pith.science/paper/LFEHBAVZ
@misc{pith2026190802381,
  author       = {Pith},
  title        = {Pith review of: Estimating the resilience to natural disasters by using call detail records to analyse the mobility of internally displaced persons},
  year         = {2026},
  howpublished = {\url{https://pith.science/paper/LFEHBAVZ}},
  note         = {Machine review of arXiv:1908.02381}
}
read the original abstract
We use mobile phone call detail records to estimate the resettlement times of a subset of individuals that have been previously identified to be internally displaced persons (IDPs) following a sudden-onset disaster. Four different mobility metrics - two versions of radius of gyration and two versions of entropy - are used to study the behaviour of populations during three disasters - the 2010 earthquake in Haiti, the 2015 Gorkha earthquake in Nepal, and Hurricane Matthew in Haiti in 2016. We characterise the rate at which a disrupted population resettles by the fraction of individuals who remain disrupted each week after the disaster. We find that this rate can be modelled very well as the sum of two exponential decays and observe that the resettling rate for all three disasters is similar, with half the original number of displaced persons having resettled within four to five weeks of the disaster. If the study of further disasters leads to the observation of similar exponential decay rates, then it would imply that the number of IDPs at any time can be inferred from an estimate of the initial number of IDPs immediately following the disaster. Alternatively, the method provides a way to monitor disaster resilience and compare recovery rates across disasters. The method has the advantage that no assumptions need to be made regarding the location or time of resettlement. Our results indicate that CDRs can significantly contribute to measuring and predicting displacement durations, distances, and locations of IDPs in post-disaster scenarios. We believe that information and estimates provided by specifically developed CDR analytics, coupled with field data collection and traditional survey methods, can assist the humanitarian response to natural disasters and the subsequent resettlement efforts.
Figures


Figures from the paper (9 more)




Reference graph
Works this paper leans on
-
[5]
Predictability of population displacement after the 2010 haiti earthquake
Xin Lu, Linus Bengtsson, and Petter Holme. Predictability of population displacement after the 2010 haiti earthquake. Proceedings of the National Academy of Sciences, 109(29):11576–11581, 2012
work page 2010
-
[6]
Robin Wilson, Elisabeth zu Erbach-Schoenberg, Maximilian Albert, Daniel Power, Simon Tudge, Miguel Gonzalez, Sam Guthrie, Heather Chamberlain, Christopher Brooks, Christopher Hughes, et al. Rapid and near 22 real-time assessments of population displacement using mobile phone data following disasters: the 2015 nepal earthquake. PLoS currents, 8, 2016
work page 2015
-
[1]
Tracey Li, Jesper Dejby, Maximilian Albert, Linus Bengtsson, and Véronique Lefebvre. Detecting individual internal displacements following a sudden-onset disaster using time series analysis of call detail records, 2019. http://doi.org/10.5281/zenodo.3349848
-
[2]
https://www.unhcr.org/uk/figures-at-a-glance.html
UNHCR website, 2019. https://www.unhcr.org/uk/figures-at-a-glance.html
work page 2019
-
[3]
Global protection cluster retreat - idps outside of camps, Feb 2012
UNHCR Yemen Erin Mooney. Global protection cluster retreat - idps outside of camps, Feb 2012. https://www.refworld.org/pdfid/4f4f42f92.pdf
work page 2012
-
[4]
Linus Bengtsson, Xin Lu, Anna Thorson, Richard Garfield, and Johan V on Schreeb. Improved response to disasters and outbreaks by tracking population movements with mobile phone network data: a post-earthquake geospatial study in haiti. PLoS medicine, 8(8):e1001083, 2011
work page 2011
-
[7]
GSM Association. The mobile economy 2017, 2017. https://tinyurl.com/y8txral8
work page 2017
-
[8]
A place-based model for understanding community resilience to natural disasters
Susan L Cutter, Lindsey Barnes, Melissa Berry, Christopher Burton, Elijah Evans, Eric Tate, and Jennifer Webb. A place-based model for understanding community resilience to natural disasters. Global environmental change, 18(4):598–606, 2008
work page 2008
Show all 14 references
-
[9]
Disaster resilience: an integrated approach
Douglas Paton and David Johnston. Disaster resilience: an integrated approach. Charles C Thomas Publisher, 2017
2017
-
[10]
Human mobility in advanced and developing economies: A comparative analysis
Alberto Rubio, Vanessa Frias-Martinez, Enrique Frias-Martinez, and Nuria Oliver. Human mobility in advanced and developing economies: A comparative analysis. In 2010 AAAI Spring Symposium Series, 2010
2010
-
[11]
Understanding individual human mobility patterns
Marta C Gonzalez, Cesar A Hidalgo, and Albert-Laszlo Barabasi. Understanding individual human mobility patterns. nature, 453(7196):779, 2008
2008
-
[12]
Limits of predictability in human mobility
Chaoming Song, Zehui Qu, Nicholas Blumm, and Albert-László Barabási. Limits of predictability in human mobility. Science, 327(5968):1018–1021, 2010
2010
-
[13]
Race, socioeconomic status, and return migration to new orleans after hurricane katrina
Elizabeth Fussell, Narayan Sastry, and Mark VanLandingham. Race, socioeconomic status, and return migration to new orleans after hurricane katrina. Population and environment, 31(1-3):20–42, 2010. A Pre-disaster decay curves As part of our verification that the method described...
2010
-
[14]
These scores indicate that the two groups are significantly different even during the stable pre-disaster period. It is likely that this is because a certain behavioural subset has been selected by the filters included in the IDP detection method [1]; for example, that an indivi...
Reviewed August 14, 2026 · model on record in the stance chip above.
Discussion (0). Continue with ORCID to comment.