REVIEW 3 major objections 4 minor 26 references
A modelling methodology for social interaction experiments
T0 review · 3 major / 4 minor · reviewed 2026-08-14 · deepseek-v4-flash
Pith's one-line read Pair-by-pair token exchanges show ingroup bias appears immediately, while reciprocity strengthens over rounds.
desk verdict The null-model regression is a useful addition to the social-interaction toolkit, and the ingroup-favouritism result is solid, but the 'reciprocity strengthens over time' claim is an artifact of cumulative outcomes. read the letter →
The pith
A machine-rendered reading of the paper's core claim, the machinery that carries it, and where it could break.
The reading
What carries the argument
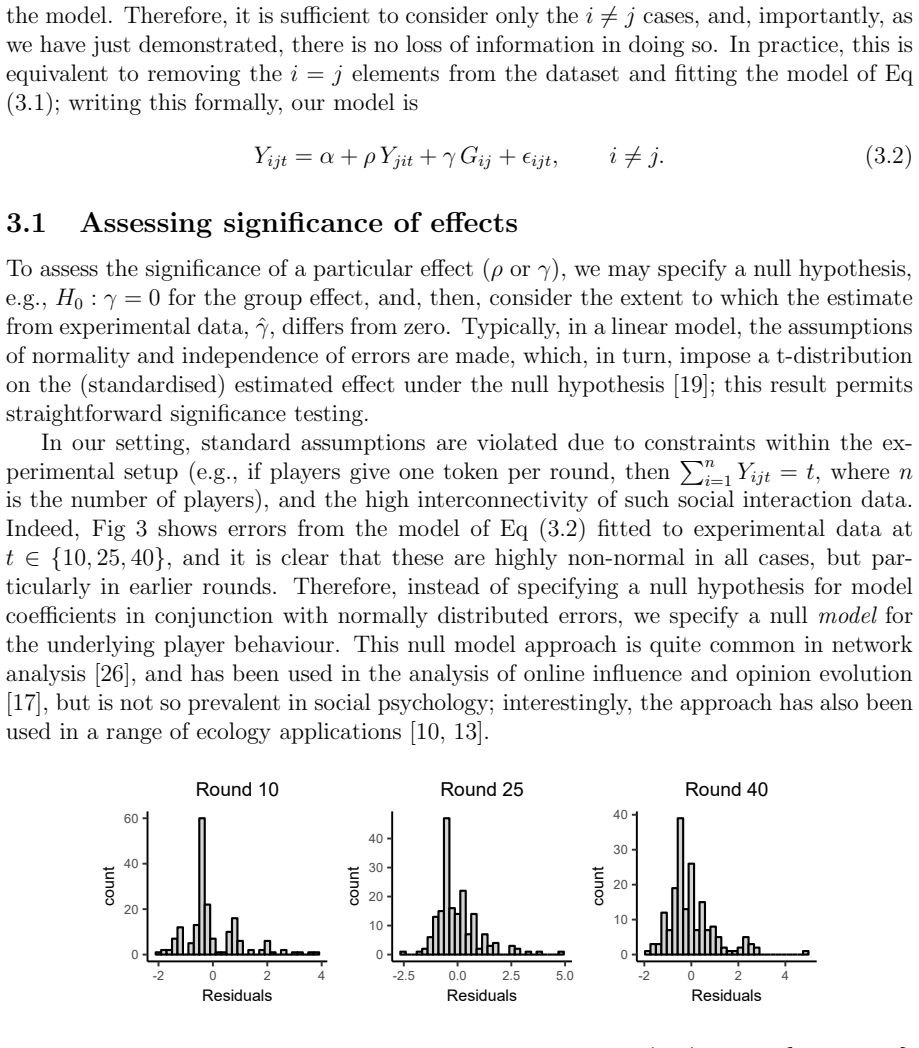
The central object is the pair-level cumulative-count regression $Y_{ijt} = \alpha + \rho Y_{jit} + \gamma G_{ij} + \varepsilon_{ijt}$ for $i \neq j$, where $Y_{ijt}$ is the number of tokens player $i$ has received from player $j$ up to round $t$, $Y_{jit}$ measures reciprocation, $G_{ij}$ indicates whether $i$ and $j$ are in different groups, and the error term is left unspecified. Because the errors are non-normal and interdependent, significance is assessed by an agent-based null model: simulate games where every player chooses a recipient uniformly at random, refit the regression 10,000 times, and compare the observed coefficients to the simulated null distribution. A companion influence metric replaces one player's actions with a random giver, refits the model, and measures the $\ell^1$ distance of the resulting coefficient trajectories to flag unusual participants.
What would settle it
Run the same four-game analysis with an alternative null model, for example one where each player chooses a recipient uniformly at random but with self-giving at the observed rate, or where giving is biased toward physically nearby nodes in the displayed network; if the observed reciprocity and group coefficients then fall inside the 95% simulation bands, the equal-probability null is what creates the significant effects.
Extended reading notes
Core claim
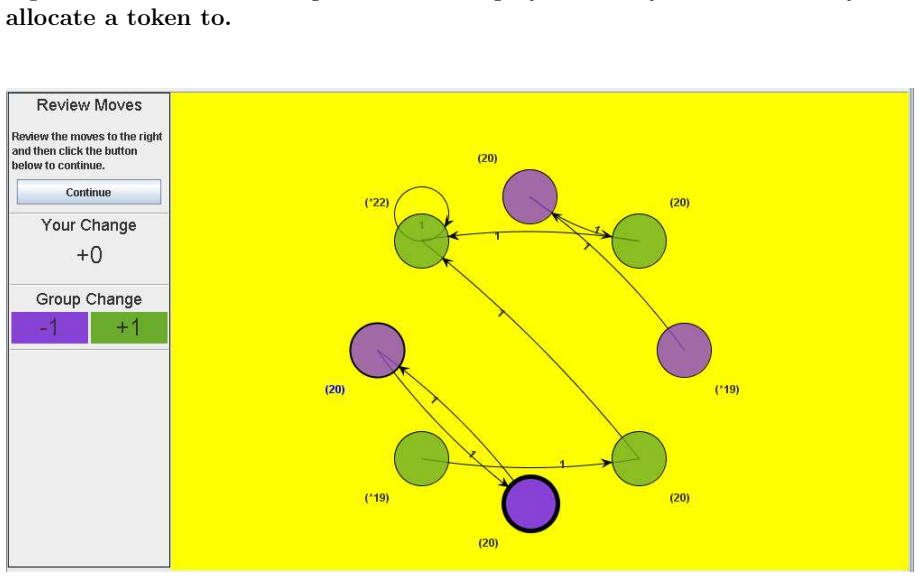
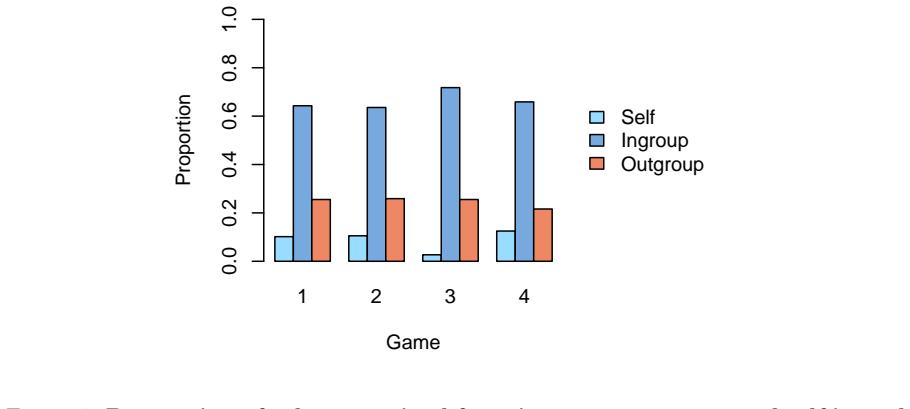
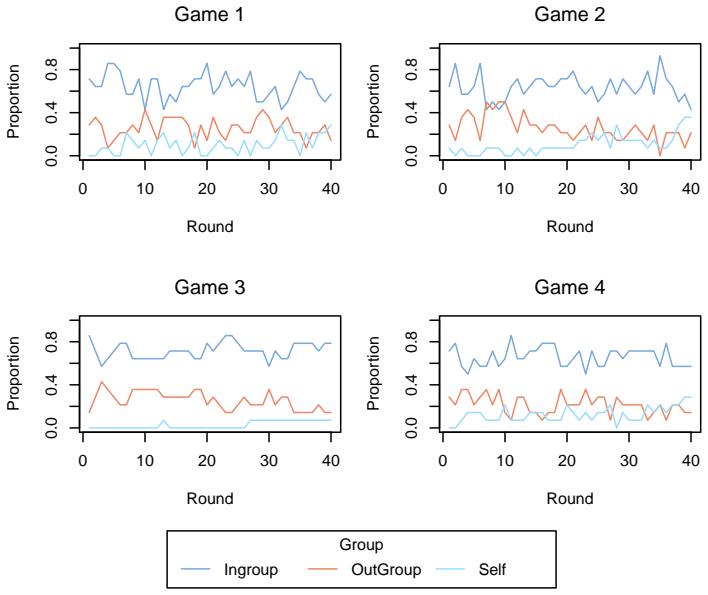
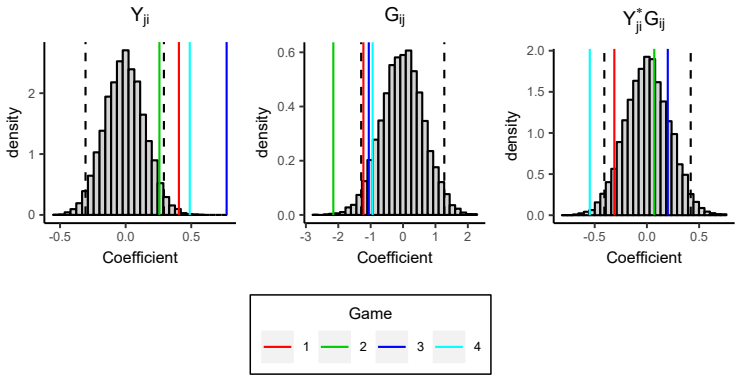
The paper's central claim is that individual-level token exchanges in the VIAPPL games reveal two distinct normative dynamics: ingroup favouritism is present and statistically significant from the very first rounds, while reciprocity starts weak and becomes stronger as players build relationships. Across three of the four games the estimated coefficients follow very similar trajectories, indicating a repeatable pattern; the fourth game is an outlier because two players from different groups exchanged tokens with each other in almost every round. The model-based influence metric, which replaces a player's actions with random giving and measures the resulting shift in coefficient paths, identifies exactly those two players as unusually influential, and removing their influence brings the game's results closer to the others.
Load-bearing premise
The results depend on the null model that, without reciprocity or group bias, every player would give their token to every other player with equal probability in every round; if players have other default preferences, those defaults would be counted as ingroup bias or reciprocity.
Editorial extensions
If this is right
- Ingroup favouritism is measurable at the individual-interaction level and is present from the start of the game, not only in aggregate.
- Reciprocity is a real but slower-forming norm; it becomes significant only after several rounds, suggesting reciprocal ties build on group context.
- The dynamics are repeatable across independent groups: three of the four games show very similar coefficient trajectories.
- Unusual players can be detected systematically by their influence on the coefficient estimates, rather than only by inspecting scatterplots.
- Because the method avoids independence and normality assumptions, it transfers to other rule-based interaction settings such as iterated prisoner's dilemma experiments.
Reading between the lines
- The equal-probability null is a strong assumption; testing the same model against a spatially biased or position-based null would show whether part of the estimated group effect is actually an artefact of node layout.
- The same influence metric could serve as a bot-detection tool on online social platforms, as the authors hint; a concrete check would be whether known bot accounts receive influence scores above the same threshold.
- The cumulative response variable hides recency; a rolling-window version of the response could test whether reciprocity strengthens within a game or simply accumulates mechanically.
- The null-model simulation could be inverted into a model-selection device: instead of testing only 'no effect', one could compare the observed data against several candidate behavioural rules and see which rule's simulated coefficient distribution best contains the observed coefficients.
Signed reviews
Editorial analysis
A structured set of objections, weighed in public.
Referee Report
Summary. The paper proposes a regression-based modelling framework for temporal network data arising from the VIAPPL social-interaction platform. The response variable is the cumulative number of tokens player i has received from player j up to round t, regressed on the cumulative number of tokens i has given to j and on a same-group indicator, after removing self-giving. Inference is based on comparing observed regression coefficients with coefficients fitted to many simulations from a null model in which every player gives one token per round uniformly at random. The method is applied to four 14-player games. The authors report that ingroup favouritism is present from early rounds, that reciprocity becomes stronger over time, that one game is dominated by two unusually reciprocal players, and they introduce an influence metric and network visualisation for identifying players whose behaviour departs from the norm.
Significance. The proposed framework is a reasonable and useful step for analysing individual-level interaction data in controlled experiments, where standard independence assumptions fail. The use of a parameter-free null model with 10,000 simulations is a strength, as is the explicit treatment of self-giving and the model-based influence metric. If the substantive conclusions were fully supported, the paper would provide a valuable methodology for VIAPPL and similar platforms. However, the central temporal claim about reciprocity is not supported by the cumulative-response model as presented, and the significance statements are not adjusted for the large number of tests performed. The group-favouritism result is more robust and is consistent across three of the four games.
major comments (3)
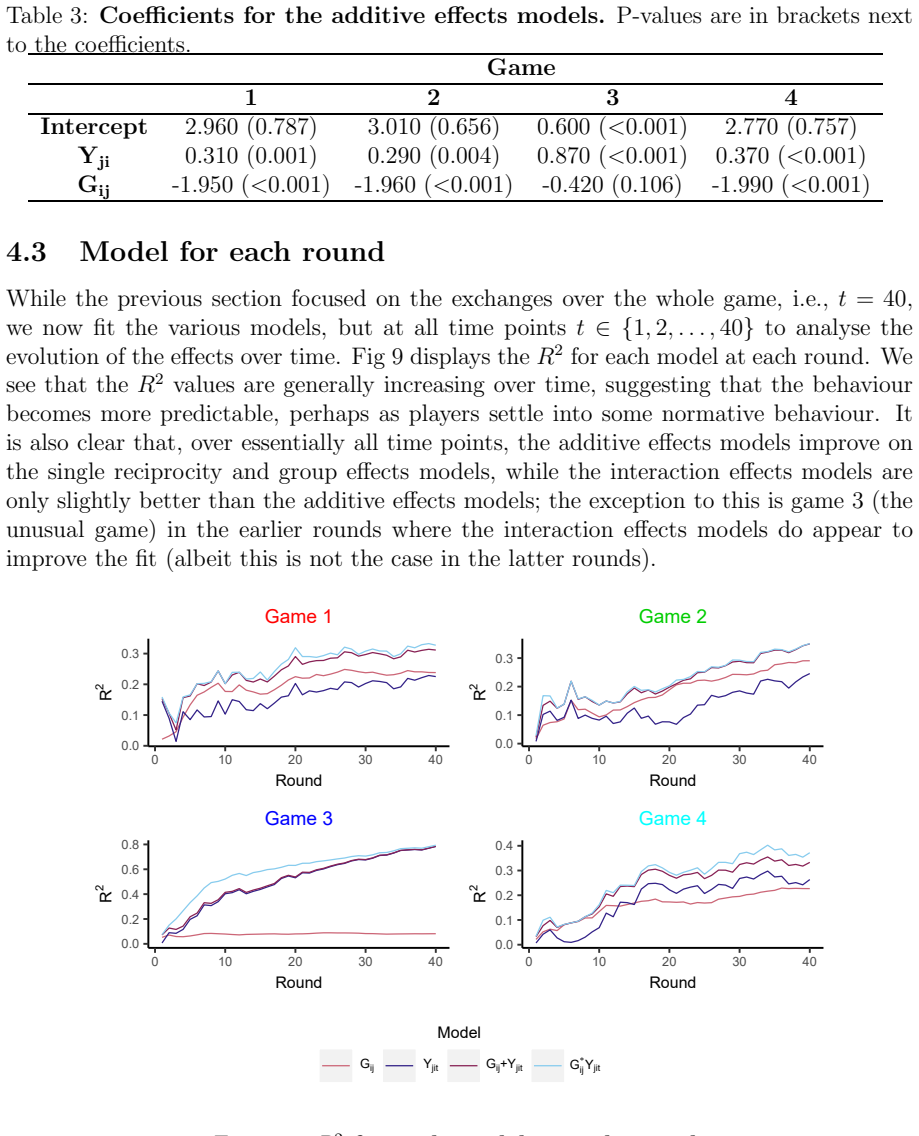
- [Section 4.3, Eq. (3.2), Fig. 10] The claim that reciprocity 'becomes more pronounced as the game progresses' is not supported by the reported analysis. In Eq. (3.2), both the response Y_ijt and the predictor Y_jit are cumulative counts up to the same round t. At small t these counts contain very little information and are mostly zero, so the early non-significance of rho_t is exactly what would be expected under a constant per-round reciprocity effect as information accumulates. Moreover, because both variables are contemporaneous cumulative counts, rho_t captures a symmetric association between how much i and j give to each other over the whole game, not a temporal response in which a prior gift raises the probability of a later gift. The authors should test the strengthening claim directly, for example by fitting a model to per-round or differenced data, or by using a lagged predictor such as Y_{ji,t-1}.
- [Sections 4.2 and 4.3, Table 3 and Fig. 10] No correction is made for multiple testing. The authors report significance of coefficients for four games, four models, two effect types, and up to forty rounds. The 95% bands in Fig. 10 are pointwise bands from the null simulations, and the p-values in Table 3 are unadjusted. Consequently, the statement that the group effect is 'significant at almost all rounds' and the comparison of early versus late reciprocity are familywise claims that could be driven by the large number of tests. The authors should either provide multiple-testing-corrected bands or clearly state that all conclusions are pointwise and assess robustness to the number of comparisons.
- [Section 3.1] The null model assumes that, in the absence of reciprocity and ingroup favouritism, every player chooses every other player with equal probability in every round. This is a strong behavioural assumption. If participants have other baseline preferences, such as a tendency to give to players in certain screen positions or to players with fewer tokens, those preferences would be absorbed into the estimated rho and gamma coefficients and could make the reciprocity or group effects appear significant. Because the null model is not fitted to the data, the p-values are conditional on this specific null. The authors should test alternative null models, for example one that preserves each player's observed marginal giving rates or one that includes positional choice probabilities, to confirm that the substantive conclusions are robust.
minor comments (4)
- [Section 4.4 and Discussion] The text says that when the two unusual players in game 3 were 'removed from the data' the results became more similar to the other games, but in Section 4.4 the players were not removed; they were replaced by simulated null players. The Discussion should use the more precise terminology of replacement rather than removal.
- [Figure 10 caption] The caption says the dotted line and shaded region are 'explained in the Game 3 section', but the figure appears before Section 4.4. Rephrase the caption or move the explanation so the figure is self-contained.
- [Section 4.5, Table 4] The threshold of 2 for flagging influential players is arbitrary, and the influence metric itself is not given a null distribution. This is acceptable as an exploratory tool, but the authors should state that the cut-off is a descriptive choice and not a formal test.
- [General] No data- or code-availability statement is provided. Making the anonymised data and simulation code available would substantially strengthen the reproducibility of the results.
Circularity Check
No circularity: coefficients are estimated against a simulated null model, and the sole self-citation is corroborative, not load-bearing.
full rationale
The paper's derivation chain is: define a linear regression of cumulative tokens received (Y_ijt) on cumulative tokens given (Y_jit) and group indicator (G_ij); estimate coefficients for each round; and assess significance against 10,000 simulations of an agent-based null model in which players give uniformly at random. The null model is parameter-free and simulated independently of the data, so the coefficients rho_t and gamma_t are not set by construction and the central claims do not reduce to fitted inputs. The self-citation to [9] in the Discussion is used only to note agreement with prior findings and is not the basis for the group-effect conclusion, which the paper's own null-model comparison establishes; under the review rules, this corroborative citation does not raise the circularity score. The cumulative construction of Y_ijt and Y_jit means that early-round estimates have limited variation and the temporal trajectory of rho_t could reflect accumulation of counts rather than a genuine strengthening of reciprocity; however, this is a statistical-power or construct-interpretation concern, not a case where a 'prediction' is equivalent to its inputs by definition. The influence metric is a diagnostic built on the fitted model and null-replacement simulations; it is not presented as an independent derivation. No uniqueness theorem, ansatz-by-citation, or renaming of a known result is load-bearing. Therefore the paper is not circular.
Assumptions & free parameters
free parameters (1)
- influence threshold =
2
assumptions (2)
- domain assumption The null model of random giving, with each player choosing each other player with equal probability in each round, represents the 'no effect' baseline for reciprocity and group preference.
- domain assumption The linear model in Eq (3.2) with additive reciprocity and group effects is an adequate representation of the data-generating process for cumulative token counts.
Cite this review
Pith. "Pith review of A modelling methodology for social interaction experiments." pith.science (2026). https://pith.science/paper/EEK3H7YE
@misc{pith2026190802586,
  author       = {Pith},
  title        = {Pith review of: A modelling methodology for social interaction experiments},
  year         = {2026},
  howpublished = {\url{https://pith.science/paper/EEK3H7YE}},
  note         = {Machine review of arXiv:1908.02586}
}
read the original abstract
Analysis of temporal network data arising from online interactive social experiments is not possible with standard statistical methods because the assumptions of these models, such as independence of observations, are not satisfied. In this paper, we outline a modelling methodology for such experiments where, as an example, we analyse data collected using the Virtual Interaction Application (VIAPPL) --- a software platform for conducting experiments that reveal how social norms and identities emerge through social interaction. We apply our model to show that ingroup favouritism and reciprocity are present in the experiments, and to quantify the strengthening of these behaviours over time. Our method enables us to identify participants whose behaviour is markedly different from the norm. We use the method to provide a visualisation of the data that highlights the level of ingroup favouritism, the strong reciprocal relationships, and the different behaviour of participants in the game. While our methodology was developed with VIAPPL in mind, its usage extends to any type of social interaction data.
Figures

Figures from the paper (8 more)




Reference graph
Works this paper leans on
-
[1]
The evolution of strategies in the iterated p risoners dilemma
Robert Axelrod et al. The evolution of strategies in the iterated p risoners dilemma. The dynamics of norms , pages 1–16, 1987
work page 1987
-
[2]
Blanca, Rafael Alarc´ on, and Roser Bono
Mar ´ ıa J. Blanca, Rafael Alarc´ on, and Roser Bono. Current practices in data analysis procedures in psychology: What has changed? Frontiers in Psychology, 9, dec 2018
work page 2018
- [3]
-
[4]
Simulating social phenomena , volume 456
Rosaria Conte, Rainer Hegselmann, and Pietro Terna. Simulating social phenomena , volume 456. Springer Science & Business Media, 2013
work page 2013
-
[5]
R. Dennis. Cook and Sanford Weisberg. Residuals and influence in r egression. Mono- graphs on statistics and applied probability , 1982
work page 1982
-
[6]
The igraph software package for complex network research
Gabor Csardi and Tamas Nepusz. The igraph software package for complex network research. InterJournal, Complex Systems:1695, 2006
2006
-
[7]
Collective action and psychologica l change: The emergence of new social identities
John Drury and Steve Reicher. Collective action and psychologica l change: The emergence of new social identities. British journal of social psychology , 39(4):579– 604, 2000
work page 2000
-
[8]
Collective psychological empower ment as a model of social change: Researching crowds and power
John Drury and Steve Reicher. Collective psychological empower ment as a model of social change: Researching crowds and power. Journal of Social Issues , 65(4):707– 725, 2009
work page 2009
Show all 26 references
-
[9]
Tredoux, Kim Titlestad, an d Larry Tooke
Kevin Durrheim, Michael Quayle, Colin G. Tredoux, Kim Titlestad, an d Larry Tooke. Investigating the evolution of ingroup favoritism using a minimal grou p interac- tion paradigm: The effects of inter- and intragroup interdependen ce. PLOS ONE , 11(11):e0165974, nov 2016
2016
-
[10]
Damien R. Farine. A guide to null models for animal social network analysis. Methods in Ecology and Evolution , 8(10):1309–1320, apr 2017
2017
-
[11]
The rise of social bots
Emilio Ferrara, Onur Varol, Clayton Davis, Filippo Menczer, and Ale ssandro Flam- mini. The rise of social bots. Communications of the ACM , 59(7):96–104, 2016. 20
2016
-
[12]
Graph drawing b y force-directed placement
Thomas MJ Fruchterman and Edward M Reingold. Graph drawing b y force-directed placement. Software: Practice and experience , 21(11):1129–1164, 1991
1991
-
[13]
Null models in ecology
Nicholas J Gotelli and Gary R Graves. Null models in ecology . Smithsonian Institu- tion Scholarly Press, 1996
1996
-
[14]
Identity entreprene urship and the con- sequences of identity failure: The dynamics of leadership in the bbc p rison study
S Alexander Haslam and Stephen Reicher. Identity entreprene urship and the con- sequences of identity failure: The dynamics of leadership in the bbc p rison study. Social psychology quarterly , 70(2):125–147, 2007
2007
-
[15]
Ioannides
Yannis M. Ioannides. From Neighborhoods to Nations: The Economics of Social Interactions. Princeton University Press, 2012
2012
-
[16]
No rton, and Kurt Gray
Joshua Conrad Jackson, David Rand, Kevin Lewis, Michael I. No rton, and Kurt Gray. Agent-based modeling: a guide for social psychologists. Social Psychological and Personality Science , 8(4):387–395, mar 2017
2017
-
[17]
Rentfrow, Julien M
Corentin Vande Kerckhove, Samuel Martin, Pascal Gend, Pet er J. Rentfrow, Julien M. Hendrickx, and Vincent D. Blondel. Modelling influence and opin ion evo- lution in online collective behaviour. PLOS ONE , 11(6):e0157685, jun 2016
2016
-
[18]
McCullagh and J.A
P. McCullagh and J.A. Nelder. Generalized Linear Models, Second Edition. Chapman & Hall/CRC Monographs on Statistics & Applied Probability. Chapman & H all, 1989
1989
-
[19]
Kleinbaum, Lawrence L
Azhar Nizam, David G. Kleinbaum, Lawrence L. Kupper, and Eli Ro senberg. Applied Regression Analysis and Other Multivariable Methods . Cengage Learning, Inc, 2013
2013
-
[20]
Social influence in small groups: An interactive model of social identity formation
Tom Postmes, S Alexander Haslam, and Roderick I Swaab. Social influence in small groups: An interactive model of social identity formation. European review of social psychology, 16(1):1–42, 2005
2005
-
[21]
The formation o f group norms in computer-mediated communication
Tom Postmes, Russell Spears, and Martin Lea. The formation o f group norms in computer-mediated communication. Human communication research, 26(3):341–371, 2000
2000
-
[22]
A social identity model of deindividuation phenomena
Stephen D Reicher, Russell Spears, and Tom Postmes. A social identity model of deindividuation phenomena. European review of social psychology , 6(1):161–198, 1995
1995
-
[23]
The development of share d stereotypic impressions in conversation: An emerging model, methods, and exte nsions to cross- group settings
Janet B Ruscher and Elliott D Hammer. The development of share d stereotypic impressions in conversation: An emerging model, methods, and exte nsions to cross- group settings. Journal of Language and Social Psychology , 25(3):221–243, 2006
2006
-
[24]
Group identity, social influen ce, and collective action online
Russell Spears and Tom Postmes. Group identity, social influen ce, and collective action online. The Handbook of the Psychology of Communication Technology , John Wiley & Sons, Oxford , pages 23–46, 2015. 21
2015
-
[25]
Online human-bot interactions: Detection, estimation, and cha racterization
Onur Varol, Emilio Ferrara, Clayton A Davis, Filippo Menczer, and A lessandro Flam- mini. Online human-bot interactions: Detection, estimation, and cha racterization. In Eleventh international AAAI conference on web and social me dia, 2017
2017
-
[26]
On the use of random graphs as nu ll model of large connected networks
Sebastian Wandelt, Xiaoqian Sun, Ernestina Menasalvas, Alejan dro Rodr ´ ıguez- Gonz´ alez, and Massimiliano Zanin. On the use of random graphs as nu ll model of large connected networks. Chaos, Solitons & Fractals , 119:318–325, feb 2019. 22
2019
Reviewed August 14, 2026 · model on record in the stance chip above.
Discussion (0). Continue with ORCID to comment.