REVIEW 3 major objections 7 minor 37 references
Probing the Origin of Stellar Flares on M dwarfs Using TESS Data Sectors 1-3
T0 review · 3 major / 7 minor · reviewed 2026-08-14 · deepseek-v4-flash
Pith's one-line read This paper presents TESS observations showing that flares on 149 M dwarfs are uniformly distributed in rotational phase, meaning the dominant starspot is not the flare site.
desk verdict A clean confirmation of the Paper I null result on M-dwarf flare phases, with a larger TESS sample, but the paper overstates the cleanliness of the spot-phase mapping and contains one statistically wrong paragraph. read the letter →
The pith
A machine-rendered reading of the paper's core claim, the machinery that carries it, and where it could break.
The reading
What carries the argument
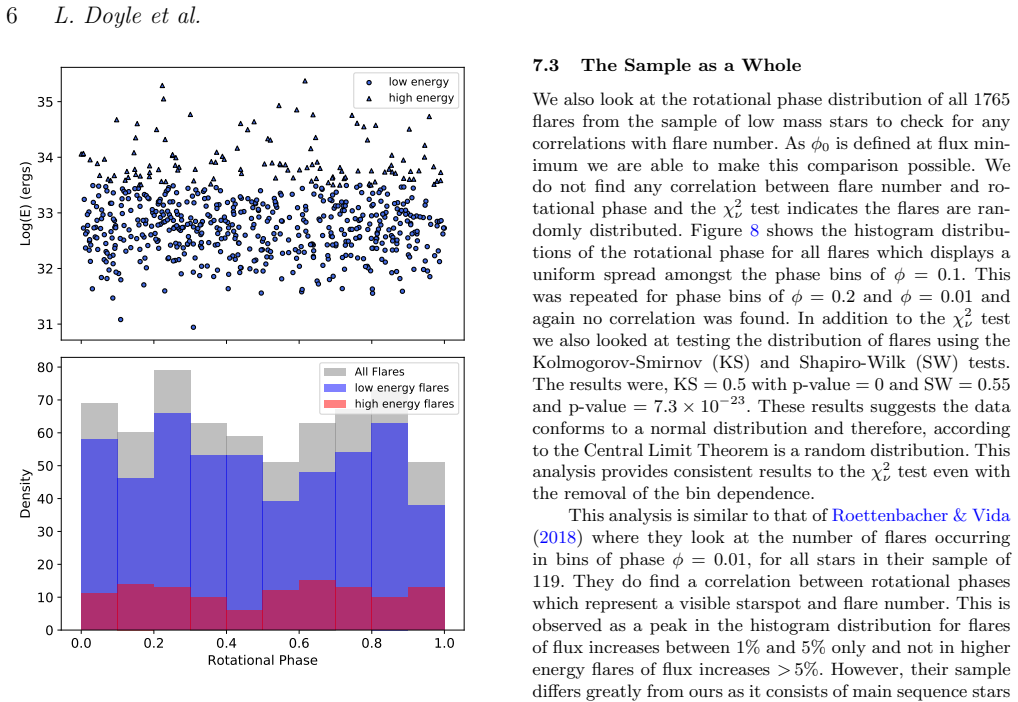
The load-bearing tool is the phase-folded flare distribution tested against uniformity with a $\chi^2_\nu$ statistic (the reduced chi-squared test), with phase zero $\varphi_0$ defined as the minimum of the rotational light curve. That definition maps the phase of maximum spot visibility onto a common reference for all stars, so the test becomes a direct check of whether flare number clusters at the starspot phase. It is supplemented by Kolmogorov-Smirnov and Shapiro-Wilk tests and by binning at several phase widths, all of which return the same null result.
What would settle it
A direct test would be simultaneous Doppler imaging and high-cadence flare monitoring: if flares preferentially occur over the longitudes where the imaged surface spots are located, the null claim is refuted. Short of that, a star with a flat-bottomed, single-spot light curve and many flares should show a significant chi-squared excess at the phase of spot center if the spot is the flare site; looking for such an object in TESS data would settle the question.
Extended reading notes
Core claim
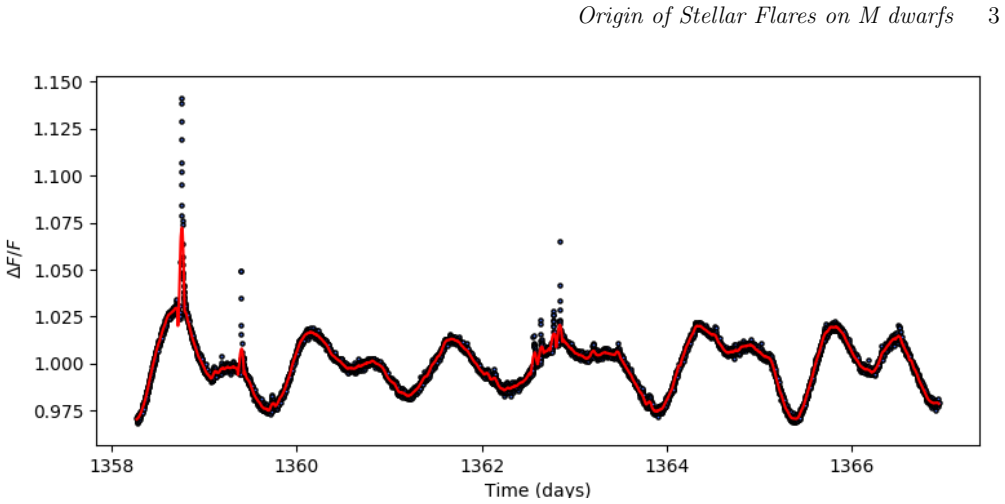
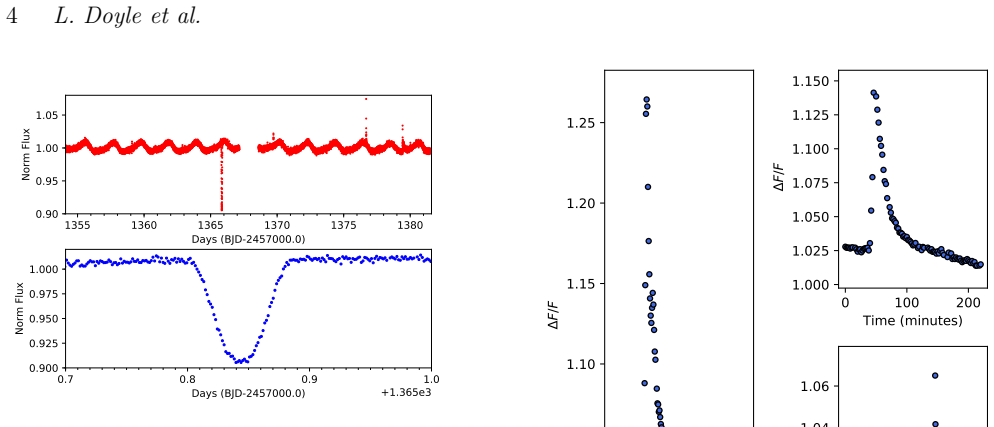
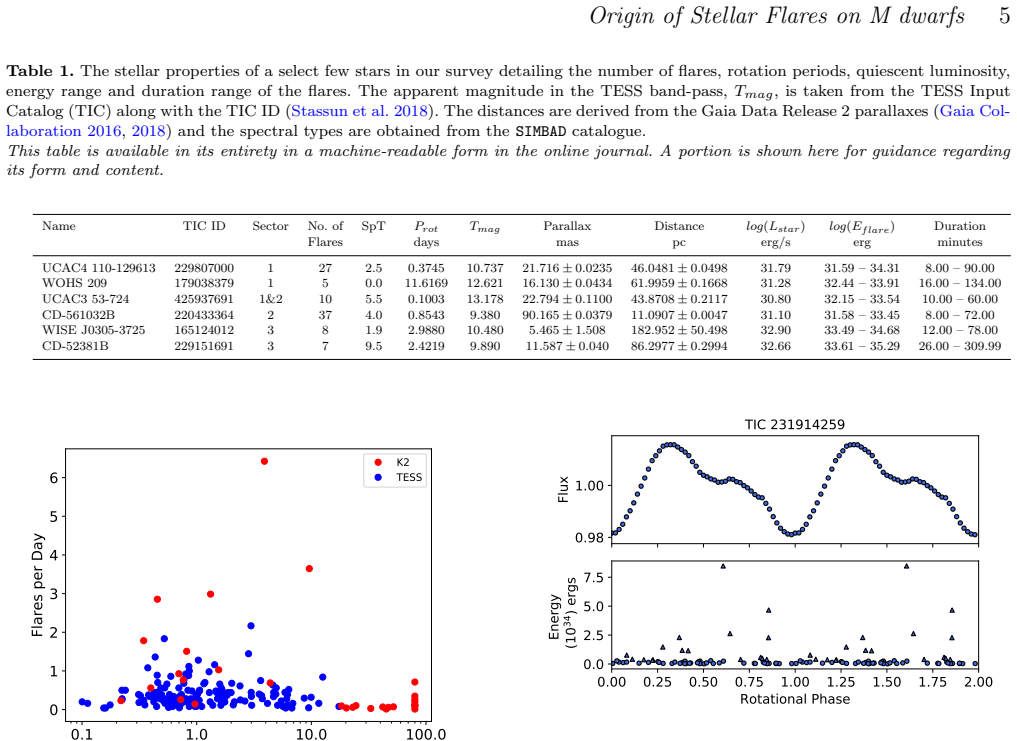
The central discovery is a null result, stated as a positive claim: the rotational phase of flares on M dwarfs is statistically indistinguishable from uniform. Phase zero is defined as the minimum of the rotational modulation, the phase at which the inferred large spot is most visible; if flares came from that spot, they should pile up at this phase. Instead, a reduced chi-squared test on the full sample yields values consistent with randomness, and no individual active star deviates. The result survives when the sample is restricted to stars showing a single clean sinusoidal spot signal, when stars with nearby contaminating companions are removed, and when flares are split by energy around $10^{33.5}$ erg. The authors read this as evidence that the dominant starspot is not where flares originate, and discuss five scenarios, including multiple spot locations, polar spots, star-planet and star-star interactions, and magnetic configuration, that could produce flares across all phases.
Load-bearing premise
The result rests on identifying the phase of minimum brightness with the phase at which the dominant starspot is most visible; if the rotational modulation actually combines several active regions, the phase label is blurred and the test cannot isolate a single flare site.
Editorial extensions
If this is right
- The large spot that modulates the light curve is not the flare site, so models of M-dwarf flares must seek a different trigger geometry.
- High- and low-energy flares, split at $10^{33.5}$ erg, are both phase-uniform, so the decoupling from the dominant spot holds across the energy range.
- Removing stars with nearby companions and stars whose light curves show multiple spots does not change the null result, so the finding is not an artifact of those subsets.
- The result confirms and strengthens the earlier K2-based null finding, extending the conclusion to TESS data and to a larger sample of low-mass stars.
Reading between the lines
- Beyond the paper, if the phase-zero mapping at flux minimum does not pinpoint a single active region, the true flare-spot correlation could be diluted; Doppler imaging of spot longitudes would provide an unblurred phase label.
- Beyond the paper, the uniform phase distribution hints that flare ignition on fully convective stars may be governed by small-scale or axisymmetric fields rather than longitude-localized activity; a coronal X-ray phase analysis could test whether the same holds for the highest-energy events.
- Beyond the paper, because the TESS band-pass is red and M-dwarf flares peak toward the blue, low-energy flares may be missed; simultaneous blue or ultraviolet photometry of a subset could reveal phase structure that the red light curve hides.
Signed reviews
Editorial analysis
A structured set of objections, weighed in public.
Referee Report
Summary. This paper analyzes TESS 2-minute cadence photometry from Sectors 1–3 to test whether flares on M dwarfs occur preferentially at the rotational phase of a dominant starspot. From a sample of 167 M dwarfs, the authors retain 149 stars showing rotational modulation, derive rotation periods and phase zeros (defined as flux minimum), detect 1765 flares with FBEYE, and estimate flare energies in the TESS band-pass. Using reduced chi-squared tests on phase-binned flare counts, they find no significant phase preference for individual active stars (45 stars with ≥13 flares) or for the grouped remaining 104 stars, with χ2ν values of 1.25 (all), 0.57 (high-energy), and 0.57 (low-energy) after setting phase zero at flux minimum. The authors conclude that flare number is not correlated with the large, dominant starspot and discuss alternative scenarios including star–planet interactions, polar spots, and multiple active regions.
Significance. If the result holds, it is a valuable empirical constraint on the flare–spot connection for M dwarfs, extending the earlier K2 study of Doyle et al. (2018) to a larger TESS sample with higher cadence. The sample-level chi-squared analysis is straightforward and appropriate: rotation periods and phase zeros are determined before the phase test, and the null hypothesis of uniform phase distribution is not fitted to the data. The robustness checks (removing nearby-star contaminants, splitting by spectral type and period, excluding multi-spot lightcurves) are thoughtful and support a population-level null result. The main limitation is interpretive: the mapping from φ0 to a single dominant spot is not established, and the paper contains a clear statistical misstatement in the Kolmogorov–Smirnov/Shapiro–Wilk paragraph. With those points addressed, the paper would be a useful contribution.
major comments (3)
- [§7.3] The interpretation of the KS and SW tests is reversed. The reported p-values of 0 and 7.3×10⁻²³ mean the null hypothesis of normality is rejected with overwhelming significance; they do not indicate that the data 'conforms to a normal distribution.' Moreover, the invocation of the Central Limit Theorem is not a valid way to conclude that the phase distribution is random — the CLT describes the distribution of a sample mean, not the goodness of fit of the raw data to normality. This paragraph should be rewritten; the chi-squared test remains the primary evidence, but as written the supporting test actually argues against uniformity if taken at face value, and in any case is not evidence for uniformity.
- [§5, §7, §9] The interpretation of the null result as absence of a flare–dominant-spot correlation depends on φ0 marking the longitude of a single dominant spot. Section 5 defines φ0 as the flux minimum and attributes the modulation to a 'large, dominant starspot,' but Section 9 states that the sinusoidal pattern is not produced by a circular large starspot but by multiple active regions, with one region responsible for the trough. If several active regions at different longitudes contribute to the modulation, φ0 is the phase of maximum total spot coverage rather than a unique spot longitude. Flares from other active regions would then populate all phases, diluting any phase preference and biasing the chi-squared test toward uniformity. Removing the 23% of stars with obvious multi-spot lightcurves (Section 7.3) does not fully solve this, since a single sinusoid can also arise from a few spots at similar longitudes. The paper should either obtain an independent spot-longitude constraint or explicitly reframe the conclusion as a null result for the phase of maximum spot coverage, not for the dominant spot.
- [Abstract] The abstract claims 'none of the stars in our sample show any preference for rotational phase,' but only the 45 stars with 13 or more flares are tested individually; the other 104 stars are combined into a grouped analysis (Section 7.2). The grouped test supports a population-level null result but does not demonstrate that each star individually lacks a phase preference. The wording should be softened to match the actual analysis, e.g., 'we find no evidence for a rotational phase preference in the sample as a whole or in any of the 45 individually testable stars.'
minor comments (7)
- [§7.1, Figure 6, Figure 8] Throughout these sections, the symbols '¿' and '¡' appear in place of '>' and '<'; please correct these and the missing superscripts in '10 33.5 erg' (e.g., §6, §7.1).
- [§5] The statement 'Phase zero, φ0, is also defined as the minimum of the flux of the rotational modulation which is initially determined by eye' would benefit from a clearer explanation of how the eye-determined φ0 was refined in the iterative period-fitting process.
- [§7.2] The reduced chi-squared values alone are reported without p-values or degrees of freedom; for 9 degrees of freedom, χ2ν = 1.25 gives χ2 = 11.25 (p ≈ 0.26), and χ2ν = 0.57 gives χ2 = 5.13 (p ≈ 0.82). Reporting p-values would make the uniformity claim easier to assess.
- [§7.1] The energy threshold is described as 'determined from a histogram distribution of all flares which levelled off at 10^33.5 erg'; please specify the exact criterion, since the low/high split is used throughout the analysis.
- [Figure 3 caption] 'In principal' should be 'In principle.'
- [§1] 'were we will discuss' should be 'where we will discuss.'
- [§4] The sentence 'Each Sector is observed for ∼ 27 days with 28 percent of the sample being observed in more than one sector' should clarify whether the 28 percent refers to 167 or 149 stars, and how multi-sector data were combined when computing phase.
Circularity Check
No significant circularity: the flare-phase null result is an independent empirical chi-squared test, not a fitted or self-referential prediction.
full rationale
The paper's central claim is an empirical null result: it determines rotation periods and phase zeros from the rotational modulation in TESS photometry before comparing flare phases, then applies a chi-squared test to the observed phase distribution. No parameter is fitted to the flare phase distribution, so the reported reduced chi-squared values (1.25, 0.57 and 0.57 for the grouped sample) are data-derived statistics rather than outputs of a model whose assumptions include uniformity. The self-citation of Doyle et al. (2018, Paper I) is methodological (the same FBEYE flare-finding pipeline and the same chi-squared procedure) and the earlier null result is cited for comparison, not as the evidence for the TESS finding; the TESS analysis stands on its own data. The data-dependent thresholds (the >12-flare activity cut and the 10^33.5 erg energy split) define subsamples but were not chosen to force a uniform phase distribution, and removing nearby-star targets and multi-spot targets does not change the result. The Section 7.3 Kolmogorov-Smirnov and Shapiro-Wilk passage is statistically misstated (the p-values reject normality rather than confirm it), and the Section 9 admission that the sinusoid arises from multiple active regions weakens the interpretation of phi0 as the longitude of a single dominant spot; however, these are correctness and interpretation concerns, not circularity, because the phase distribution itself is not constructed from the conclusion. The analysis is self-contained against external TESS data and no circular step is exhibited.
Assumptions & free parameters
free parameters (5)
- Per-star rotation period and phase zero =
Prot = 0.1-17.4 days; phi0 at flux minimum per star (Table 1)
- FBEYE flare detection threshold =
2.5 sigma, minimum 2 consecutive points
- Active-star flare-number cutoff =
13 or more flares (stars above the overall mean flare number)
- High/low flare energy cutoff =
10^33.5 erg
- Phase bin width =
10 bins of 0.1 in phase (also 0.2 and 0.01 for stability checks)
assumptions (4)
- domain assumption Rotational modulation in M dwarf lightcurves is caused by a dominant, cooler starspot rotating into and out of view.
- domain assumption Flare events detected by FBEYE as 2.5-sigma excursions of at least two consecutive points are genuine stellar flares rather than instrumental or background events.
- domain assumption The quiescent stellar flux and luminosity derived from SkyMapper photometry convolved with the TESS band-pass and Gaia DR2 parallaxes are accurate enough to place flare energies on an absolute scale.
- domain assumption The chi-squared test with 10 phase bins is valid for the sample sizes used, particularly for individual stars with as few as 13 flares.
Cite this review
Pith. "Pith review of Probing the Origin of Stellar Flares on M dwarfs Using TESS Data Sectors 1-3." pith.science (2026). https://pith.science/paper/HAVPFSMM
@misc{pith2026190802698,
  author       = {Pith},
  title        = {Pith review of: Probing the Origin of Stellar Flares on M dwarfs Using TESS Data Sectors 1-3},
  year         = {2026},
  howpublished = {\url{https://pith.science/paper/HAVPFSMM}},
  note         = {Machine review of arXiv:1908.02698}
}
abstract
Detailed studies of the Sun have shown that sunspots and solar flares are closely correlated. Photometric data from Kepler/K2 has allowed similar studies to be carried out on other stars. Here, we utilise TESS photometric 2-min cadence of 167 low mass stars from Sectors 1 - 3 to investigate the relationship between starspots and stellar flares. From our sample, 90 percent show clear rotational modulation likely due to the presence of a large, dominant starspot and we use this to determine a rotational period for each star. Additionally, each low mass star shows one or more flares in its lightcurve and using Gaia DR2 parallaxes and SkyMapper magnitudes we can estimate the energy of the flares in the TESS band-pass. Overall, we have 1834 flares from the 167 low mass stars with energies from $6.0\times 10^{29}$ - $2.4\times 10^{35}$~erg. We find none of the stars in our sample show any preference for rotational phase suggesting the lack of a correlation between the large, dominant star spot and flare number. We discuss this finding in greater detail and present further scenarios to account for the origin of flares on these low mass stars.
Figures

Figures from the paper (4 more)


Reference graph
Works this paper leans on
-
[1]
, Github, https://stardate.readthedocs.io/en/latest/
Angus R., 2019, stardate: a tool for measuring precise stellar ages. , Github, https://stardate.readthedocs.io/en/latest/
work page 2019
- [2]
- [3]
-
[4]
Barnes J., Jeffers S., Haswell C., Jones H., Shulyak D., Pavlenko Y. V., Jenkins J. S., 2017, , 471, 811
work page 2017
-
[5]
Borucki W. J., et al., 2010, @doi [Science] 10.1126/science.1185402 , http://adsabs.harvard.edu/abs/2010Sci...327..977B 327, 977
-
[6]
Byrne P., Eibe M., Van den Oord G., 1998, in International Astronomical Union Colloquium. pp 226--234
work page 1998
-
[7]
R., et al., 2014, , 797, 122
Davenport J. R., et al., 2014, , 797, 122
2014
-
[8]
Dhillon V., Privett G., Duffey K., 2001, Starlink User Note, 167
work page 2001
Show all 37 references
-
[9]
G., Wu K., Scullion E., 2018, , 480, 2153
Doyle L., Ramsay G., Doyle J. G., Wu K., Scullion E., 2018, , 480, 2153
2018
-
[10]
A., Henry G
Eaton J. A., Henry G. W., Fekel F. C., 1996, , 462, 888
1996
-
[11]
Fischer C., Saur J., 2019, , 872, 113
2019
-
[12]
Gaia Collaboration Brown A. G. A. e. a., 2016, , 595, A2
2016
-
[13]
Gaia Collaboration Brown A. G. A. e. a., 2018, , 616, A1
2018
-
[14]
N., et al., 2019, arXiv e-prints, http://adsabs.harvard.edu/abs/2019arXiv190100443G
G \"u nther M. N., et al., 2019, arXiv e-prints, http://adsabs.harvard.edu/abs/2019arXiv190100443G
2019
-
[15]
W., Noyes R
Hartmann L. W., Noyes R. W., 1987, Annual review of astronomy and astrophysics, 25, 271
1987
-
[16]
S., Corbett H., Law N
Howard W. S., Corbett H., Law N. M., Ratzloff J. K., Glazier A. L., Fors O., del Ser D., Haislip J., 2019, arXiv preprint arXiv:1904.10421
2019 arXiv
-
[17]
Kiraga M., Stepien K., 2007, AcA, 57
2007
-
[18]
Kochukhov O., Lavail A., 2017, , 835, L4
2017
-
[19]
Kuhar M., Krucker S., Oliveros J. C. M., Battaglia M., Kleint L., Casadei D., Hudson H. S., 2015, , 816, 6
2015
-
[20]
Maggio A., Sciortino S., Vaiana G., Majer P., Bookbinder J., Golub L., Harnden Jr F., Rosner R., 1987, , 315, 687
1987
-
[21]
T., McTiernan J
Mariska J. T., McTiernan J. M., 1999, , 514, 484
1999
-
[22]
S., 1990, Solar Physics, 125, 251
McIntosh P. S., 1990, Solar Physics, 125, 251
1990
-
[23]
McQuillan A., Aigrain S., Mazeh T., 2013, , 432, 1203
2013
-
[24]
McQuillan A., Mazeh T., Aigrain S., 2014, , 211, 24
2014
-
[25]
D., 2015, isochrones: Stellar model grid package , Astrophysics Source Code Library ( @eprint ascl 1503.010 )
Morton T. D., 2015, isochrones: Stellar model grid package , Astrophysics Source Code Library ( @eprint ascl 1503.010 )
2015
-
[26]
Ol \'a h K., Kov \'a ri Z., Bartus J., Strassmeier K., Hall D., Henry G., 1997, , 321, 811
1997
-
[27]
G., Hakala P., Garcia-Alvarez D., Brooks A., Barclay T., Still M., 2013, @doi [ ] 10.1093/mnras/stt1182 , http://adsabs.harvard.edu/abs/2013MNRAS.434.2451R 434, 2451
Ramsay G., Doyle J. G., Hakala P., Garcia-Alvarez D., Brooks A., Barclay T., Still M., 2013, @doi [ ] 10.1093/mnras/stt1182 , http://adsabs.harvard.edu/abs/2013MNRAS.434.2451R 434, 2451
2013 doi
-
[28]
R., et al., 2015, @doi [Journal of Astronomical Telescopes, Instruments, and Systems] 10.1117/1.JATIS.1.1.014003 , http://adsabs.harvard.edu/abs/2015JATIS...1a4003R 1, 014003
Ricker G. R., et al., 2015, @doi [Journal of Astronomical Telescopes, Instruments, and Systems] 10.1117/1.JATIS.1.1.014003 , http://adsabs.harvard.edu/abs/2015JATIS...1a4003R 1, 014003
2015 doi
-
[29]
M., Vida K., 2018, , 868, 3
Roettenbacher R. M., Vida K., 2018, , 868, 3
2018
-
[30]
Route M., 2019, , 872, 79
2019
-
[31]
Silva A. V. R., 2003, @doi [ ] 10.1086/374324 , https://ui.adsabs.harvard.edu/abs/2003ApJ...585L.147S 585, L147
2003 doi
-
[32]
G., et al., 2018, The Astronomical Journal, 156, 102
Stassun K. G., et al., 2018, The Astronomical Journal, 156, 102
2018
-
[33]
G., 1996, in Symposium-International Astronomical Union
Strassmeier K. G., 1996, in Symposium-International Astronomical Union. pp 289--298
1996
-
[34]
pp 251--254
Van den Oord G., Byrne P., Eibe M., 1998, in International Astronomical Union Colloquium. pp 251--254
1998
-
[35]
Wolf C., et al., 2018, Publications of the Astronomical Society of Australia, 35
2018
-
[36]
Yang H., et al., 2017, , 849, 36
2017
-
[37]
A., 1982, Solar Physics, 113, 267
Zirin H., Liggett M. A., 1982, Solar Physics, 113, 267
1982
Reviewed August 14, 2026 · model on record in the stance chip above.
Discussion (0). Continue with ORCID to comment.