REVIEW 3 major objections 4 minor 25 references
Signatures of red-shifted footpoints in the quiescent coronal loop system
T0 review · 3 major / 4 minor · reviewed 2026-08-14 · deepseek-v4-flash
Pith's one-line read Quiescent coronal loop footpoints host transition-region downflows of 1–7 km/s that match low-frequency impulsive nanoflare heating.
desk verdict A careful but small IRIS/SDO study of quiescent loop footpoints; the Si IV red-shift result is plausible but rests on an unquantified wavelength zero point and a calibration typo that need fixing before the numbers can be trusted. read the letter →
The pith
A machine-rendered reading of the paper's core claim, the machinery that carries it, and where it could break.
The reading
What carries the argument
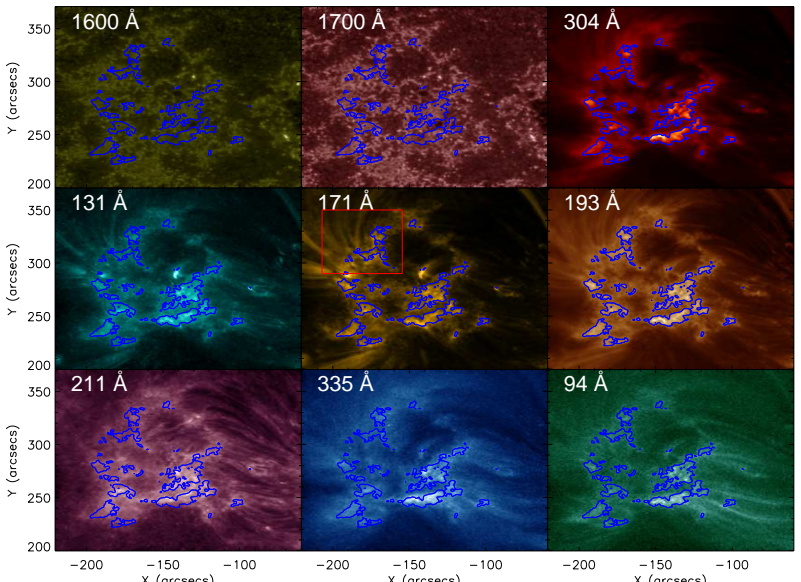
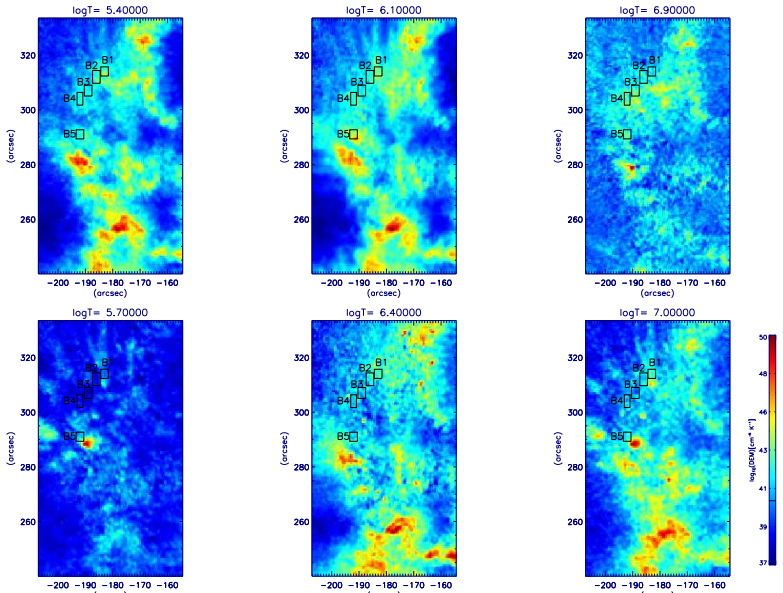
The diagnostic engine is a temperature-stratified Doppler measurement: four IRIS lines formed at increasing heights—Ni I, Mg II k3, C II, and Si IV—are fitted with single or double Gaussians, and their Doppler shifts are compared at the same footpoint pixels. The load-bearing step is the sign change between C II and Si IV, which places the transition-region downflow at $\log(T/\mathrm{K}) = 4.8$ while leaving lower layers nearly stationary. The paper also uses a 3000-count intensity threshold in 193 Å emission to identify moss and co-aligned DEM maps to establish the multi-thermal nature of the footpoints.
What would settle it
Re-measure the same footpoints with an absolute wavelength calibration independent of the quiet-Sun reference lines, for example by comparing Si IV centroids with co-spatial observations from an independently calibrated spectrometer, or by using laboratory rest wavelengths and correcting for orbital and thermal drifts from housekeeping data. If the Si IV red-shifts disappear or fall below the instrument's 1 km/s resolution after such recalibration, the paper's central claim would not survive.
Extended reading notes
Core claim
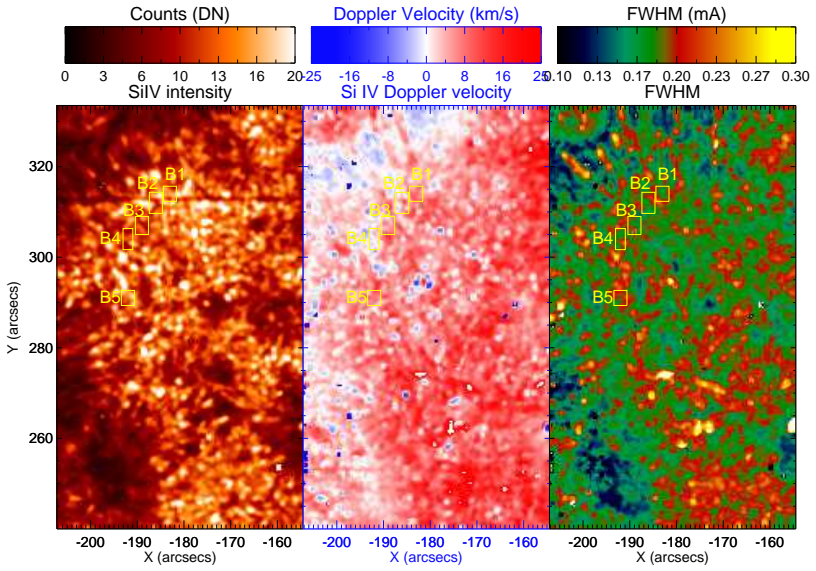
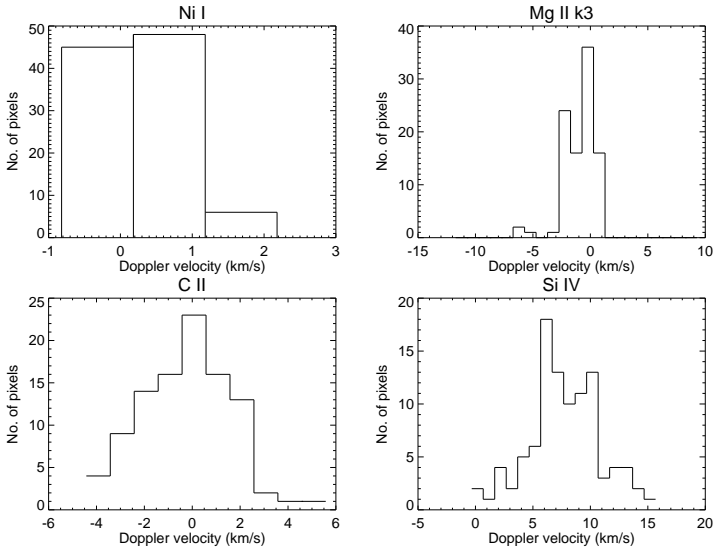
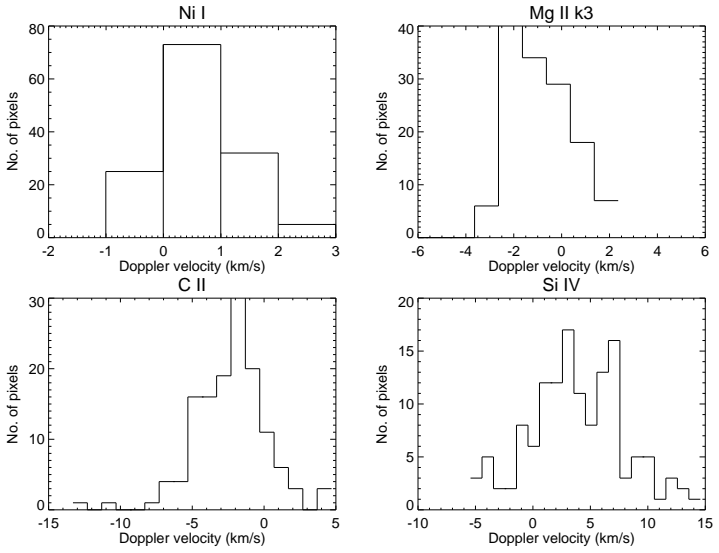
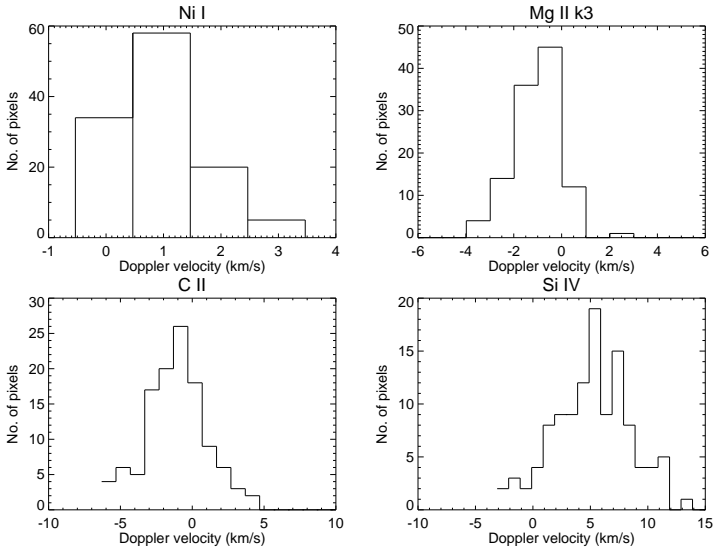
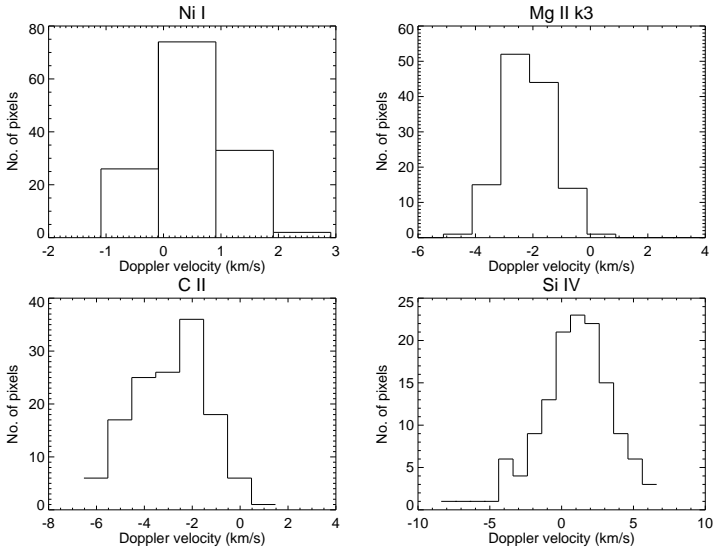
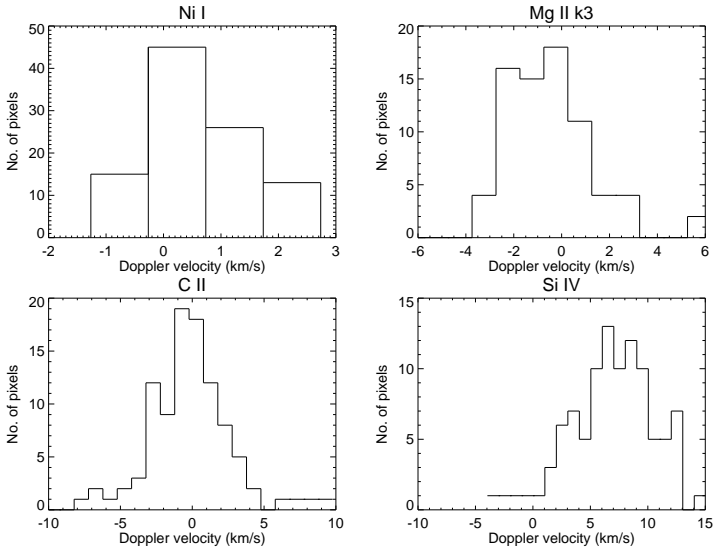
The central claim is that quiescent coronal loop footpoints embedded in moss show a clear temperature-stratified Doppler pattern: negligible flows at Ni I (photosphere), small blueshifts/upflows at C II (upper chromosphere), and persistent red-shifts (downflows) of about 0.37 to 6.97 km/s at Si IV, the transition-region line. Averaged over five footpoint boxes, the Si IV shifts are all positive, and the paper interprets this as plasma draining down after impulsive heating events. Because these downflows are smaller than those seen in active-region loops but share the same sign, the paper argues they corroborate low-frequency nanoflare heating in the coronal part of the loop system.
Load-bearing premise
The result rests on calibrating the Si IV rest wavelength against neutral lines in a relatively quiet-Sun part of the same raster; if those reference lines carry a systematic Doppler shift of even 1–2 km/s, the reported 1–7 km/s downflows would be partly or wholly artifacts.
Editorial extensions
If this is right
- If the downflows are real, quiescent moss footpoints are not static: transition-region plasma is persistently falling at a few km/s.
- The observed C II upflows to Si IV downflows can be used as a diagnostic of heating frequency, distinguishing low-frequency impulsive heating from steady heating in future observations.
- Because the speeds are smaller than active-region loops, the same impulsive mechanism may operate with lower energy or lower frequency in quiescent moss, connecting loop dynamics to heating rate.
- The result implies that moss regions could be sites of continuous mass exchange and enthalpy flux between the corona and transition region, not just bright footpoint emission.
- Future loop-heating models must reproduce both a near-stationary chromosphere and a redshifted transition region at quiescent footpoints.
Reading between the lines
- The same temperature-stratified Doppler technique could be applied to moss footpoints of different loop lengths; if low-frequency heating is the cause, the Si IV redshift magnitude should scale with loop cooling time, a test the paper does not perform.
- A testable extension would be to check whether the red-shift appears as a separate component or as a simple Gaussian centroid shift; the paper's single-Gaussian fits leave this distinction open.
- If quiescent loops are heated by low-frequency nanoflares, the footpoint redshift should be time-variable on the loop cooling timescale, so a time series of Si IV Doppler maps across a moss region could catch individual heating/cooling cycles.
- The lack of significant chromospheric flow suggests that the mass supply for these downflows comes from coronal condensation rather than from chromospheric upflow, a point worth testing with simultaneous density diagnostics.
Signed reviews
Editorial analysis
A structured set of objections, weighed in public.
Referee Report
Summary. The paper presents multi-wavelength observations of a quiescent coronal loop system on 2016 April 13, combining SDO/AIA imaging with IRIS spectroscopy. The authors identify five footpoint boxes in a moss region, extract integrated spectral profiles of Ni I, Mg II k3, C II, and Si IV, and derive Doppler velocities from single- or double-Gaussian fits. They report negligible photospheric and chromospheric flows, small C II upflows, and significant Si IV downflows of 0.37 to 6.97 km/s, summarized in the abstract as 1 to 7 km/s. Interpreting the Si IV redshift as transition-region downflow, they conclude that the quiescent loops are consistent with low-frequency impulsive nanoflare heating, with smaller speeds than active-region loops.
Significance. If the observational result is robust, the paper provides a useful constraint on coronal heating in quiescent moss structures: transition-region downflows at the few-km/s level, weaker than in active-region loops, are exactly the kind of signature that distinguishes low-frequency impulsive heating from steady heating. The paper uses standard, reproducible methods (IRIS Level 2 data, Gaussian fitting, DEM inversion with the Hannah & Kontar routine), and the multi-line temperature trend in Fig. 11 is a clear and physically motivated presentation. The central measurement is independent of the heating model being tested, so the study is not circular. However, the significance of the Si IV redshift claim is limited by the lack of an absolute wavelength-calibration error budget, because all Doppler velocities are differential with respect to quiet-Sun rest wavelengths.
major comments (3)
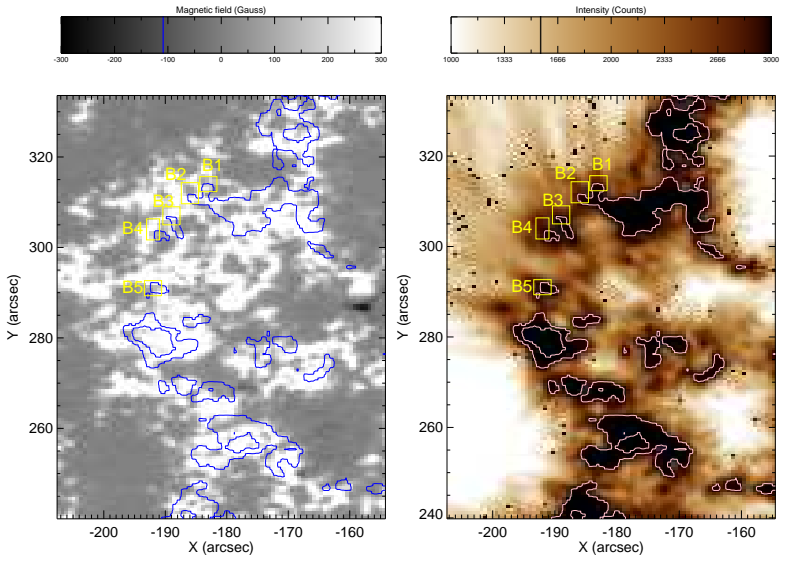
- [Section 2 (Observational Data)] The Doppler velocity scale is anchored to rest wavelengths calibrated from 'neutral lines from the relatively quiet-Sun area,' but the paper gives no uncertainty for this zero point. The reported Si IV downflows are 0.37 to 6.97 km/s, and the smallest box value (B5, Fig. 11) is 0.37 km/s; a quiet-Sun reference-frame offset of even 1 to 2 km/s, which is comparable to convective shifts and IRIS absolute-wavelength uncertainties, would change the sign of the smallest value and substantially weaken the claim that all five footpoints show red-shifts. This calibration step is load-bearing because the physical conclusion about low-frequency impulsive heating rests on the sign and magnitude of the Si IV Doppler shift. The authors should provide quantitative calibration uncertainties, or demonstrate with an external comparison that the quiet-Sun reference frame is accurate to well below 1 km/s.
- [Section 2 (Observational Data)] There is an internal inconsistency in the stated rest wavelength of the Ni I line: the text quotes 'The rest wavelength of Ni I used is 2944.4697 Å,' but the line used throughout the figures and analysis is Ni I 2799.47 Å, and 2944.4697 Å lies outside the IRIS NUV bandpass. This appears to be a typographical error for a different Ni I line, but as written it makes the calibration chain opaque. The authors should correct the quoted rest wavelength and clarify which Ni I line was used for the Mg II k calibration.
- [Section 3 (Observational Results)] The moss region is selected using an intensity threshold of 'above 3000 counts' chosen by hand (Section 3, Fig. 1 discussion), and the five boxes are drawn manually around visible loop footpoints. The paper should show that the reported Si IV redshifts are not sensitive to reasonable variations of this threshold and box placement, or at least quantify the number of pixels and the statistical significance of the box-averaged velocities. As presented, the histogram spreads in Figs. 6-10 include both red- and blue-shifted pixels, so the average positive velocity at Si IV needs a significance estimate beyond the small 1-sigma fitting errors shown in Fig. 11.
minor comments (4)
- [Section 4 (Discussions and Conclusions)] The sentence 'Asymmetries may also cause these Doppler variation in the spectral profiles due to a difference in the pressures (Mariska & Boris 1983). So, other possibilities cannot be ruled out.' is repeated verbatim; one copy should be deleted.
- [Section 3 (Observational Results)] The text 'The blueshifts (upflows) show small increment for B2, B4, and B4' lists B4 twice; this should read B2, B3, and B4 or a similar intended list.
- [Section 1/Figure 1] The caption of Fig. 1 describes 'green emission,' but the displayed color table is not described and no green contours or green emission are defined; please clarify whether the green color corresponds to a specific intensity range or filter.
- [Section 3, Figure 11] The error bars are stated to be 'difficult to visualize in Fig. 11 owing to its very small values'; please report the numerical values of the 1-sigma errors, or add a table, so that the reader can assess the significance of the box-averaged velocities.
Circularity Check
No significant circularity: the Si IV Doppler measurements are independent of the heating-model conclusion.
full rationale
The paper's claim chain is: (1) identify quiescent-loop footpoints in moss from AIA intensity maps; (2) measure Doppler velocities from IRIS line centroids calibrated against quiet-Sun reference lines in the same raster; (3) compare the resulting Si IV redshifts with published impulsive-heating model predictions (Bradshaw & Cargill 2010; Tripathi et al. 2008). The central assertion—redshifts of 1–7 km/s at Si IV—is an empirical line-position measurement, not an output of the heating model, and no parameter is fitted to the data and then renamed as a prediction. The inference to low-frequency impulsive nanoflare heating is an interpretation of the measured redshifts against external modeling, so the measurement is not defined in terms of the conclusion. The only self-citation, Rao et al. (2019), appears in a list of cool-loop references and is not load-bearing. There is no self-citation chain or imported uniqueness theorem that forces the result. Concerns about the quiet-Sun rest-wavelength zero point and the apparently inconsistent Ni I rest wavelength (2944.4697 Å versus 2799.47 Å in the analysis) are potential systematic-error issues in the Doppler calibration, but they do not make the derivation circular: the line positions are still independent of the impulsive-heating conclusion. A calibration offset could change the sign or magnitude of the reported shifts, which is a correctness/robustness risk, not a circularity risk.
Assumptions & free parameters
free parameters (1)
- Moss intensity threshold =
3000 counts in SDO/AIA 193 Å
assumptions (4)
- domain assumption The spectral lines are formed at their nominal atmospheric heights: Ni I upper photosphere, Mg II k3 chromosphere, C II upper chromosphere, and Si IV transition region.
- domain assumption Quiet-Sun neutral lines define the zero-velocity reference for all Doppler measurements.
- domain assumption Positive Doppler velocity corresponds to downflow and negative to upflow.
- domain assumption Transition-region downflows in moss are a signature of low-frequency impulsive heating.
Cite this review
Pith. "Pith review of Signatures of red-shifted footpoints in the quiescent coronal loop system." pith.science (2026). https://pith.science/paper/SQC5GR7F
@misc{pith2026190802865,
  author       = {Pith},
  title        = {Pith review of: Signatures of red-shifted footpoints in the quiescent coronal loop system},
  year         = {2026},
  howpublished = {\url{https://pith.science/paper/SQC5GR7F}},
  note         = {Machine review of arXiv:1908.02865}
}
read the original abstract
We observed quiescent coronal loops using multi-wavelength observations from the Atmospheric Imaging Assembly (AIA) onboard the Solar Dynamics Observatory (SDO) on 2016 April 13. The flows at the footpoints of such loop systems are studied using spectral data from Interface Region Imaging Spectrograph (IRIS). The Doppler velocity distributions at the footpoints lying in the moss region show the negligible or small flows at Ni I, Mg II k3 and C II line corresponding to upper photospheric and chromospheric emissions. Significant red-shifts (downflows) ranging from (1 to 7) km/s are observed at Si IV (1393.78 A; log(T/K) = 4.8) which is found to be consistent with the existing results regarding dynamical loop systems and moss regions. Such downflows agree well with the impulsive heating mechanism reported earlier.
Figures

Figures from the paper (8 more)

Reference graph
Works this paper leans on
-
[1]
, " * write output.state after.block = add.period write newline
ENTRY address author booktitle chapter doi edition editor eid howpublished institution journal key month note number organization pages publisher school series title type url volume year label extra.label sort.label short.list INTEGERS output.state before.all mid.sentence after.sentence after.block FUNCTION init.state.consts #0 'before.all := #1 'mid.sent...
-
[2]
" write newline "" before.all 'output.state := FUNCTION if.digit duplicate "0" = swap duplicate "1" = swap duplicate "2" = swap duplicate "3" = swap duplicate "4" = swap duplicate "5" = swap duplicate "6" = swap duplicate "7" = swap duplicate "8" = swap "9" = or or or or or or or or or FUNCTION n.separate 't := "" #0 'numnames := t empty not t #-1 #1 subs...
-
[3]
Bradshaw, S. J., & Cargill, P. J.: A New Enthalpy-Based Approach to the Transition Region in an Impulsively Heated Corona , ApJL, 710, L39,doi: 10.1088/2041-8205/710/1/L39, 2010
-
[4]
Brooks, D. H., Warren, H. P., & Young, P. R.: EUV Spectral Line Formation and the Temperature Structure of Active Region Fan Loops: Observations with Hinode/EIS and SDO/AIA, ApJ, 730, 85, doi: 10.1088/0004-637X/730/2/85, 2011
- [5]
-
[6]
M.; Lemen, J
De Pontieu, B.; Title, A. M.; Lemen, J. R.; Kushner, G. D.; Akin, D. J.; Allard, B.; Berger, T.; Boerner, P.; Cheung, M.; Chou, C.; Drake, J. F.; Duncan, D. W.; Freeland, S.; Heyman, G. F.; Hoffman, C.; Hurlburt, N. E.; Lindgren, R. W.; Mathur, D.; Rehse, R.; Sabolish, D. Seguin, R.; Schrijver, C. J.; Tarbell, T. D.; Wülser, J. -P.; Wolfson, C. J.; Yanari...
-
[7]
Del Zanna, G., & Mason, H. E.: Solar active regions: SOHO/CDS and TRACE observations of quiescent coronal loops A&A, 406, 1089, doi: 10.1051/0004-6361:20030791, 2003
-
[8]
Del Zanna, G.: Flows in active region loops observed by Hinode EIS , A&A, 481, L49, doi: 10.1051/0004-6361:20079087, 2008
Show all 25 references
-
[9]
E.: SDO AIA and Hinode EIS observations of "warm" loops, A&A, 535, A46, doi: 10.1051/0004-6361/201117470, 2011
Del Zanna, G., O'Dwyer, B., & Mason, H. E.: SDO AIA and Hinode EIS observations of "warm" loops, A&A, 535, A46, doi: 10.1051/0004-6361/201117470, 2011
2011 doi
-
[10]
Fletcher, L., & De Pontieu, B.: Plasma Diagnostics of Transition Region ``Moss'' using SOHO/CDS and TRACE, ApJL, 520, L135, doi: 10.1086/312157, 1999
1999 doi
-
[11]
G., & Kontar, E
Hannah, I. G., & Kontar, E. P.: Differential emission measures from the regularized inversion of Hinode and SDO data, Aap, 539, A146, doi: 10.1051/0004-6361/201117576, 2012
2012 doi
-
[12]
S.: Cool Transition Region Loops Observed by the Interface Region Imaging Spectrograph, Apj, 810, 46, doi: 10.1088/0004-637X/810/1/46, 2015
Huang, Z., Xia, L., Li, B., & Madjarska, M. S.: Cool Transition Region Loops Observed by the Interface Region Imaging Spectrograph, Apj, 810, 46, doi: 10.1088/0004-637X/810/1/46, 2015
2015 doi
-
[13]
A.: On Solving the Coronal Heating Problem, Solar Physics, 234, 41, doi: 10.1007/s11207-006-0055-z, 2006
Klimchuk, J. A.: On Solving the Coronal Heating Problem, Solar Physics, 234, 41, doi: 10.1007/s11207-006-0055-z, 2006
2006 doi
-
[14]
A.: Key aspects of coronal heating, Philosophical Transactions of the Royal Society of London Series A, 373, 20140256, doi: 10.1098/rsta.2014.0256, 2015
Klimchuk, J. A.: Key aspects of coronal heating, Philosophical Transactions of the Royal Society of London Series A, 373, 20140256, doi: 10.1098/rsta.2014.0256, 2015
2014
-
[15]
Leenaarts, J.; Pereira, T. M. D.; Carlsson, M.; Uitenbroek, H.; De Pontieu, B.: The Formation of IRIS Diagnostics. II. The Formation of the Mg II h&k Lines in the Solar Atmosphere, ApJ, 772, 90, doi: 10.1088/0004-637X/772/2/90, 2013
-
[16]
R., Title, A
Lemen, J. R., Title, A. M., Akin, D. J.: The Atmospheric Imaging Assembly (AIA) on the Solar Dynamics Observatory (SDO), Solar Physics, 275, 17, doi: 10.1007/s11207-011-9776-8, 2012
2012 doi
-
[17]
T., & Boris, J
Mariska, J. T., & Boris, J. P.: Dynamics and spectroscopy of asymmetrically heated coronal loops, ApJ, 267, 409, doi: 10.1086/160879,1983
1983 doi
-
[18]
A.: Nonthermal Spectral Line Broadening and the Nanoflare Model, ApJ, 647, 1452, doi: 10.1086/505517
Patsourakos, S., & Klimchuk, J. A.: Nonthermal Spectral Line Broadening and the Nanoflare Model, ApJ, 647, 1452, doi: 10.1086/505517
-
[19]
K., Srivastava, A
Rao, Y. K., Srivastava, A. K., Kayshap, P., Wilhelm, K., & Dwivedi, B. N.: Plasma Flows in the Cool Loop Systems, ApJ, 874, 56, doi: 10.3847/1538-4357/ab06f5, 2019
2019 doi
-
[20]
Rathore, B., Carlsson, M., Leenaarts, J., & De Pontieu, B.: The Formation of IRIS Diagnostics. VI. The Diagnostic Potential of the C II Lines at 133.5 nm in the Solar Atmosphere, ApJ, 811, 81, doi: 10.1088/0004-637X/811/2/81, 2015
-
[21]
Reale, F.: Coronal Loops: Observations and Modeling of Confined Plasma, Living Reviews in Solar Physics, 11, 4, doi: 10.12942/lrsp-2014-4, 2014
2014 doi
-
[22]
E., Young, P
Tripathi, D., Mason, H. E., Young, P. R., & Del Zanna, G.: Density structure of an active region and associated moss using Hinode/EIS, A&A, 481, L53, doi: 10.1051/0004-6361:20079034 , 2008
2008 doi
-
[23]
M., & Klimchuk, J
Viall, N. M., & Klimchuk, J. A.: A Survey of Nanoflare Properties in Active Regions Observed with the Solar Dynamics Observatory, Apj, 842, 108, doi: 10.3847/1538-4357/aa7137, 2017
2017 doi
-
[24]
P., & Brooks, D
Warren, H. P., & Brooks, D. H.: The Temperature and Density Structure of the Solar Corona. I. Observations of the Quiet Sun with the EUV Imaging Spectrometer on Hinode, ApJ, 700, 762, doi: 10.1088/0004-637X/700/1/762 ,2009
2009 doi
-
[25]
R., O'Dwyer, B., & Mason, H
Young, P. R., O'Dwyer, B., & Mason, H. E.:Velocity Measurements for a Solar Active Region Fan Loop from Hinode/EIS Observations, ApJ, 744, 14, doi: 10.1088/0004-637X/744/1/14,2012
2012 doi
Reviewed August 14, 2026 · model on record in the stance chip above.
Discussion (0). Continue with ORCID to comment.