REVIEW 3 major objections 3 minor 1 cited by
Signatures of magnetic activity: On the relation between stellar properties and p-mode frequency variations
T0 review · 3 major / 3 minor · reviewed 2026-08-14 · deepseek-v4-flash
Pith's one-line read P-mode frequency shifts in 75 Kepler stars are magnetic in origin, rising with activity and temperature, and falling with age and rotation.
desk verdict A serious, well-constructed sample paper whose aggregate correlations probably hold, but the headline Teff scaling is the one result I would not take to the bank until the noise-floor issue is addressed. read the letter →
The pith
A machine-rendered reading of the paper's core claim, the machinery that carries it, and where it could break.
The reading
What carries the argument
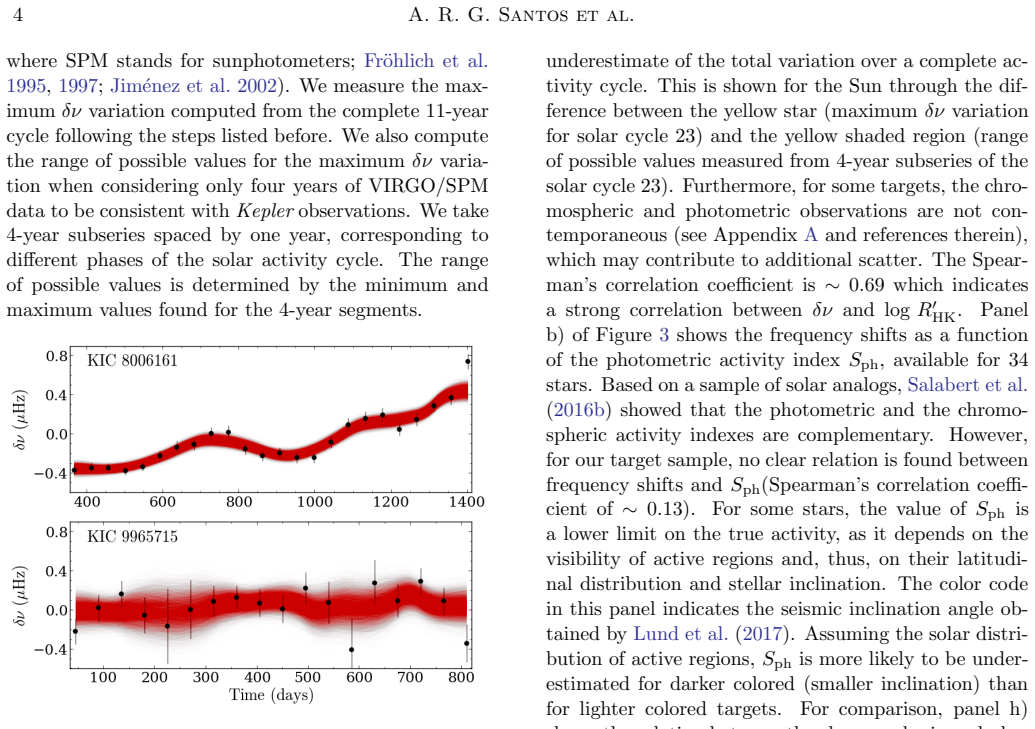
The machinery is the temporal p-mode frequency shift δν itself, measured by Santos et al. (2018) from 90-day Kepler subseries using Bayesian peak bagging, condensed into a single 'maximum δν variation' per star by a Monte Carlo smoothing estimator that filters over 180 days and takes the median of 10,000 realizations. This estimator is what lets the authors compare stars with different cycle phases and noise levels. Around it they build Spearman rank correlations with fundamental properties — temperature, age, rotation period, metallicity, Rossby number — plus the chromospheric index log R'_HK and photometric proxy S_ph, and they check the temperature relation against the theoretical predictions of Metcalfe et al. (2007) and the noise-resistant subsample of Salabert et al. (2018).
What would settle it
Recompute frequency shifts from Kepler data using longer subseries (e.g., 180 or 365 days) and a noise model that accounts for mode linewidth growth with temperature, then remeasure the Spearman correlations. If the δν–Teff correlation drops to near zero while the δν–log R'_HK correlation also weakens in a controlled sample with contemporaneous spectroscopy, the activity-related interpretation would be falsified; if the correlations survive, the claim is strengthened.
Extended reading notes
Core claim
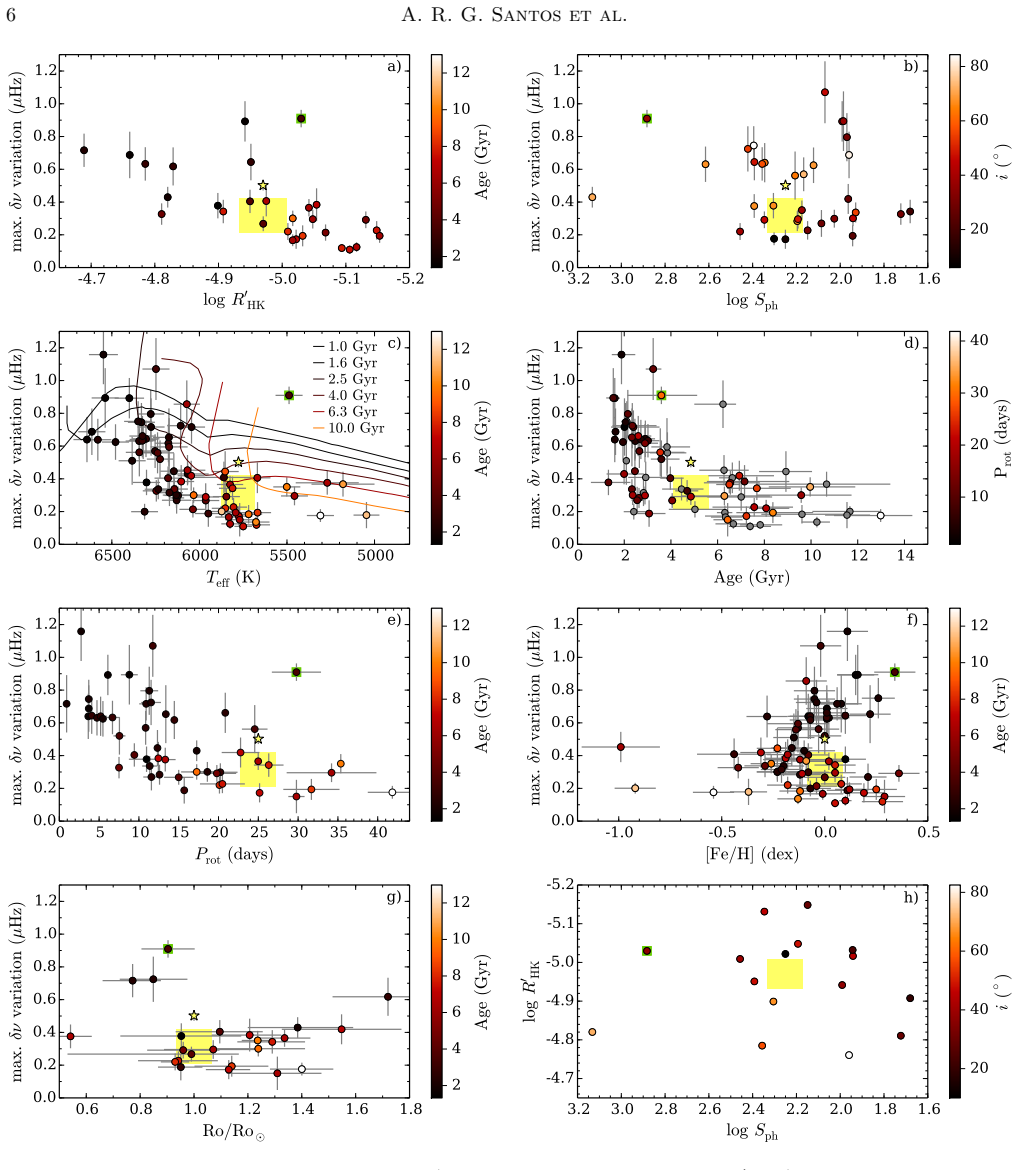
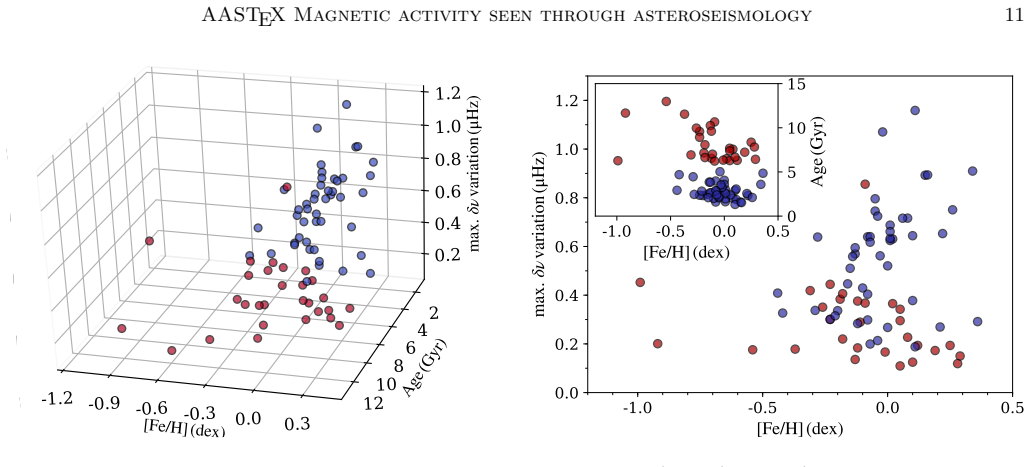
The central claim is that the maximum variation in p-mode frequencies measured over 90-day segments of Kepler data is dominated by activity-related changes in stellar interiors, not by measurement noise. The evidence is a set of Spearman correlations across 75 stars: maximum frequency shift versus chromospheric activity log R'_HK ≈ 0.69, versus effective temperature ≈ 0.68, versus age ≈ -0.66, and versus rotation period ≈ -0.61. The temperature trend agrees with the theoretical formulation of Metcalfe et al. (2007) and disagrees with Chaplin et al. (2007). The paper also reports a metallicity split: frequency shifts grow with [Fe/H] among stars younger than ~6 Gyr but shrink among older stars, and it singles out the metal-rich star KIC 8006161 as an outlier with an unusually strong activity cycle.
Load-bearing premise
The analysis assumes that the frequency shifts measured by Santos et al. (2018) trace real intrinsic stellar variability, not just noise or instrument artifacts; hotter stars have broader mode linewidths and looser frequency constraints, so if the noise contribution were underestimated, the temperature trend could be partly artificial.
Editorial extensions
If this is right
- Asteroseismic frequency shifts become a usable activity diagnostic for solar-type stars, complementing chromospheric and photometric indexes that are harder to obtain for large samples.
- The observed increase of frequency shifts with effective temperature discriminates between competing theoretical models, favouring Metcalfe et al. (2007) and locating the dominant magnetic perturbation deeper beneath the photosphere.
- Because shifts fall with age and rotation period, long-baseline asteroseismic observations can serve as a gyrochronology-adjacent indicator of magnetic activity evolution across stellar lifetimes.
- Young metal-rich stars show larger shifts, supporting the idea that metallicity deepens the convection zone and strengthens magnetic cycles, with KIC 8006161 as the extreme example.
- The Sun sits normally within the stellar relations, allowing solar cycle frequency shifts to be calibrated as one point on a general stellar sequence.
Reading between the lines
- If the temperature trend survives a mode-linewidth correction, it could be inverted to estimate the depth of the magnetic perturbation from asteroseismic data alone, something theoretical models currently input by hand.
- The weak Rossby-number correlation may sharpen once more stars have rotation periods and inclinations; separating rotation from age would test whether the age trend is purely activity-driven or partly structural evolution.
- A testable extension: feed the 75-star frequency shifts into a forward model that simulates Kepler noise and linewidths to quantify how much of the reported slopes could be noise-induced; the paper's Monte Carlo smoothing reduces but does not measure this bias.
- The metallicity–age split suggests that future samples with homogeneous [Fe/H] and age determinations could use frequency shifts as a probe of convective-zone depth across the main sequence.
Signed reviews
Editorial analysis
A structured set of objections, weighed in public.
Referee Report
Summary. This paper investigates whether the p-mode frequency shifts measured by Santos et al. (2018) in 75 Kepler solar-type stars are related to stellar magnetic activity and to fundamental stellar properties. For each star the authors define a 'maximum δν variation' using a Monte Carlo procedure: Gaussian resampling of each frequency-shift measurement within its quoted uncertainty, smoothing over 180 days, and taking the median of the max-minus-min range over 10^4 realizations. They then correlate this quantity with chromospheric activity (log R'HK, 30 stars), photometric activity (Sph, 34 stars), effective temperature, age, rotation period, metallicity, and Rossby number. They report strong Spearman correlations with chromospheric activity (~0.69), Teff (~0.68), age (~−0.66), and rotation period (~−0.61), no correlation with Sph, and a weak metallicity dependence that splits into two sequences in a cluster analysis. A multiple linear regression with Teff, age, [Fe/H], and log g finds only Teff and age statistically significant. The results are interpreted as supporting an activity-related origin of the frequency shifts and as favoring the Metcalfe et al. (2007) theoretical prediction that shifts increase with effective temperature.
Significance. If the results are robust, this is a valuable step toward establishing asteroseismology as a probe of stellar magnetic activity in a large, homogeneous sample, and it provides an observational discriminator between competing theoretical predictions (Chaplin et al. 2007 vs. Metcalfe et al. 2007). The paper has clear strengths: a well-defined sample selection that removes low signal-to-noise targets, a solar comparison with VIRGO/SPM data, explicit comparisons with chromospheric and photometric activity proxies, and a multivariate regression that attempts to separate dependencies. The central concern is the estimator used for the target quantity: because it is a range statistic, its expectation for pure noise is positive and grows with the measurement uncertainty, which is itself temperature-dependent. This directly affects the headline Teff correlation. The other correlations (age, rotation) are physically plausible but share the same estimator, so their quantitative strength is also uncertain pending a noise-floor estimate.
major comments (3)
- [Section 3, Section 4 (Fig. 3c, Appendix C)] The maximum δν estimator defined in Section 3 is a range statistic: after 10^4 Gaussian resamplings of each δν point within its quoted uncertainty and smoothing over 180 days, the median of the max-minus-min of the smoothed series is taken as the target quantity. This median is an estimate of the observed range, not a bias-corrected measure of intrinsic variation; for a pure-noise series the expected range is positive and grows with the local noise level. Because per-point frequency uncertainties increase with effective temperature (as the authors note, citing Appourchaux et al. 2012 and Lund et al. 2017), the noise contribution to max δν is expected to increase with Teff. The strong Spearman correlation in Fig. 3c (rho≈0.68) and the significant Teff coefficient in the Appendix C regression (p=0.020) are both computed on this noise-contaminated quantity, so neither breaks the confounding. The 180-day smoothing and the Salabert et al. (2018) 17-star subsample check show that the signal is not pure white noise, but they do not quantify or subtract a Teff-dependent noise floor across the full 75-star sample. Please provide a quantitative estimate of the noise-only contribution (e.g., Monte Carlo simulations of pure-noise time series with the same cadence, uncertainties, and smoothing kernel) and re-assess the Teff relation after subtracting that floor, or adopt an estimator whose expectation vanishes for pure noise.
- [Table 1, Section 4] The Spearman correlation coefficients in Table 1 are quoted without uncertainties or p-values. This matters most for the small subsets: n=30 for log R'HK, n=34 for Sph, and n=24 for Rossby number, where sampling noise is large and the difference between rho=0.69 and rho=0.13 may not be significant. Please add bootstrap or permutation-based confidence intervals and p-values for every correlation, and state the sample size in each row of Table 1.
- [Appendix B, Section 4 (panel f), abstract] The claimed metallicity dependence rests on an unsupervised cluster split whose details are not given: the algorithm, input normalization, and the number of clusters are unspecified, and the two resulting 'young' and 'old' sequences have Spearman coefficients of only 0.39 and −0.46 on subsamples. Given that the full-sample correlation is 0.09, the abstract's statement of 'evidence for frequency shifts increasing with stellar metallicity' needs a formal comparison between the two-sequence model and a single null relation (e.g., a likelihood-ratio or cross-validated comparison), rather than a post-hoc subdivision.
minor comments (3)
- [Table 1] Table 1 lists the Rossby-number Spearman coefficient as 0.11, while the text in Section 4 reports ≈ −0.11; the sign should be reconciled.
- [Section 2] The sentence 'In the next section we take further steps to ensure that the frequency variations are not noise' overstates what the smoothing and resampling procedure can accomplish; 'reduce' would be more accurate.
- [Appendix C] The multiple linear regression is performed without weighting by the reported uncertainties on max δν; given the heteroscedasticity discussed in Section 4, an inverse-variance weighted fit or explicit residual diagnostics would help assess whether the Teff and age coefficients are driven by a few low-quality points.
Circularity Check
No significant circularity: the claimed empirical relations rest on externally measured frequency shifts and independent activity indicators, not on fitted inputs or self-derived predictions.
full rationale
The paper's input data are the temporal frequency shifts measured in Santos et al. (2018), a separate published analysis; those shifts are observational measurements, not quantities fitted to the stellar properties used here. The central claims are correlations between those measured shifts and external benchmarks: chromospheric activity indices (log R_HK), photometric activity indices, effective temperature, age, rotation period, metallicity, and Rossby number. The comparison with the Metcalfe et al. (2007) theoretical curves is a comparison to published, parameter-free predictions whose assumptions do not include the observed delta-nu versus T_eff relation; it is not a redescription of the data. The paper's own Monte Carlo range statistic is a summary of the measured shifts, not a fitted parameter renamed as a prediction, and the authors explicitly check the T_eff trend against the independent Salabert et al. (2018) subsample. The main methodological concern, that the max-minus-min estimator of Section 3 may retain a T_eff-dependent noise floor because mode linewidths grow with temperature, is a statistical-bias concern about the estimator, not a case where a claimed derivation reduces by construction to its inputs. Some cited prior work has overlapping authors (Santos et al. 2018; Karoff et al. 2018; Metcalfe et al. 2007), but each of these is independently published evidence or theory, and none is used as an unverified premise that forces the conclusions. Accordingly, no step satisfies the standard for circularity, and the appropriate score is 0.
Assumptions & free parameters
free parameters (2)
- Linear regression coefficients for delta_nu(Teff, age, [Fe/H], log g) =
Constant -2.443; Teff 0.0003; [Fe/H] 0.0586; log g 0.285; Age -0.028
- Smoothing window length =
180 days
assumptions (3)
- domain assumption The chromospheric activity index log R'HK is a valid proxy for the magnetic activity responsible for frequency shifts, despite being non-contemporaneous with the Kepler observations for some stars.
- domain assumption The frequency-shift measurements from Santos et al. (2018) reflect intrinsic stellar variability and not noise or data-quality artifacts.
- domain assumption The adopted stellar parameters (Teff, log g, [Fe/H], Prot, ages, Rossby numbers) are accurate and consistent across the different literature sources.
Cite this review
Pith. "Pith review of Signatures of magnetic activity: On the relation between stellar properties and p-mode frequency variations." pith.science (2026). https://pith.science/paper/S7ZXITCL
@misc{pith2026190802897,
  author       = {Pith},
  title        = {Pith review of: Signatures of magnetic activity: On the relation between stellar properties and p-mode frequency variations},
  year         = {2026},
  howpublished = {\url{https://pith.science/paper/S7ZXITCL}},
  note         = {Machine review of arXiv:1908.02897}
}
read the original abstract
In the Sun, the properties of acoustic modes are sensitive to changes in the magnetic activity. In particular, mode frequencies are observed to increase with increasing activity level. Thanks to CoRoT and Kepler, such variations have been found in other solar-type stars and encode information on the activity-related changes in their interiors. Thus, the unprecedented long-term Kepler photometric observations provide a unique opportunity to study stellar activity through asteroseismology. The goal of this work is to investigate the dependencies of the observed mode frequency variations on the stellar parameters and whether those are consistent with an activity-related origin. We select the solar-type oscillators with highest signal-to-noise ratio, in total 75 targets. Using the temporal frequency variations determined in Santos et al. (2018), we study the relation between those variations and the fundamental stellar properties. We also compare the observed frequency shifts with chromospheric and photometric activity indexes, which are only available for a subset of the sample. We find that frequency shifts increase with increasing chromospheric activity, which is consistent with an activity-related origin of the observed frequency shifts. Frequency shifts are also found to increase with effective temperature, which is in agreement with the theoretical predictions for the activity-related frequency shifts by Metcalfe et al. (2007). Frequency shifts are largest for fast rotating and young stars, which is consistent with those being more active than slower rotators and older stars. Finally, we find evidence for frequency shifts increasing with stellar metallicity.
Figures

Figures from the paper (2 more)

Forward citations
Cited by 1 Pith paper
-
The Stellar Observations Network Group (SONG) -- A Legacy Archive of Stellar Time-Domain Spectroscopy
The SONG network archive holds >580,000 spectra of 3091 stars (2014–2025) and is presented as an open community resource for asteroseismology, binaries, variability, and exoplanets.
Reference graph
Works this paper leans on
-
[1]
v` ^]?uʟ `n& a; <L 8Ĕ- ,,C oGSD lCVl <SbV -XN a8Sv
thebibliography [1] 20pt to REFERENCES 6pt =0pt 10pt plus 3pt =0pt =0pt =1pt plus 1pt =0pt =0pt -12pt =13pt plus 1pt =20pt =13pt plus 1pt \@M =10000 =-1.0em =0pt =0pt 0pt =0pt =1.0em @enumiv\@empty 10000 10000 `\.\@m \@noitemerr \@latex@warning Empty `thebibliography' environment \@ifnextchar \@reference \@latexerr Missing key on reference command Each re...
-
[2]
Appourchaux, T., Benomar, O., Gruberbauer, M., et al. 2012, A&A, 537, A134
work page 2012
-
[3]
2006, in Proceedings of SOHO 18/ GONG 2006/ HELAS I , Beyond the Spherical Sun , Vol
Baglin, A., Michel, E., Auvergne, M., & COROT Team . 2006, in Proceedings of SOHO 18/ GONG 2006/ HELAS I , Beyond the Spherical Sun , Vol. 624, 34.1
work page 2006
-
[4]
Baliunas, S. L., Hartmann, L., Noyes, R. W., et al. 1983, ApJ, 275, 752
work page 1983
-
[5]
Barnes, S. A. 2007, ApJ, 669, 1167
2007
-
[6]
J., Koch, D., Basri, G., et al
Borucki, W. J., Koch, D., Basri, G., et al. 2010, Science, 327, 977
2010
-
[7]
Brun, A. S., & Browning, M. K. 2017, Living Rev. Solar Phys., 14, 4
work page 2017
-
[8]
J., Elsworth, Y., Houdek, G., & New, R
Chaplin, W. J., Elsworth, Y., Houdek, G., & New, R. 2007, MNRAS, 377, 17
work page 2007
Show all 59 references
-
[9]
J., Elsworth, Y., Isaak, G
Chaplin, W. J., Elsworth, Y., Isaak, G. R., et al. 1998, MNRAS, 300, 1077
1998
-
[10]
R., Chaplin, W
Davies, G. R., Chaplin, W. J., Farr, W. M., et al. 2015, MNRAS, 446, 2959
2015
-
[11]
R., Silva Aguirre, V., Bedding, T
Davies, G. R., Silva Aguirre, V., Bedding, T. R., et al. 2016, MNRAS, 456, 2183
2016
-
[12]
Dziembowski, W. A. 2007, in Unsolved Problems in Stellar Physics : A Conference in Honor of Douglas Gough , Vol. 948, eprint: arXiv:0709.2602 , 287--294
2007 arXiv
-
[13]
R., McLeod, C
Elsworth, Y., Howe, R., Isaak, G. R., McLeod, C. P., & New, R. 1990, Nat., 345, 322
1990
-
[14]
1995, Sol
Fr \"o hlich, C., Romero, J., Roth, H., et al. 1995, Sol. Phys., 162, 101
1995
-
[15]
N., Appourchaux, T., et al
Fr \"o hlich, C., Andersen, B. N., Appourchaux, T., et al. 1997, Sol. Phys., 170, 1
1997
-
[16]
A., Mathur, S., Salabert, D., et al
Garc \'i a, R. A., Mathur, S., Salabert, D., et al. 2010, Science, 329, 1032
2010
-
[17]
A., Ceillier, T., Salabert, D., et al
Garc \'i a, R. A., Ceillier, T., Salabert, D., et al. 2014, A&A, 572, A34
2014
-
[18]
Goldreich, P., & Keeley, D. A. 1977, ApJ, 212, 243
1977
-
[19]
R., Noyes, R
Hartmann, L., Soderblom, D. R., Noyes, R. W., Burnham, N., & Vaughan, A. H. 1984, ApJ, 276, 254
1984
-
[20]
R., Chaplin, W
Howe, R., Davies, G. R., Chaplin, W. J., Elsworth, Y. P., & Hale, S. J. 2015, MNRAS, 454, 4120
2015
-
[21]
Hunter, J. D. 2007, Computing in Science & Engineering, 9, 90
2007
-
[22]
2010, ApJ, 725, 875
Isaacson, H., & Fischer, D. 2010, ApJ, 725, 875
2010
-
[23]
Jim \'e nez, A., Roca Cort \'e s, T., & Jim \'e nez-Reyes , S. J. 2002, Sol. Phys., 209, 247
2002
-
[24]
2001--, SciPy : Open source scientific tools for Python , ,
Jones, E., Oliphant, T., Peterson, P., et al. 2001--, SciPy : Open source scientific tools for Python , ,
2001
-
[25]
S., Chaplin, W
Karoff, C., Metcalfe, T. S., Chaplin, W. J., et al. 2009, MNRAS, 399, 914
2009
-
[26]
2013, MNRAS, 433, 3227
---. 2013, MNRAS, 433, 3227
2013
-
[27]
S., Santos, \^A
Karoff, C., Metcalfe, T. S., Santos, \^A . R. G., et al. 2018, ApJ, 852, 46
2018
-
[28]
2017, A&A, 598, A77
Kiefer, R., Schad, A., Davies, G., & Roth, M. 2017, A&A, 598, A77
2017
-
[29]
G., & Woodard, M
Libbrecht, K. G., & Woodard, M. F. 1990, Nat., 345, 779
1990
-
[30]
N., Silva Aguirre, V., Davies, G
Lund, M. N., Silva Aguirre, V., Davies, G. R., et al. 2017, ApJ, 835, 172
2017
-
[31]
E., & Hillenbrand, L
Mamajek, E. E., & Hillenbrand, L. A. 2008, ApJ, 687, 1264
2008
-
[32]
W., Isaacson, H., Howard, A
Marcy, G. W., Isaacson, H., Howard, A. W., et al. 2014, ApJS, 210, 20
2014
-
[33]
A., Ballot, J., et al
Mathur, S., Garc \'i a, R. A., Ballot, J., et al. 2014, A&A, 562, A124
2014
-
[34]
S., Dziembowski, W
Metcalfe, T. S., Dziembowski, W. A., Judge, P. G., & Snow, M. 2007, MNRAS, 379, L16
2007
-
[35]
1982, A&A, 107, 31
Middelkoop, F. 1982, A&A, 107, 31
1982
-
[36]
W., Hartmann, L
Noyes, R. W., Hartmann, L. W., Baliunas, S. L., Duncan, D. K., & Vaughan, A. H. 1984, ApJ, 279, 763
1984
-
[37]
2011, ApJS, 192, 3
Paxton, B., Bildsten, L., Dotter, A., et al. 2011, ApJS, 192, 3
2011
-
[38]
2013, ApJS, 208, 4
Paxton, B., Cantiello, M., Arras, P., et al. 2013, ApJS, 208, 4
2013
-
[39]
2015, ApJS, 220, 15
Paxton, B., Marchant, P., Schwab, J., et al. 2015, ApJS, 220, 15
2015
-
[40]
B., et al
Paxton, B., Schwab, J., Bauer, E. B., et al. 2018, ApJS, 234, 34
2018
-
[41]
2011, JMLR, 12, 2825
Pedregosa, F., Varoquaux, G., Gramfort, A., et al. 2011, JMLR, 12, 2825
2011
-
[42]
A., & Ballot, J
R \'e gulo, C., Garc \'i a, R. A., & Ballot, J. 2016, A&A, 589, A103
2016
-
[43]
Rutten, R. G. M. 1984, A&A, 130, 353
1984
-
[44]
A., Jim \'e nez, A., et al
Salabert, D., Garc \'i a, R. A., Jim \'e nez, A., et al. 2017, A&A, 608, A87
2017
-
[45]
Salabert, D., R \'e gulo, C., P \'e rez Hern \'a ndez, F., & Garc \'i a, R. A. 2018, A&A, 611, A84
2018
-
[46]
A., et al
Salabert, D., R \'e gulo, C., Garc \'i a, R. A., et al. 2016 a , A&A, 589, A118
2016
-
[47]
A., Beck, P
Salabert, D., Garc \'i a, R. A., Beck, P. G., et al. 2016 b , A&A, 596, A31
2016
-
[48]
Santos, A. R. G., Campante, T. L., Chaplin, W. J., et al. 2018, ApJS, 237, 17
2018
-
[49]
R., Basu, S., et al
Silva Aguirre, V., Davies, G. R., Basu, S., et al. 2015, MNRAS, 452, 2127
2015
-
[50]
N., Antia, H
Silva Aguirre, V., Lund, M. N., Antia, H. M., et al. 2017, ApJ, 835, 173
2017
-
[51]
1972, ApJ, 171, 565
Skumanich, A. 1972, ApJ, 171, 565
1972
-
[52]
C., & Varoquaux, G
van der Walt, S., Colbert, S. C., & Varoquaux, G. 2011, CiSE, 13, 22
2011
-
[53]
L., Ceillier, T., Metcalfe, T
van Saders , J. L., Ceillier, T., Metcalfe, T. S., et al. 2016, Nat., 529, 181
2016
-
[54]
H., Baliunas, S
Vaughan, A. H., Baliunas, S. L., Middelkoop, F., et al. 1981, ApJ, 250, 276
1981
-
[55]
2000, Astron
Wenger, M., Ochsenbein, F., Egret, D., et al. 2000, Astron. Astrophys. Suppl. Ser., 143, 9
2000
-
[56]
Wilson, O. C. 1963, ApJ, 138, 832
1963
-
[57]
C., & Skumanich, A
Wilson, O. C., & Skumanich, A. 1964, ApJ, 140, 1401
1964
-
[58]
F., & Noyes, R
Woodard, M. F., & Noyes, R. W. 1985, Nat., 318, 449
1985
-
[59]
T., Marcy, G
Wright, J. T., Marcy, G. W., Butler, R. P., & Vogt, S. S. 2004, ApJS, 152, 261
2004
Reviewed August 14, 2026 · model on record in the stance chip above.
Discussion (0). Continue with ORCID to comment.