REVIEW 3 major objections 5 minor 26 references
The nascent wind of AGB star R Doradus: evidence for a recent episode of enhanced mass loss
T0 review · 3 major / 5 minor · reviewed 2026-08-14 · deepseek-v4-flash
Pith's one-line read SO emission from R Dor shows a clumpy radial outflow and a century-old mass-loss episode
desk verdict A careful ALMA morpho-kinematic study of R Dor's slow wind that identifies plausible radial outflow cores, but the claim of a century-old mass-loss episode is not secure—the SiO map fills the same cavity that SO shows as a depletion. read the letter →
The pith
A machine-rendered reading of the paper's core claim, the machinery that carries it, and where it could break.
The reading
What carries the argument
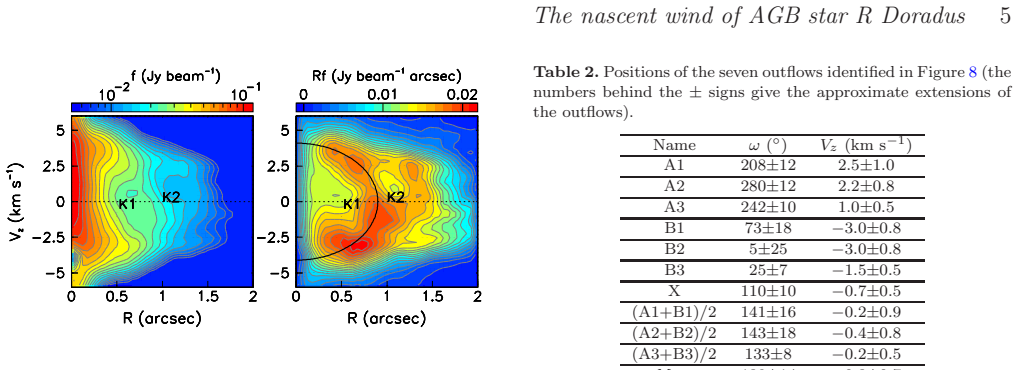
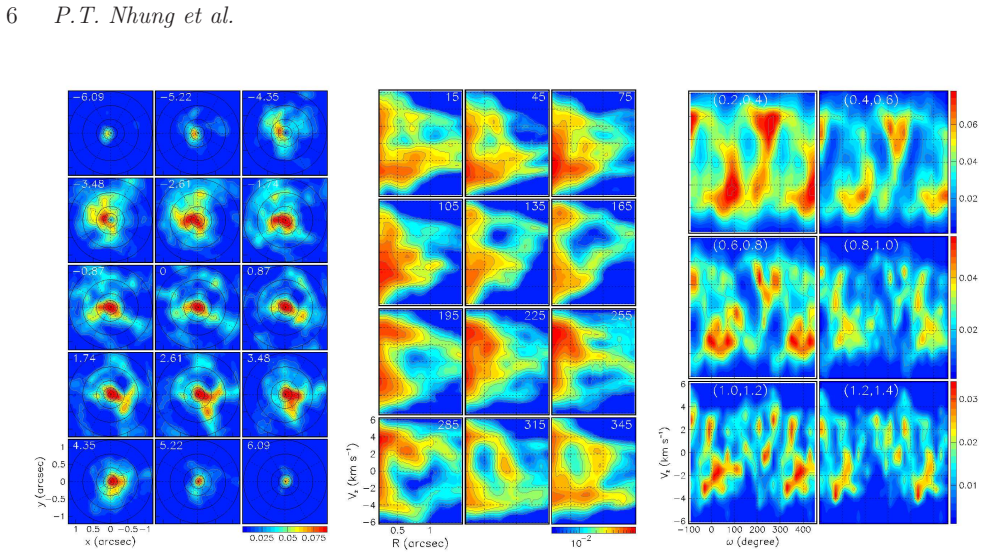
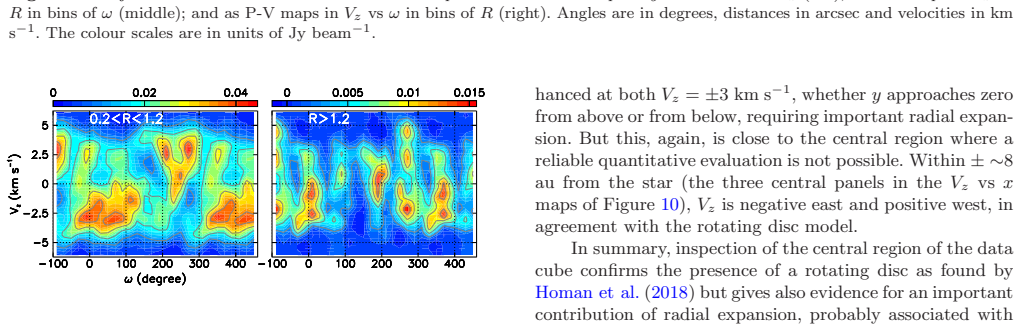
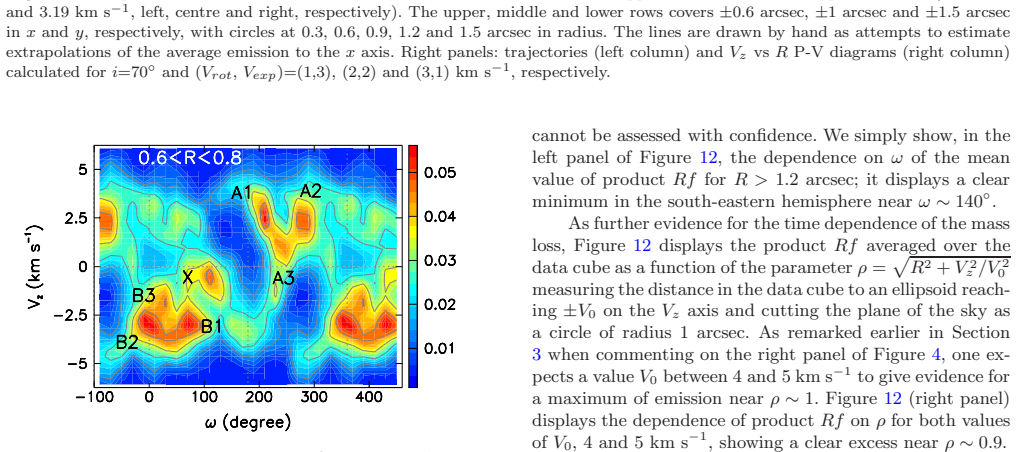
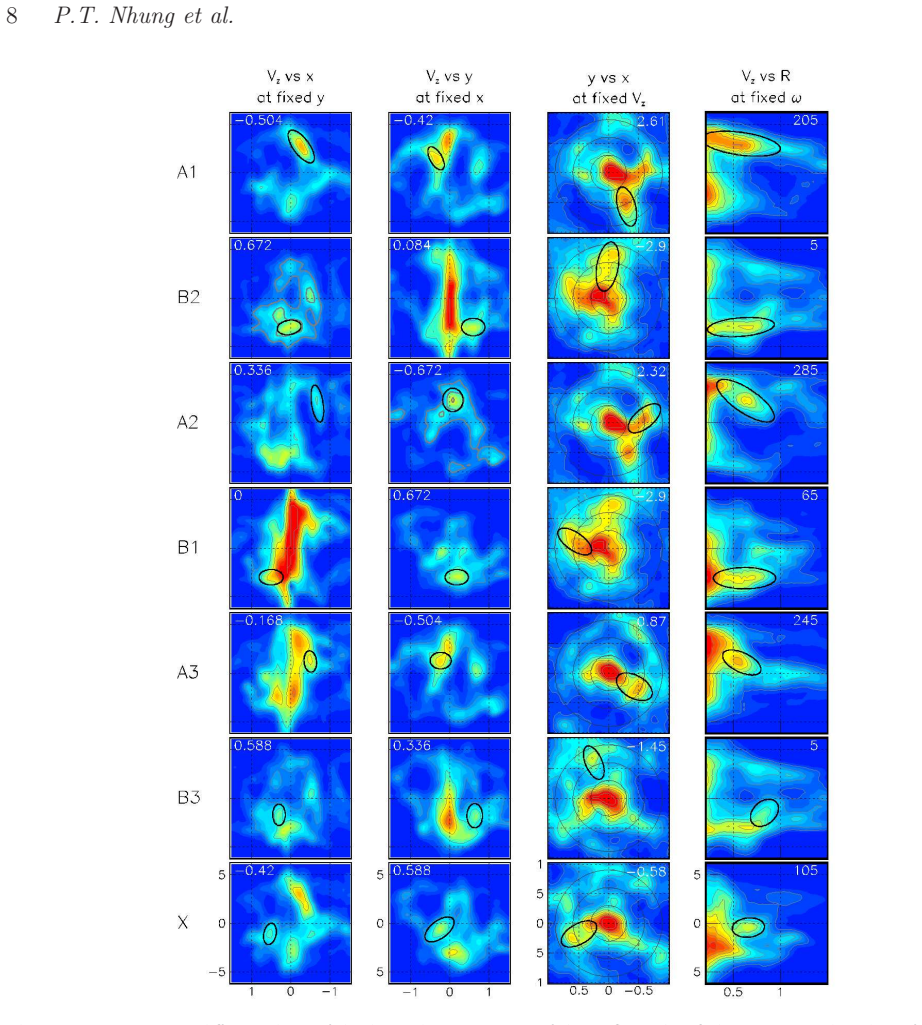
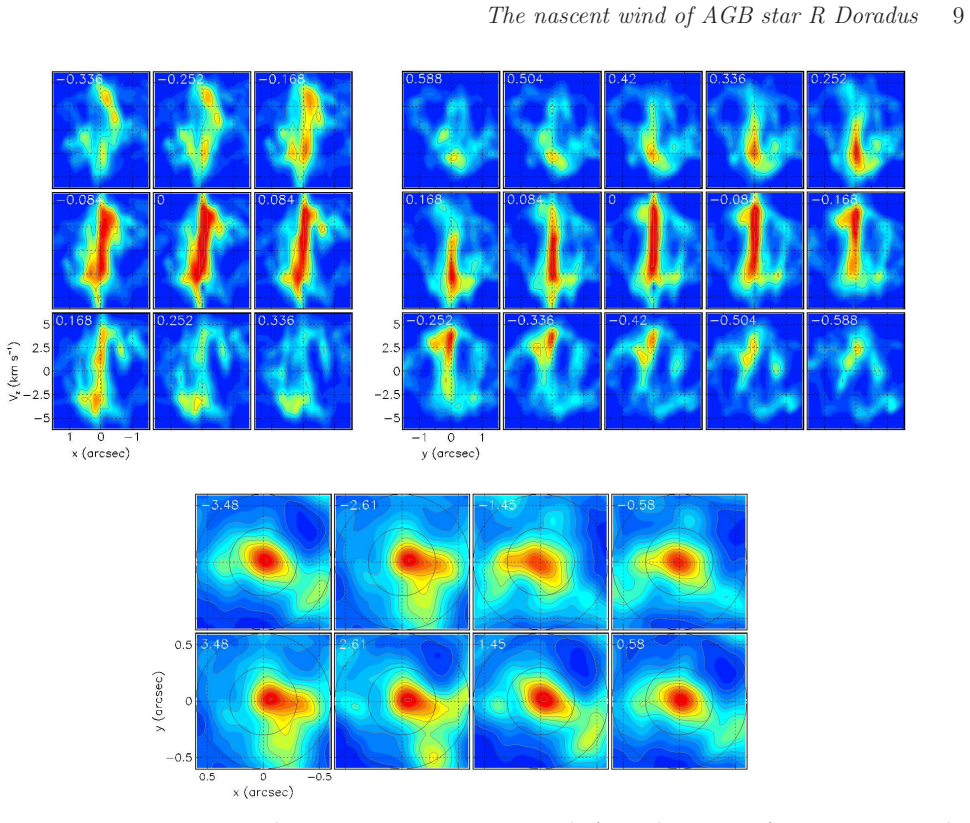
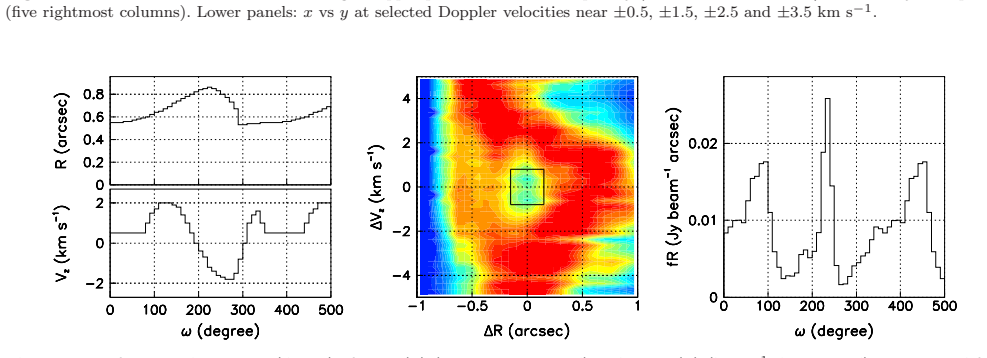
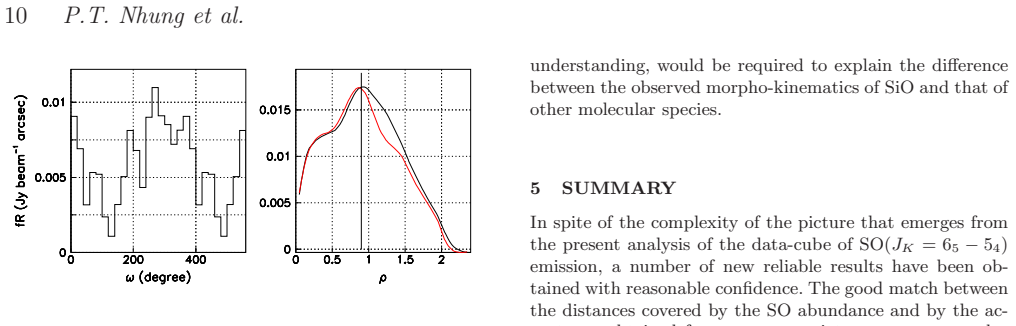
The working object is the ALMA data cube of SO($J_K = 6_5 - 5_4$) emission, a three-dimensional map with two sky axes and one Doppler-velocity axis, at 9 au spatial resolution and 0.29 km s$^{-1}$ velocity resolution. Its main analytical tools are position-velocity (P-V) maps: slices of that cube in the $V_z$ versus position-angle plane, in the $V_z$ versus projected-radius plane, and near the line of sight. The key move is to isolate the radial-outflow candidates in the projected-distance interval 0.6 to 0.8 arcsec, where rotation and expansion effects are balanced enough for outflows to be identifiable, and to define the radial coordinate $\rho = \sqrt{R^2 + V_z^2/V_0^2}$, which measures distance in the cube from an ellipsoid reaching $\pm V_0$ on the velocity axis; the excess of $R f$ near $\rho \sim 0.9$ is the quantitative trace of the proposed mass-loss episode. The K1 cavity is tracked by fitting a torus through the ring of low emission and studying the residual brightness around it, and comparisons with CO, SiO, SO$_2$, and HCN provide cross-checks.
What would settle it
A model of SO line formation in the R Dor envelope that includes optical depth, non-LTE excitation, and the actual uv coverage, and that reproduces the observed data cube without any radial outflow or K1 cavity, would falsify the central claim; so would a purely rotating kinematic model that fits the P-V maps and the ring depletions. A direct observational test is to image the same region in an optically thin tracer (for example C$^{18}$O) at comparable resolution: if no ring cavity at $\sim 0.6$ arcsec and no A/B core pair is seen, the inferred mass-loss episode is an artifact of the SO tracer.
Extended reading notes
Core claim
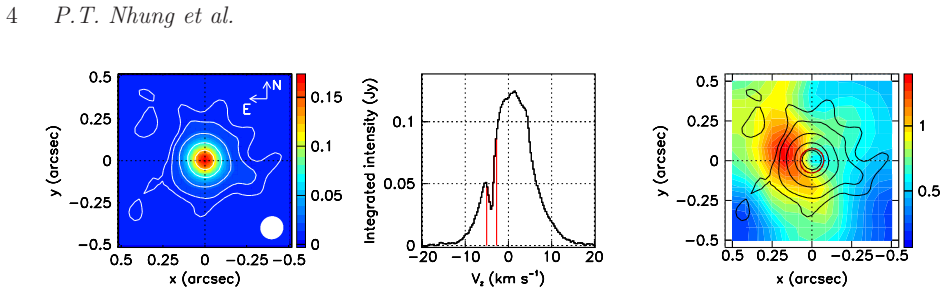
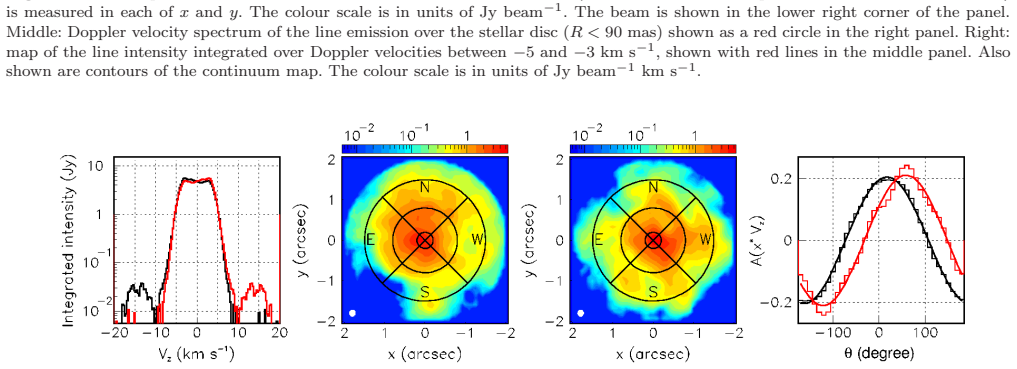
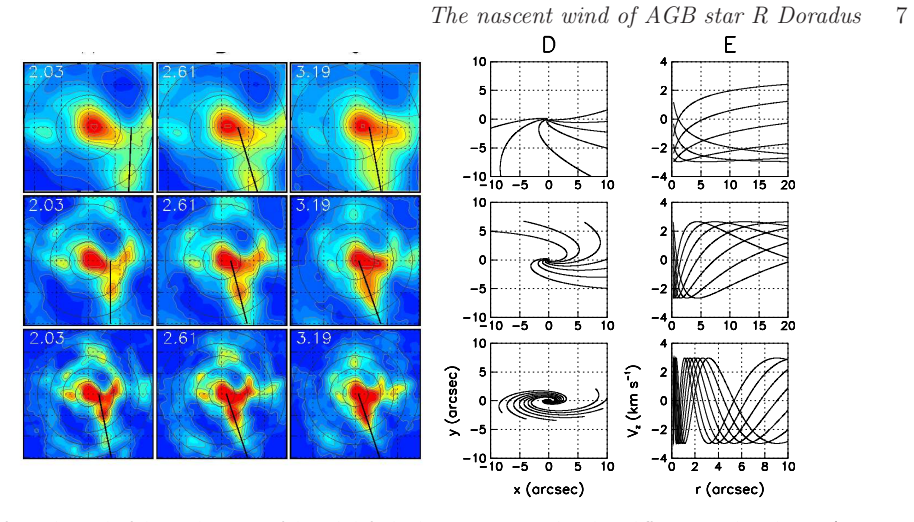
The central claim is that the morpho-kinematics of R Dor's nascent wind, as traced by SO($J_K = 6_5 - 5_4$) emission between about 20 and 100 au, combines a previously identified rotating disc with a dominant radial outflow that is strongly inhomogeneous in direction and in radius. Directional inhomogeneity appears as pairs of emission cores (A1/A2 and B1/B2, roughly symmetric about position angle $\sim 140^\circ$, not quite back-to-back) covering large solid angles, and radial inhomogeneity appears as the K1 and K2 ring depletions. The authors read the K1 toroidal cavity as the trace of a quieter mass-loss phase that followed an episode of enhanced mass loss; translating the 0.5 to 1 arcsec scale at roughly 1 arcsec per century gives an episode 'a century or so ago.' They also confirm the inner rotating disc (radius $\sim 25$ au, tangential velocity $\sim 3$ km s$^{-1}$) and show that the outflow symmetry axis ($\sim 140^\circ$) is not aligned with the inner rotation axis ($\sim 20^\circ$), suggesting the outflows and the inner rotation are unrelated. Companion-line comparisons show that CO, SO$_2$, and HCN broadly reproduce the SO pattern, while SiO does not, which the paper takes as evidence that different molecules probe different layers of the envelope.
Load-bearing premise
The load-bearing premise is that the SO line traces the true gas distribution of the wind: that it is effectively optically thin, that the SO/H2 abundance follows a smooth radial profile centered on the star, and that the brightness cavities and cores are real density structures rather than effects of excitation, optical depth, or the interferometer's uv coverage.
Editorial extensions
If this is right
- If the radial outflow is real, the slow wind of R Dor between 20 and 100 au is governed by expansion rather than rotation, and the outflow geometry implies the wind is far from spherical even before it reaches terminal velocity.
- A mass-loss episode roughly a century ago would mean that AGB mass loss can vary strongly on human-observable timescales, so single-epoch mass-loss-rate estimates for nearby stars may miss recent history.
- The non-alignment of the outflow symmetry axis (roughly 140 degrees) with the inner disc axis (roughly 20 degrees) indicates that the mechanism launching the outflow is decoupled from the inner rotating disc.
- If the outer K2 ring is real, it would suggest a second enhanced episode about another century earlier, extending the mass-loss timeline recorded in the envelope.
Reading between the lines
- An extension the paper does not make: the same ring-cavity technique could be applied to SO or other line data from other AGB stars to date their recent mass-loss episodes, turning single-epoch ALMA observations into a rough mass-loss-history recorder.
- The SiO discrepancy may hint that SiO emission is dominated by a different, possibly shocked or recently accelerated component, or by absorption; a targeted SiO radiative-transfer study could test whether SiO traces the same outflow or a distinct inner acceleration region.
- A direct kinematic test of the outflows would be to measure proper motions of the cores across two epochs separated by a few years: at the estimated 6 to 9 km/s outflow speeds and a distance of 59 pc, the expected motion is roughly 0.02 arcsec per year, at the edge of ALMA's astrometric capability.
- If the radial outflow and cavities are confirmed, one-dimensional spherically symmetric wind models for semi-regular variables would need revision, because the inferred density structure implied by the K1 cavity is strongly non-spherical.
Signed reviews
Editorial analysis
A structured set of objections, weighed in public.
Referee Report
Summary. This paper presents an analysis of ALMA band-6 observations of the SO(J_K=6_5-5_4) line emission toward the oxygen-rich AGB star R Dor, probing projected distances of roughly 20-100 au from the star. The authors characterize the morpho-kinematics of the nascent wind. They confirm the previously reported rotating disc in the inner ~25 au, and report evidence for a radial outflow component between ~30 and 60 au that is inhomogeneous in direction (multiple cores covering large solid angles) and radially (ring-like depletions K1 and K2). The radial structure is interpreted as evidence for an episode of enhanced mass loss about a century ago. The study is based on a single SO line, with comparisons to CO, SiO, SO2, and HCN data from another ALMA project.
Significance. The paper's strength is the high-quality ALMA SO data, with long integration time, and the honest discussion of complexity. The morphological evidence for strong asymmetry and ring-like depletions is well documented in figures and tables. If the interpretation holds, the paper would provide rare morpho-kinematic evidence for episodic, non-spherical mass loss in an AGB star's nascent wind, relevant to wind-driving mechanisms and dust formation. However, the transition from observed brightness maps to a physical episodic mass-loss episode is qualitative and relies on assumptions that are only partially tested. The multi-line comparison is commendable but also reveals a potential internal contradiction that needs to be addressed.
major comments (3)
- [Section 4.4, Figure 15] The SiO(8-7) P-V map fills cavity K1, which is a depletion in the SO, CO, SO2, and HCN maps. Since SiO is a refractory species expected to trace the same outflowing gas, its filling of K1 suggests that the K1 minimum is at least partly chemical or excitation in origin, not purely a density cavity. This undermines the Section 4.3 interpretation of K1 as a toroidal cavity associated with a quiet mass-loss period and the inferred recent enhanced mass-loss episode. The authors should address this by modeling or by explicitly explaining how the SiO map can be consistent with a density cavity.
- [Sections 3 and 4.3] The identification of K1 and K2 as episodic mass-loss signatures rests on the assumption that SO brightness traces gas density with a smooth abundance profile. No radiative-transfer or excitation modeling is presented, and the ring depletions could arise from variations in SO abundance, temperature, or optical depth. Section 4.4 itself shows that different molecules probe different regions, so the SO-specific depletion pattern cannot be taken at face value. The authors should either perform a simple excitation/abundance test or moderate the episodic claim.
- [Section 4.1, Figure 7] The outflows do not extrapolate back to the star, which the authors attribute to combined rotation and expansion. However, the invariance of the core pattern with R, used as evidence for radial expansion, could also be a projection effect of a rotating flow with emissivity inhomogeneities. A quantitative comparison of kinematic models (pure rotation versus rotation plus expansion) is missing, and would be needed to support the radial-outflow claim.
minor comments (5)
- [Abstract and Section 1] The distance range '20 to 100 au' should be checked against the actual coverage of the data, which extends to about 1.5 arcsec (~90 au at 59 pc).
- [Table 1] The normalized distribution g_n is defined in a way that is not immediately transparent; a short explanation of the normalization would improve readability.
- [Figure 7] The extrapolation lines are drawn by hand; an objective linear fit would make the offset claim more robust.
- [References] The reference to 'Hoai et al. 2019' as 'submitted to MNRAS' should be updated or clarified, since the present paper relies on it.
- [Figure captions, Sections 3 and 4] The sign convention for Doppler velocities (Vz relative to LSR 7.0 km/s) should be stated explicitly in the captions of Figures 4, 6, 11, and 15 for ease of comparison.
Circularity Check
No significant circularity: the morpho-kinematic analysis is self-contained, and the episodic mass-loss claim is an interpretive reading of the SO data-cube rather than a fitted parameter relabeled as a prediction.
full rationale
The paper's main claims—multiple outflow cores, ring-shaped depletions K1/K2, and a recent enhanced mass-loss episode—are descriptive morpho-kinematic readings of the ALMA SO data-cube, not results forced by construction. The sine-wave asymmetry decomposition attributed to Diep et al. (2016) and Nhung et al. (2018) is a geometric tool stated in the text; its parameters are descriptive fits to the data (A0 = 0.21, theta0 = 17 deg or 58 deg) and are not later relabeled as predictions. The ellipsoidal parameter rho in Section 4.3 is defined with V0 = 4-5 km/s after an enhancement was already identified from the P-V maps, so the resulting excess near rho ~ 0.9 is a consistency display rather than an independent derivation of the episodic claim. Self-citations to Hoai et al. (2019) and the authors' earlier method papers provide background and previously noted depletions, but the present evidence is independently shown in Figures 4, 8, 11 and 12. The SiO filling of cavity K1 (Section 4.4, Fig. 15) is a genuine internal tension for the density-cavity interpretation, and the authors concede that SiO probes significantly different regions (Section 5); however, that is a correctness risk, not circularity, because the episodic claim is neither defined by nor fitted to the SiO data. No circular step meeting the quoted-reduction standard is found.
Assumptions & free parameters
free parameters (2)
- V0 =
4 and 5 km/s
- assumed common radial velocity of outflow cores =
6 or 9 km/s
assumptions (5)
- domain assumption ALMA calibration, continuum subtraction, and imaging are correct.
- domain assumption SO(6_5-5_4) line emission is effectively optically thin and brightness traces the column density of SO gas.
- domain assumption SO abundance relative to H2 follows a smooth Gaussian radial profile centered on the star with HWHM about 80 au.
- domain assumption R Dor is at a distance of 59 pc and the slow wind terminal velocity is about 5-6 km/s.
- standard math At 59 pc, 1 arcsec corresponds to about 59 au, so a 3 km/s wind crosses 1 arcsec in about a century.
Cite this review
Pith. "Pith review of The nascent wind of AGB star R Doradus: evidence for a recent episode of enhanced mass loss." pith.science (2026). https://pith.science/paper/J66Y2FGP
@misc{pith2026190803311,
  author       = {Pith},
  title        = {Pith review of: The nascent wind of AGB star R Doradus: evidence for a recent episode of enhanced mass loss},
  year         = {2026},
  howpublished = {\url{https://pith.science/paper/J66Y2FGP}},
  note         = {Machine review of arXiv:1908.03311}
}
abstract
We analyse ALMA observations of the SO($J_K=6_5-5_4$) emission of the circumstellar envelope of oxygen-rich AGB star R Dor, probing distances between 20 and 100 au from the star where the nascent wind is building up. We give evidence for the slow wind to host, in addition to a previously observed rotating disc, a radial outflow covering very large solid angles and displaying strong inhomogeneity both in direction and radially: the former takes the form of multiple cores and the latter displays a radial dependence suggesting an episode of enhanced mass loss having occurred a century or so ago.
Figures

Figures from the paper (14 more)


Reference graph
Works this paper leans on
-
[1]
write newline
" write newline "" before.all 'output.state := FUNCTION fin.entry write newline FUNCTION new.block output.state before.all = 'skip after.block 'output.state := if FUNCTION new.sentence output.state after.block = 'skip output.state before.all = 'skip after.sentence 'output.state := if if FUNCTION not #0 #1 if FUNCTION and 'skip pop #0 if FUNCTION or pop #1...
-
[2]
R., Zijlstra A.A., Jones A., & Foster G., 1998, MNRAS, 301, 1073
Bedding T. R., Zijlstra A.A., Jones A., & Foster G., 1998, MNRAS, 301, 1073
work page 1998
-
[3]
Danilovich T., De Beck E., Black J.H., et al., 2016, A&A 588, A119
work page 2016
- [4]
-
[5]
Decin L., Richards A.M.S., Danilovich T., et al., 2018, A&A, 615, A28
work page 2018
-
[6]
et al., 2016, MNRAS, 461, 4276
Diep, P.N., Phuong, N.T., Hoai, D.T. et al., 2016, MNRAS, 461, 4276
work page 2016
-
[7]
Dumm T., & Schild H., 1998, New Astr., 3, 137
work page 1998
-
[8]
Fonfria, J.P., Santander-Garcia, M., Cernicharo, J. et al., 2019, A&A, 622, L14
work page 2019
Show all 26 references
-
[9]
& Hony S., 2005, A&A, 439, 171
Heras M. & Hony S., 2005, A&A, 439, 171
2005
-
[10]
Hoai D.T., Nhung P.T., Tuan-Anh P., et al., 2019, submitted to MNRAS
2019
-
[11]
Homan W., Danilovich T., Decin L., et al., 2018, A&A, 614, A113
2018
-
[12]
Khouri T., Maercker M., Waters L.B.F.M., et al., 2016, A&A, 591, A70
2016
-
[13]
Knapp G.R., Pourbaix D., Platais, I., and Jorissen, A., 2003, A&A, 403, 993
2003
-
[14]
Lebzelter, T., and Hron, J., 1999, A&A, 351, 533
1999
-
[15]
& Goodson, A., 2000, ApJ, 545, 965
Matt S., Balick, B., Winglee, R. & Goodson, A., 2000, ApJ, 545, 965
2000
-
[16]
et al., 2018, MNRAS, 480, 3324
Nhung P.T., Hoai D.T., Tuan-Anh P. et al., 2018, MNRAS, 480, 3324
2018
-
[17]
et al., 2019, A&A, 623A, 1530
Olofsson, H., Khouri, T., Maercker, M. et al., 2019, A&A, 623A, 1530
2019
-
[18]
Ramstedt, S., & Olofsson H., 2014, A&A 566, A145
2014
-
[19]
et al., 2018, A&A, 616A, 61
Ramstedt, S., Mohamed, S., Olander, T. et al., 2018, A&A, 616A, 61
2018
-
[20]
et al., 2018, A&A, 618, A164
S\' a nchez Contreras, C., Alcolea, J., Bujarrabal, V. et al., 2018, A&A, 618, A164
2018
-
[21]
et al., 2015, RAA, 15, 2213
Tuan Anh, P., Diep, P.N., Hoai, D.T. et al., 2015, RAA, 15, 2213
2015
-
[22]
Tuan-Anh P., Hoai D.T., Nhung P.T., et al., 2019, MNRAS, 487, 622
2019
-
[23]
Van de Sande M., Decin L., Lombaert R., et al., 2018, A&A 609, A63
2018
-
[24]
van Leeuwen F., 2007, A&A, 474, 653
2007
-
[25]
Vlemmings W.H.T., Khouri T., De Beck E., et al., 2018, A&A, 613, L4
2018
-
[26]
& Wyrowski F., 2016, A&A, 590, A127
Wong K.T., Kaminski T., Menten K.M. & Wyrowski F., 2016, A&A, 590, A127
2016
Reviewed August 14, 2026 · model on record in the stance chip above.
Discussion (0). Continue with ORCID to comment.