REVIEW 3 major objections 5 minor 14 references
Observations on spatial variations of the Sr~{\sc i} 4607~\AA~scattering polarization signals at different limb distances with ZIMPOL
T0 review · 3 major / 5 minor · reviewed 2026-08-14 · deepseek-v4-flash
Pith's one-line read Granule-to-granule variations in the Sr I 4607 Å scattering-polarization signal are seen at every limb distance, with the signal higher in bright granules.
desk verdict Useful new multi-limb-distance dataset, but the headline correlation claim is statistically over-stated because the Pearson tests ignore spatial/temporal autocorrelation. read the letter →
The pith
A machine-rendered reading of the paper's core claim, the machinery that carries it, and where it could break.
The reading
What carries the argument
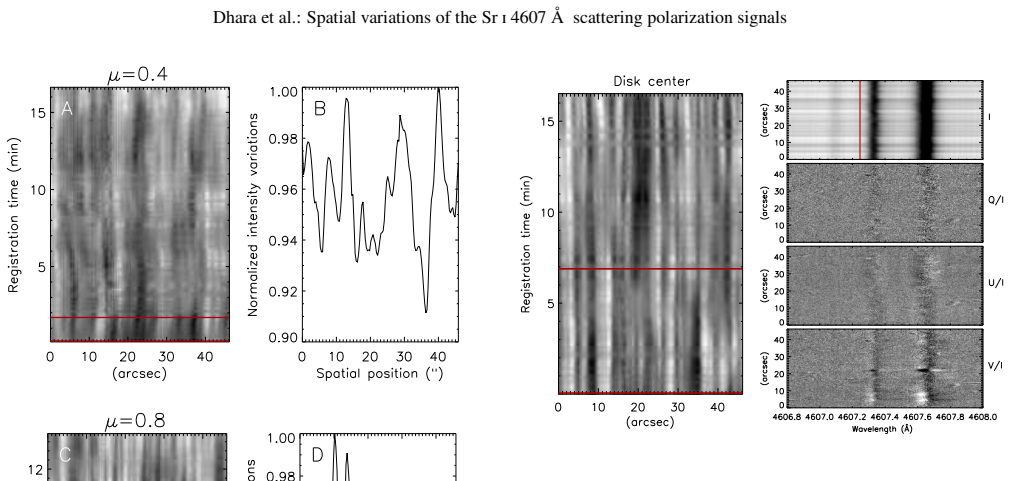
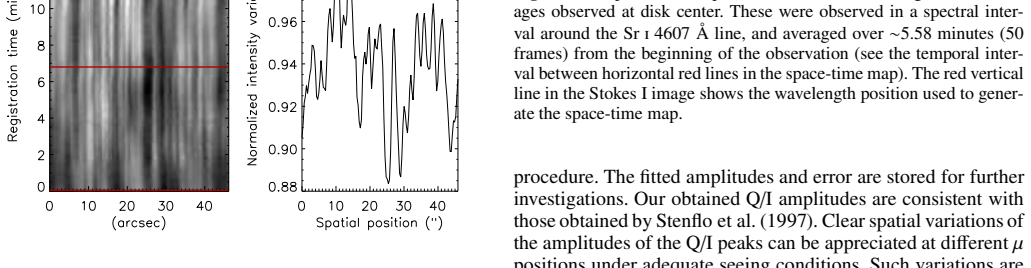
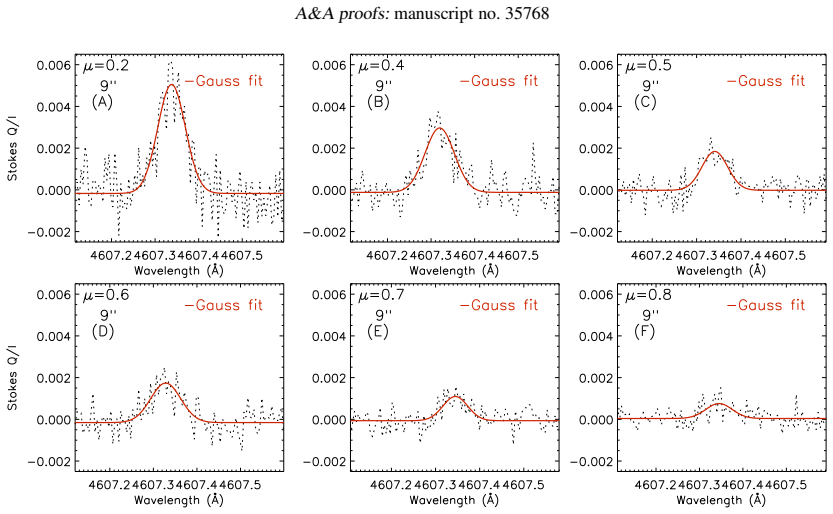
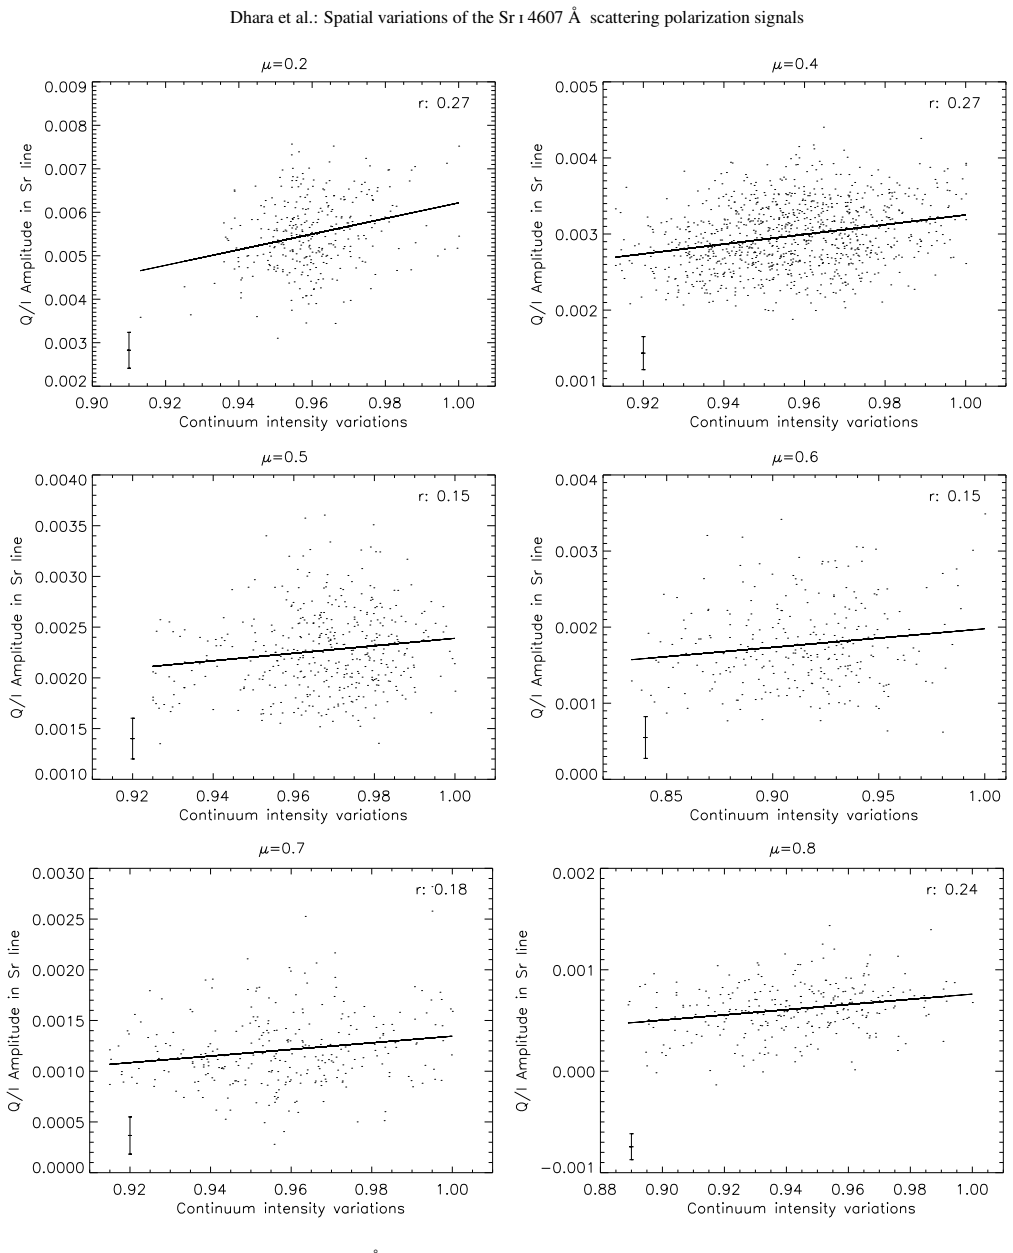
The load-bearing observable is the peak amplitude of the $Q/I$ profile of the Sr I 4607 Å line, extracted by a Gaussian fit to each of the 140 spatial positions along the spectrograph slit. The comparison quantity is the normalized continuum intensity from space-time maps formed from the Stokes $I$ frames, which marks granules as brightness maxima and intergranular lanes as minima; the relation between the two is quantified by linear regression and the Pearson correlation coefficient at each limb distance. The physical rationale is that scattering polarization in this line is modified by the Hanle effect and by local radiation-field anisotropy, so granule-to-granule changes in $Q/I$ encode fluctuations in weak magnetic fields and anisotropy. Polarimetric sensitivity is achieved by averaging selected sequences of frames after visually checking, on space-time maps, that granulation has not evolved significantly during the chosen time window.
What would settle it
Recompute the $Q/I$ peak-intensity correlation from the same data sets with a shorter averaging window or with the time series split into independent halves; if the correlation loses significance or changes sign, the reported result is not robust. A complementary check is to degrade synthetic Sr I 4607 Å $Q/I$ maps from a three-dimensional magnetoconvection model to the observed 0.66 arcsec resolution, 10 mÅ sampling, and integration times, and see whether the predicted anticorrelation converts to a positive $r$ matching the values in Table 3.
Extended reading notes
Core claim
On the paper's own terms, the central discovery is that the amplitude of the linear scattering-polarization peak of the Sr I 4607 Å line, measured from slit spectropolarimetry with roughly 0.66 arcsec spatial resolution and 10 mÅ spectral resolution, varies along the slit at every observed limb distance and is positively correlated with the continuum intensity. The Pearson correlation coefficients are positive at all $\mu$ ($r$ between 0.15 and 0.39, with most $p$-values below $10^{-3}$), and the authors take this to mean that the polarization is statistically higher in granules than in intergranular lanes. They present this as supporting earlier spectrograph results at $\mu\approx0.3$ and as standing in apparent tension with a filtergraph measurement at $\mu=0.6$ that found anticorrelation; they argue that the discrepancy is explained by their lower spatial resolution, longer integration time, and different signal-to-noise ratio.
Load-bearing premise
The result rests on the assumption that the averaged continuum-intensity profile faithfully identifies granules and intergranular lanes and that the visually chosen time windows for averaging do not smear the granulation; if seeing or the averaging selection biases the maps, the positive correlation could be an artifact of the averaging rather than a property of the Sun.
Editorial extensions
If this is right
- If the central claim is correct, the Hanle-sensitive scattering polarization is statistically stronger in granules than in intergranular lanes at all sampled limb distances, pointing to weaker average magnetic fields in granules.
- The measured correlation coefficients and slopes at eight limb distances provide a direct benchmark for three-dimensional radiative-transfer models of scattering polarization in granulation.
- Because the sign of the correlation differs from a higher-resolution observation at $\mu=0.6$, any complete interpretation must account for spatial resolution, integration time, and signal-to-noise before inferring magnetic-field properties.
- The detection shows that granular-scale scattering-polarization variations of the Sr I 4607 Å line are observable with a slit spectrograph at about 0.66 arcsec resolution, making the diagnostic accessible to current facilities.
Reading between the lines
- I infer that the positive correlation is probably a resolution- and averaging-dependent symptom: degrading a high-resolution model that predicts anticorrelation to 0.66 arcsec and multi-minute integration would likely reproduce the observed positive $r$, so the measurement may not contradict the theoretical prediction.
- A concrete test of the authors' interpretation would be to recompute the correlation from only the first and only the second half of each time series; a stable positive $r$ in both halves would argue against a seeing-driven artifact, while a flip would implicate the averaging window.
- The $\mu=0.2$ measurement is the one most exposed to contamination because a plage region was used to lock the adaptive optics; repeating at the same limb distance with a different lock target would separate granulation physics from active-region influence.
Signed reviews
Editorial analysis
A structured set of objections, weighed in public.
Referee Report
Summary. The paper reports spectropolarimetric observations of the Sr I 4607 Å scattering polarization peak using ZIMPOL at the GREGOR telescope, at eight limb distances from μ=0.2 to 0.8. The authors detect spatial variations of the Q/I peak amplitude at granular scales, with a spatial resolution around 0.66"–0.99". They then compute Pearson correlations between the Q/I peak amplitude and the temporally averaged continuum intensity along the slit, reporting positive correlation coefficients at all measured limb distances (r = 0.147–0.386; Table 3, Fig. 5). They interpret this as statistical evidence that the scattering polarization amplitude is larger in granules than in intergranular lanes, and they contrast this with the anticorrelation reported by Zeuner et al. (2018) and with the 3D radiative-transfer simulations of del Pino Alemán et al. (2018).
Significance. If the reported positive correlation were established, the paper would provide a valuable multi-μ observational characterization of small-scale scattering-polarization variations in the Sr I 4607 Å line, complementing earlier single-position detections and offering a target for Hanle-effect diagnostics. The observations are technically demanding: the paper gives a clear account of the ZIMPOL calibration, noise levels, seeing conditions, and frame selection, and it correctly notes that a low p-value only rejects the null hypothesis and does not by itself confirm a positive correlation. The work also has comparative value because it studies the same line at the same position (μ≈0.6) as Zeuner et al. (2018), making the sign discrepancy a concrete scientific question. The principal weakness is that the statistical significance analysis treats spatially and temporally correlated data as independent, and the paper's own discussion of resolution-degradation effects undermines the physical interpretation of the observed sign.
major comments (3)
- [§3.3, Table 3] The claim that the Q/I–continuum correlation is positive at every μ rests on Pearson p-values that treat the N≈280–980 points as independent. These points are not independent: the slit has 140 pixels at 0.33"/pixel with an estimated spatial resolution of 0.66"–0.99", so adjacent pixels sample the same resolution element and the same granule; the temporal windows are separated by the window width but granulation evolves on timescales comparable to or longer than the windows. The effective number of independent samples is therefore much smaller than the table's N. For example, at μ=0.6 (r=0.149, N=280), reducing N to about 50 raises the two-sided p-value from 0.012 to roughly 0.3; at μ=0.5 and μ=0.7 similar reductions make the correlations non-significant at the 5% level. The authors should estimate the effective number of independent samples from the spatial and temporal autocorrelation of the data, or use a block/mixed-model approach, and should report confidence intervals for r rather than only raw p-values computed under independence.
- [§3.1, Fig. 5] The correlation analysis is load-bearing on the assumption that the temporally averaged continuum intensity profile faithfully labels granular and intergranular positions at the same locations used for the Q/I peak amplitudes. The temporal windows are selected by visual inspection of space-time maps, and the continuum profile is averaged over 1.78–6.98 min depending on μ. This averaging smooths the granulation contrast and can misalign or bias the intensity label relative to the instantaneous Q/I structure. Because the Q/I images are averaged over the same windows, seeing degradation and granule evolution affect both quantities jointly, potentially producing or enhancing a positive correlation. The manuscript does not quantify this effect. A robustness test using shorter windows, or a comparison of the correlation computed from different subsets of frames, is needed to show that the positive sign is not an artifact of the averaging procedure.
- [§4, Abstract, §3.3] The paper's physical conclusion is in tension with its own resolution-dependence argument. The text states that del Pino Alemán et al. (2018) reproduced a positive correlation by degrading the spatial/spectral resolution and S/N of simulated observations, and it attributes the sign difference with Zeuner et al. (2018) to the lower spatial resolution and longer integration time of the present data. If that explanation is correct, then the observed positive correlation is a consequence of instrumental degradation rather than a direct measurement that "statistically, the polarization inside granular regions is higher than in the intergranular lanes." The conclusion in the abstract and §4 should either be restricted to the resolution regime of the observations, or the authors should quantitatively compare their measured correlation slope and amplitude with the resolution-degraded simulations of del Pino Alemán et al. to show that the observed positive sign reflects a solar property rather than the degradation mechanism they invoke.
minor comments (5)
- [Abstract, Table 2] The abstract quotes a spatial resolution of about 0.66", but Table 2 gives 0.66"–0.99" for several averaged frames; the abstract should reflect the full range actually achieved.
- [Fig. 4] The figure shows Q/I profiles only for a single arbitrarily chosen spatial position at each μ; it would be more informative to show a representative set of profiles with different continuum intensities and to include a plot of the Gaussian fit residuals.
- [Table 3] The p-values are labeled "approximate" but are quoted to two significant figures; the authors should state explicitly how the p-values were computed from the Pearson r and N values, and whether the same formula was used for all rows.
- [Table 1, Table 3] A "disk center" measurement appears in Table 2 but no correlation is reported for it in Table 3; the text should explain why the disk-center data were excluded from the correlation analysis.
- [§3.2] The sentence "Such variations are of solar origin and are no longer detectable when seeing conditions deteriorate give that granular regions and intergranular lanes cannot be easily distinguished" contains a typo ("give" should be "given") and should be reworded for clarity.
Circularity Check
No circularity: the Q/I–continuum correlation is a direct observational measurement with no fitted parameter or prior result feeding back into the claim.
full rationale
The paper's central claim is an observed correlation between Gaussian-fitted Sr I 4607 Å Q/I peak amplitudes and normalized continuum intensity along the spectrograph slit (Table 3, Fig. 5). The derivation chain is purely data reduction: Stokes calibration, frame averaging, Gaussian fitting to obtain Q/I amplitudes, and Pearson correlation with continuum intensity. No theoretical model, no fitted parameter, and no previously derived quantity is used as an input to produce the correlation; the continuum intensity and Q/I amplitudes are independent measurements from the same Stokes images. Cited simulations (del Pino Alemán et al. 2018) and previous observations (Malherbe et al. 2007, Bianda et al. 2018, Zeuner et al. 2018) are discussed as comparison context, not as premises of the calculation. The self-citation to Bianda et al. (2018) is not load-bearing: the new data and Table 3 stand on their own. The paper even notes that low p-values only discard the null hypothesis and cannot confirm a positive correlation, and it attributes the sign difference with Zeuner et al. (2018) to resolution and S/N differences. Those are statistical and interpretive limitations, not circularity. Concerns about spatial autocorrelation reducing effective sample size would affect significance, but they do not make the measurement equivalent to its inputs.
Assumptions & free parameters
free parameters (1)
- Number of frames averaged per temporal window =
Between 12 and 62 depending on mu (Table 2)
assumptions (3)
- domain assumption Granules remain identifiable in continuum intensity maps after temporal averaging of about 1.8 to 7 minutes.
- domain assumption Frames with poor seeing are correctly identified and discarded by visual inspection.
- domain assumption The observed Q/I spatial variations are of solar origin rather than instrumental or seeing-induced.
Cite this review
Pith. "Pith review of Observations on spatial variations of the Sr~{\sc i} 4607~\AA~scattering polarization signals at different limb distances with ZIMPOL." pith.science (2026). https://pith.science/paper/3JNR3I7T
@misc{pith2026190803366,
  author       = {Pith},
  title        = {Pith review of: Observations on spatial variations of the Sr~\sc i 4607~\AA~scattering polarization signals at different limb distances with ZIMPOL},
  year         = {2026},
  howpublished = {\url{https://pith.science/paper/3JNR3I7T}},
  note         = {Machine review of arXiv:1908.03366}
}
abstract
The Sr~{\sc i} 4607~\AA\ spectral line shows one of the strongest scattering polarization signals in the visible solar spectrum. The amplitude of this polarization signal is expected to vary at granular spatial scales, due to the combined action of the Hanle effect and the local anisotropy of the radiation field. Observing these variations would be of great interest because it would provide precious information on the small-scale activity of the solar photosphere. At present, few detections of such spatial variations have been reported. This is due to the difficulty of these measurements, which require combining high spatial ($\sim$ 0.1"), spectral ($\leq$ 20 m\AA), and temporal resolution (< 1 min) with increased polarimetric sensitivity ($\sim$ 10$^-$$^4$). Aims. We aim to detect spatial variations at granular scales of the scattering polarization peak of the Sr~{\sc i} 4607~\AA\ line at different limb distances, and to study the correlation with the continuum intensity. Methods.Using the Zurich IMaging POLarimeter (ZIMPOL) system mounted at the GREGOR telescope and spectrograph in Tenerife, Spain, we carried out spectro-polarimetric measurements to obtain the four Stokes parameters in the Sr~{\sc i} line at different limb distances, from $\mu=0.2$ to $\mu=0.8$, on the solar disk. Results.Spatial variations of the scattering polarization signal in the Sr~{\sc i} 4607~\AA\ line, with a spatial resolution of about 0.66", are clearly observed at every $\mu$. The spatial scale of these variations is comparable to the granular size. A statistical analysis reveals that the linear scattering polarization amplitude in this Sr~{\sc i} spectral line is positively correlated with the intensity in the continuum, corresponding to the granules, at every $\mu$.
Figures

Figures from the paper (3 more)

Reference graph
Works this paper leans on
-
[1]
Berkefeld, T., Schmidt, D., Soltau, D., Heidecke, F., & Fisc her, A. 2016, in Proc. SPIE, V ol. 9909, Adaptive Optics Systems V , 990924
work page 2016
-
[2]
2018, A&A, 614 , A89 del Pino Alemán, T., Trujillo Bueno, J., Št ˇepán, J., & Shchukina, N
Bianda, M., Berdyugina, S., Gisler, D., et al. 2018, A&A, 614 , A89 del Pino Alemán, T., Trujillo Bueno, J., Št ˇepán, J., & Shchukina, N. 2018, ApJ, 863, 164
work page 2018
-
[3]
Faurobert, M., Arnaud, J., Vigneau, J., & Frisch, H. 2001, A& A, 378, 627
work page 2001
- [4]
-
[5]
Feller, A., Iglesias, F. A., Nagaraju, K., Solanki, S. K., & I hle, S. 2014, in Astro- nomical Society of the Pacific Conference Series, V ol. 489, Solar Polarization 7, ed. K. N. Nagendra, J. O. Stenflo, Q. Qu, & M. Samooprna, 271
work page 2014
-
[6]
Gandorfer, A. 2002, The Second Solar Spectrum: A high spectr al resolution po- larimetric survey of scattering polarization at the solar l imb in graphical rep- resentation. V olume II: 3910 Å to 4630 Å
work page 2002
- [7]
-
[8]
2012, Astronomi sche Nachrichten, 333, 854
Hofmann, A., Arlt, K., Balthasar, H., et al. 2012, Astronomi sche Nachrichten, 333, 854
work page 2012
Show all 14 references
-
[9]
2007, A &A, 462, 753
Malherbe, J.-M., Moity, J., Arnaud, J., & Roudier, T. 2007, A &A, 462, 753
2007
-
[10]
2010, in Proc
Ramelli, R., Balemi, S., Bianda, M., et al. 2010, in Proc. SPI E, V ol. 7735, Ground-based and Airborne Instrumentation for Astronomy I II, 77351Y
2010
-
[11]
2014, in Proc
Ramelli, R., Gisler, D., Bianda, M., et al. 2014, in Proc. SPIE, V ol. 9147, Ground- based and Airborne Instrumentation for Astronomy V , 91473G
2014
-
[12]
2012, in Ast ronomical Soci- ety of the Pacific Conference Series, V ol
Schmidt, W., von der Lühe, O., V olkmer, R., et al. 2012, in Ast ronomical Soci- ety of the Pacific Conference Series, V ol. 463, Second A TST-EAST Meeting: Magnetic Fields from the Photosphere to the Corona., ed. T. R . Rimmele, A. Tritschler, F. Wöger, M. Collados V era, H. S...
2012
-
[13]
1981, in Solar instrumentation: What’s next?, ed
Soltau, D. 1981, in Solar instrumentation: What’s next?, ed . R. B. Dunn, 600 Stenflo, J. O., Bianda, M., Keller, C. U., & Solanki, S. K. 1997 , A&A, 322, 985 Trujillo Bueno, J. & Shchukina, N. 2007, ApJ, 664, L135 Trujillo Bueno, J., Shchukina, N., & Asensio Ramos, A. 2004, Na...
1981
-
[14]
A., & Solanki, S
Zeuner, F., Feller, A., Iglesias, F. A., & Solanki, S. K. 2018 , A&A, 619, A179 Article number, page 8 of 8
2018
Reviewed August 14, 2026 · model on record in the stance chip above.
Discussion (0). Continue with ORCID to comment.