REVIEW 3 major objections 4 minor 19 references
Long-term gamma-ray observations of the binary HESS J0632+057 with H.E.S.S., MAGIC and VERITAS
T0 review · 3 major / 4 minor · reviewed 2026-08-14 · deepseek-v4-flash
Pith's one-line read The paper uses 440 hours of very-high-energy observations from H.E.S.S., MAGIC, and VERITAS to derive a gamma-ray orbital period for HESS J0632+057 that matches the X-ray period, and shows the phase-folded TeV light curve now spans every…
desk verdict A credible, genuinely new TeV-period claim in a preliminary proceedings paper, held back only by unquantified cross-instrument calibration and deferred analysis. read the letter →
The pith
A machine-rendered reading of the paper's core claim, the machinery that carries it, and where it could break.
The reading
What carries the argument
The load-bearing object is the interleaved >350 GeV gamma-ray light curve assembled from 440 hours of H.E.S.S., MAGIC, and VERITAS observations spanning 2004-2019. The argument turns on folding this light curve on the orbital period and comparing it with the contemporaneous Swift XRT light curve. Two period-search statistics are used: the phase dispersion minimization (which measures how much flux varies within phase bins) and the Pearson correlation coefficient (which measures how well the folded light curve reproduces the original time series); uncertainties are estimated from 10,000 Monte Carlo realizations of the phase-binned profile. The physical model in view is that the same population of accelerated electrons produces X-rays through synchrotron radiation and TeV gamma rays through inverse-Compton scattering of the massive star's photon field, which is why agreement between the X-ray and gamma-ray periods and light-curve shapes is taken as evidence for a common emission region.
What would settle it
Fold the gamma-ray light curve on the gamma-ray-only period of 318.7 days and the X-ray light curve on the X-ray period of 317.3 days; if the sharp TeV minimum no longer aligns in phase with the X-ray minimum, the two bands would not share a single orbital clock.
Extended reading notes
Core claim
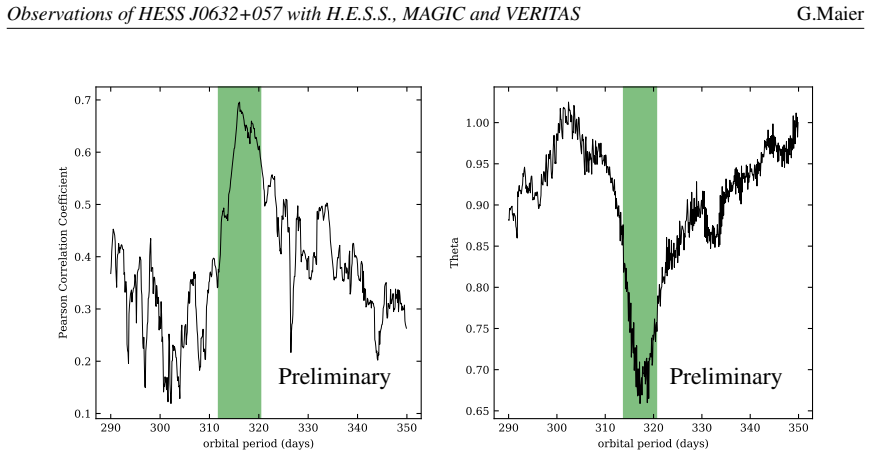
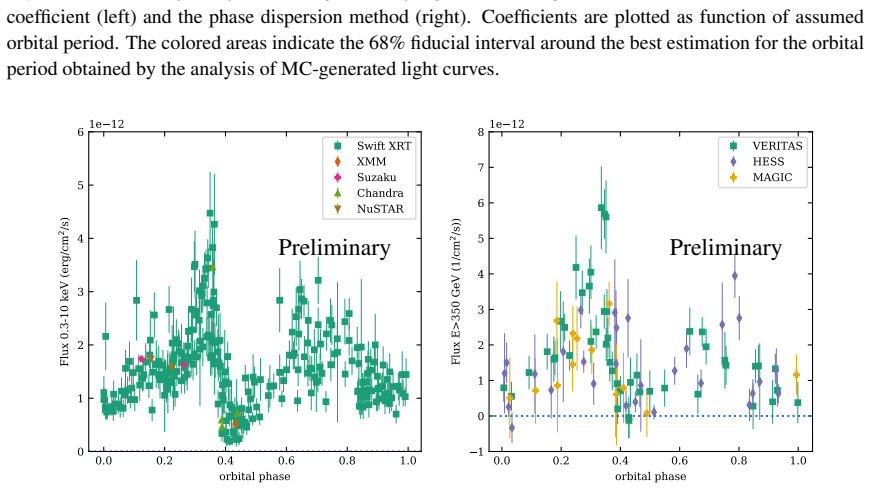
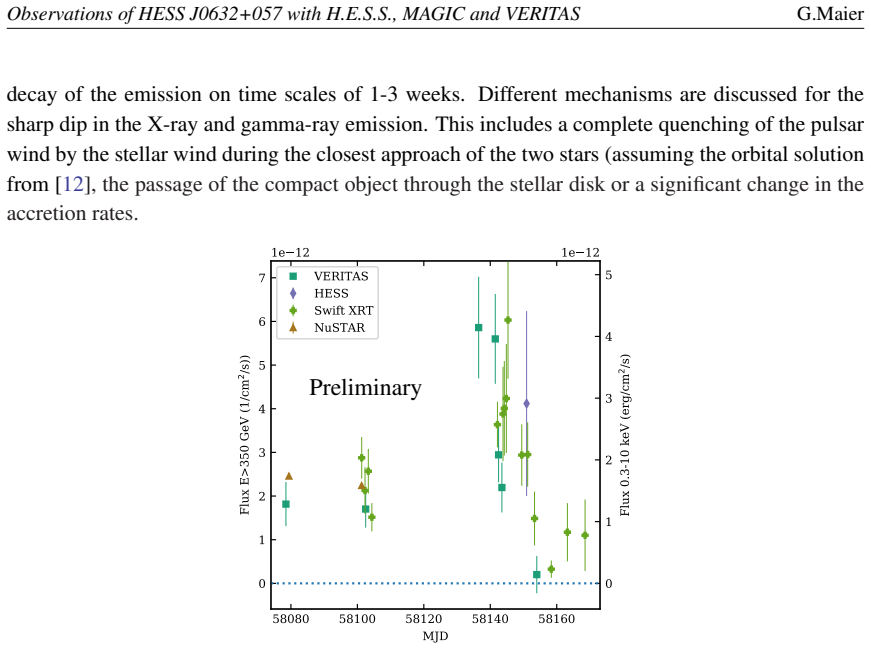
The central result is that, for the first time, the orbital period of HESS J0632+057 is measured directly from gamma-ray data. Applying the phase-dispersion-minimization method gives $318.7 \pm 3.4$ days, and a Pearson-correlation-coefficient method gives $316.3 \pm 4.3$ days; both are consistent with the X-ray period of $317.3 \pm 0.7$ days. Folding the >350 GeV light curve on the X-ray period shows that the source is detected at nearly all orbital phases, with a broad double-peaked modulation and a pronounced minimum around phases 0.4-0.5. The same shape is seen in the 0.3-10 keV X-ray light curve from Swift XRT and other X-ray observatories, confirming and strengthening the previously reported X-ray/gamma-ray correlation. The paper also reports the brightest TeV outburst ever seen from the source, in January 2018, when VERITAS and H.E.S.S. measured a flux of $(5.9 \pm 0.8) \times 10^{-13}\, \mathrm{photons\, cm^{-2}\, s^{-1}}$ above 350 GeV, about twice the typical flux at that phase, accompanied by a strong X-ray flare and followed by a decline over a few days.
Load-bearing premise
The combined light curve assumes that the three Cherenkov arrays measure the same >350 GeV flux from the source and can be interleaved without a time-dependent cross-calibration correction; the paper gives no quantitative check of the size of such a systematic offset.
Editorial extensions
If this is right
- A single 317-day clock now accounts for both the X-ray and TeV light curves, so any model of HESS J0632+057 must predict phase-resolved emission in both bands with the same period and aligned minima and maxima.
- The full-phase gamma-ray coverage provides new constraints on the orbital geometry, the stellar wind, and the location of the acceleration region; the sharp TeV/X-ray dip between phases roughly 0.4 and 0.5 becomes a quantitative target for models such as wind quenching or passage through the Be star's disk.
- The January 2018 outburst, reaching about 6% of the Crab Nebula flux above 350 GeV, shows that the source can flare to roughly twice its typical level at that orbital phase, so contemporaneous X-ray and TeV flares of this type should be treated as part of the system's ordinary phase-dependent behavior rather than as isolated anomalies.
- The consistency of gamma-ray and X-ray periods means that future observations can be scheduled around the orbital ephemeris, and the gamma-ray period itself can be used to refine the ephemeris as more data accumulate.
Reading between the lines
- If the common-clock interpretation is right, a testable extension is that future bright flares---like January 2018---should recur near the same orbital phase in subsequent cycles, and a campaign designed to catch that phase with X-ray and TeV instruments could discriminate between flare mechanisms.
- The same cross-instrument light-curve method could be applied to other gamma-ray binaries with long periods (for example LS I +61 303 or 1FGL J1018.6-5856), where combining historical IACT data might also yield a gamma-ray-only orbital period.
- The paper intentionally leaves the choice between two conflicting optical orbital solutions open; with the new phase-resolved TeV light curve, a natural next step is to test which solution places the flux minimum at periastron or at disk passage.
- Since the gamma-ray period uncertainty (about 3-4 days) is larger than the X-ray one (0.7 days), the phase-folding here adopts the X-ray ephemeris; a pure gamma-ray ephemeris test---folding both bands on the gamma-ray period---would check whether the dip alignment remains sharp.
Signed reviews
Editorial analysis
A structured set of objections, weighed in public.
Referee Report
Summary. This ICRC2019 proceedings paper reports on ~440 hours of very-high-energy observations of the gamma-ray binary HESS J0632+057 with H.E.S.S., MAGIC, and VERITAS over 2004-2019. It presents a combined >350 GeV light curve, derives the orbital period from gamma-ray data alone (318.7 ± 3.4 days by the phase dispersion method; 316.3 ± 4.3 days by a Pearson correlation coefficient method), and finds consistency with the X-ray period of 317.3 ± 0.7 days. The phase-folded gamma-ray light curve now covers all orbital phases, and the paper reports the unusually bright January 2018 outburst detected at >10σ with a flux of about 6% of the Crab Nebula flux above 350 GeV. The X-ray and gamma-ray variability patterns are compared, and the results are interpreted as supporting a common origin of the X-ray and TeV emission. Several analysis details and the full interpretation are deferred to an upcoming publication.
Significance. If the central claim holds, this is a valuable result: it would be the first gamma-ray-only orbital period measurement for HESS J0632+057, confirming a common orbital clock for the X-ray and TeV emission, and the full-phase, multi-instrument light curve provides a useful baseline for modeling particle acceleration in gamma-ray binaries. The paper's strengths include the large combined data volume, the >10σ outburst detection, the use of two standard period-search methods, and the transparent statement that many details are preliminary and will appear in a longer publication. However, the significance is currently limited by the absence of quantified cross-instrument calibration checks, which directly affects the shape of the phase-folded light curve and the reliability of the period-search uncertainties.
major comments (3)
- [§2, Table 1; §3, Figs. 1 and 3] The combined >350 GeV light curve interleaves fluxes from H.E.S.S., MAGIC, and VERITAS, but Table 1 shows a wide spread in energy thresholds and observation modes (e.g., VERITAS V6 red HV at 420-630 GeV, H.E.S.S. CT5 mono at 60-420 GeV, MAGIC at 147-251 GeV). No quantitative cross-calibration systematic is quoted, and no internal consistency test among the three instruments is presented. A constant per-instrument flux offset of even 20-30% could distort the phase-binned profile, shift the PDM/PCC minima, or broaden the period uncertainty beyond the quoted values. This is load-bearing for the central period claim, so the authors should provide cross-instrument consistency checks or explicitly propagate relative calibration systematics into the period uncertainty.
- [§3, Fig. 2 and footnote 2] The periodicity analysis is less independent of the X-ray period than stated. The period uncertainties are derived from 10,000 Monte Carlo light curves based on the phase-binned average profiles of the gamma-ray data, and footnote 2 states that an orbital period of 317.3 days is assumed throughout the paper. If the MC templates are generated using the X-ray ephemeris, then the quoted gamma-ray period uncertainties may underestimate the true uncertainty and the claimed independence from the X-ray period is not fully established. The authors should specify whether the MC light curves use the best-fit gamma-ray period or the X-ray period and discuss any resulting bias.
- [§3, Figs. 1-4; Conclusions] The manuscript repeatedly labels results as 'Preliminary' and refers to an upcoming publication for the detailed discussion of observations and interpretation. As a standalone submission, it does not provide enough detail to reproduce or fully audit the analysis: spectral reconstruction choices, likelihood treatment, the definition of 'significant detections' in each phase bin, and the handling of upper limits are not specified. At minimum, the cross-calibration method, the period-search implementation, and the Monte Carlo uncertainty procedure need to be described with enough specificity for the central claims to be checked.
minor comments (4)
- [§3, first paragraph] The text says the light curve is 'shown in Figure3'; this should be 'Figure 1'.
- [Table 1] The table notes that the energy threshold definition varies between observatories, but the comparison of >350 GeV fluxes also depends on the spectral index assumed in the flux extraction; this assumption should be stated here or explicitly deferred to the upcoming publication.
- [Fig. 2] The right panel's y-axis label 'Theta' is undefined in the caption, and the meaning of the shaded 68% fiducial interval would benefit from a one-sentence description of how it is constructed from the Monte Carlo light curves.
- [§3, phase 0.4-0.5 discussion] The phrase 'possibly a complete dampening of the emission' is stronger than what the plotted data show unless the points in that phase range are true flux upper limits; please clarify whether those points are detections or limits and label them accordingly in Fig. 3.
Circularity Check
No significant circularity: the gamma-ray orbital period is measured directly from gamma-ray data with standard periodicity searches, not derived from the X-ray period it is compared with.
full rationale
The paper's central quantitative claim is that the orbital period obtained from gamma-ray data alone, 318.7 ± 3.4 days (PDM) and 316.3 ± 4.3 days (PCC), is consistent with the previously measured X-ray period of 317.3 ± 0.7 days. That comparison is not circular: the gamma-ray period is found by scanning trial periods in Figure 2 with the phase-dispersion method and a Pearson-correlation-coefficient method applied to the gamma-ray light curve, not by fitting to the X-ray period. The fixed 317.3-day ephemeris is used only for the phase-folded display light curves in Figure 3, as explicitly stated in the footnote, and the period search itself does not take that value as an input. The Monte Carlo uncertainty estimates are generated from phase-binned average profiles of the gamma-ray data; this is a standard resampling procedure used to assign a statistical uncertainty, not a mechanism that defines the best-fit period. The comparison of X-ray and gamma-ray phase-folded light curves also uses the same assumed period, so any morphological similarity is not evidence of period equality, but the paper does not claim that the phase-folded correlation is the basis for the period determination. The use of reference [17], which shares authors with this paper, is limited to the description of the PCC method and the earlier X-ray period analysis; it is not invoked as a uniqueness theorem or as the sole justification for the central result. The cross-instrument flux interleaving without a quantitative cross-calibration is a legitimate systematic concern, but it is a potential bias in the measured light-curve shape and period uncertainties, not a circular reduction of the result to its inputs. No fitted parameter is renamed as a prediction, and no derivation step is equivalent to its inputs by construction.
Assumptions & free parameters
assumptions (3)
- domain assumption The published X-ray orbital ephemeris (P=317.3 days, MJD0=54857.0) from Bongiorno et al. (2011) is correct and is used to fold all data into orbital phase.
- domain assumption The gamma-ray fluxes above 350 GeV from H.E.S.S., MAGIC, and VERITAS are directly comparable; the instruments' effective areas and energy scales are sufficiently well known that no cross-calibration correction is applied.
- standard math The phase dispersion method and Pearson correlation coefficient method are standard, valid periodicity statistics when applied to unevenly sampled light curves.
Cite this review
Pith. "Pith review of Long-term gamma-ray observations of the binary HESS J0632+057 with H.E.S.S., MAGIC and VERITAS." pith.science (2026). https://pith.science/paper/WKBIDGGR
@misc{pith2026190803589,
  author       = {Pith},
  title        = {Pith review of: Long-term gamma-ray observations of the binary HESS J0632+057 with H.E.S.S., MAGIC and VERITAS},
  year         = {2026},
  howpublished = {\url{https://pith.science/paper/WKBIDGGR}},
  note         = {Machine review of arXiv:1908.03589}
}
abstract
The gamma-ray binary HESS J0632+057 has been observed at very-high energies (E $>$ 100 GeV) for more than ten years by the major systems of imaging atmospheric Cherenkov telescopes. We present a summary of results obtained with the H.E.S.S., MAGIC, and VERITAS experiments based on roughly 440 h of observations in total. This includes a discussion of an unusually bright TeV outburst of HESS J0632+057 in January 2018. The updated gamma-ray light curve now covers all phases of the orbital period with significant detections in almost all orbital phases. Results are discussed in context with simultaneous observations with the X-ray Telescope onboard the Neil Gehrels Swift Observatory.
Figures

Figures from the paper (1 more)
Reference graph
Works this paper leans on
- [1]
- [2]
-
[3]
1998, Nature, 908 392, 673 6 Observations of HESS J0632+057 with H.E.S.S., MAGIC and VERITAS G.Maier
Mirabel, I.F., & Rodriguez, L.F. 1998, Nature, 908 392, 673 6 Observations of HESS J0632+057 with H.E.S.S., MAGIC and VERITAS G.Maier
work page 1998
- [4]
-
[5]
Aragona, C., McSwain, M. V ., & De Becker, M. 2010, ApJ, 724, 306
work page 2010
-
[6]
Bongiorno, S. D., Falcone, A. D., Stroh, M., et al. 2011, ApJ, 737, L11
work page 2011
-
[7]
Aliu, E. et al. (VERITAS & H.E.S.S. Collaborations) 2014, ApJ, 780, 168
work page 2014
-
[8]
Casares, J., Ribo, M., Ribas, I., et al. 2012, MNRAS, 421, 1103
work page 2012
Show all 19 references
-
[9]
C., Badran, H., Biller, S
Weekes, T. C., Badran, H., Biller, S. D.,et al. 2002, Astroparticle Physics, 17, 221
2002
-
[10]
2017, International Cosmic Ray Conference, 35, 1116
Park, N. 2017, International Cosmic Ray Conference, 35, 1116
2017
-
[11]
D., & Hinton, J
Parsons, R. D., & Hinton, J. A. 2014, Astroparticle Physics, 56, 26
2014
-
[12]
2018, Publications of the Astronomical Society of Japan, 70, 61
Moritani, Y ., Kawano, T., Chimasu, S., et al. 2018, Publications of the Astronomical Society of Japan, 70, 61
2018
-
[13]
A., et al
Aleksi ´c, J., Ansoldi, S., Antonelli, L. A., et al. 2016, Astroparticle Physics, 72, 76
2016
-
[14]
et al (VERITAS collaboration) 2009, ApJ 498, L94
Acciari, V .A. et al (VERITAS collaboration) 2009, ApJ 498, L94
2009
-
[15]
F., Cheng, K.-S., et al
Li, J., Torres, D. F., Cheng, K.-S., et al. 2017, ApJ, 846, 169
2017
-
[16]
Stellingwerf, R. F. 1978, ApJ, 224, 953
1978
-
[17]
2017, arXiv e-prints, arXiv:1711.05001
Malyshev, D., Chernyakova, M., Santangelo, A., & Pühlhofer, G. 2017, arXiv e-prints, arXiv:1711.05001
2017 arXiv
-
[18]
A., & the HESS Collaboration
Hinton, J. A., & the HESS Collaboration. 2004, New A Rev., 48, 331
2004
-
[19]
2018, The Astronomer’s Telegram, 11223 7
Mukherjee, R. 2018, The Astronomer’s Telegram, 11223 7
2018
Reviewed August 14, 2026 · model on record in the stance chip above.
Discussion (0). Continue with ORCID to comment.