REVIEW 1 major objections 5 minor 15 references
Constraining the geometry and kinematics of the quasar broad emission line region using gravitational microlensing. II. Comparing models with observations in the lensed quasar HE0435-1223
T0 review · 1 major / 5 minor · reviewed 2026-08-14 · deepseek-v4-flash
Pith's one-line read Gravitational microlensing of the lensed quasar HE0435-1223 favors a flattened, disk-like broad emission line region over a biconical polar wind.
desk verdict Solid application of the Paper I microlensing framework to HE0435-1223; the flattened-geometry conclusion holds up, but the continuum-size argument overreaches the simulated grid. read the letter →
The pith
A machine-rendered reading of the paper's core claim, the machinery that carries it, and where it could break.
The reading
What carries the argument
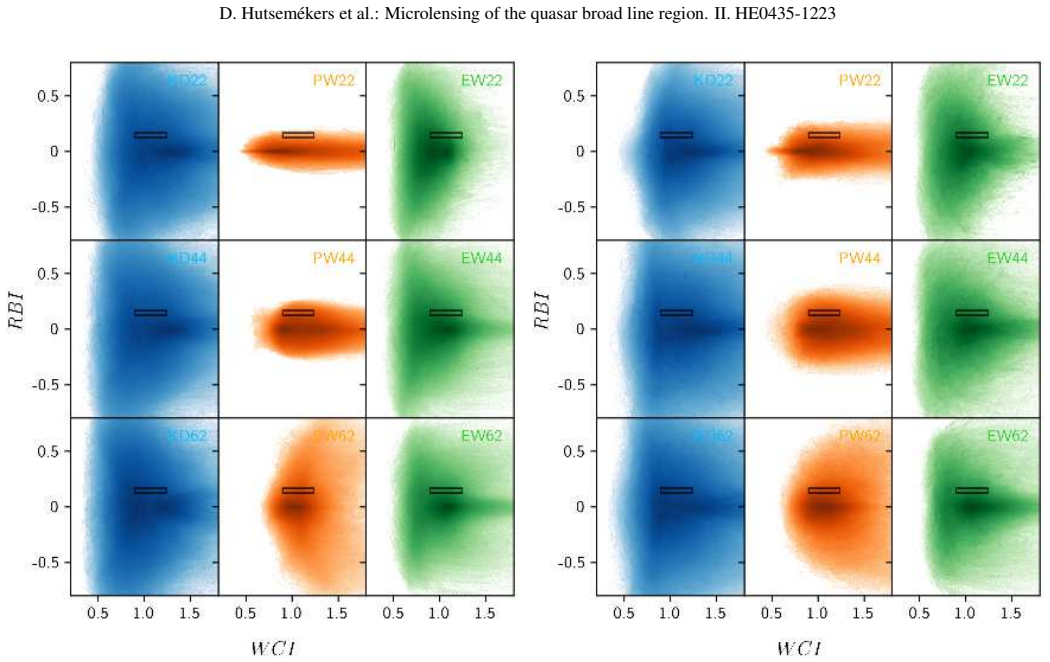
The argument is carried by four microlensing observables defined in the companion Paper I: the continuum magnification $\mu_\mathrm{cont}$, the total line magnification $\mu_\mathrm{BLR}$, the red/blue index $\mathrm{RBI}$ that measures asymmetric red versus blue deformation of the line profile, and the wings/core index $\mathrm{WCI}$ that compares line-wing to line-core magnification. Simulated line profiles are generated by convolving monochromatic images of each BLR model (Keplerian disk, polar wind, equatorial wind, with varying inclination, inner radius, emissivity index, and continuum disk size) with microlensing magnification maps produced with a ray-shooting code tuned to the macro-model parameters of image D. The $(\mathrm{WCI}, \mathrm{RBI})$ diagnostic diagrams and the marginalised likelihood ratio $P(G,i\,|\,d)$ then rank how easily each geometry reproduces the four observed values.
What would settle it
Multi-epoch monitoring of image B that reveals microlensing variability comparable to image D would falsify the reference-spectrum assumption and invalidate the model ranking, as would an independent reverberation-mapping measurement of the H$\alpha$ BLR size in HE0435-1223 that is incompatible with the favored Keplerian disk configuration.
Extended reading notes
Core claim
The observed microlensing-induced amplification and distortion of the H$\alpha$ line in image D of HE0435-1223, quantified by the continuum magnification $\mu_\mathrm{cont} = 1.68 \pm 0.10$, the line magnification $\mu_\mathrm{BLR} = 1.30 \pm 0.17$, the red/blue asymmetry index $\mathrm{RBI} = 0.15 \pm 0.02$, and the wings/core index $\mathrm{WCI} = 1.09 \pm 0.17$, can be reproduced by convolving BLR emission models with a caustic network magnification map. Comparing the relative likelihoods of the models, the paper concludes that flattened geometries (Keplerian disk and equatorial wind) more easily reproduce the observed line profile deformations than a biconical polar wind, with no strong preferred inclination. Adding the independent constraint that the continuum source radius $r_s \geq 0.6\,r_E$, derived from published accretion-disk size estimates at the H$\alpha$ wavelength, slightly reinforces the Keplerian disk as the model that most easily matches the four observed indices. The authors stress that the single-epoch microlensing signal does not allow unambiguous discrimination, so the result is a comparative likelihood ranking among the models rather than a unique determination.
Load-bearing premise
The entire measurement chain assumes that image B of HE0435-1223 is free of microlensing and that the D/B macro-magnification ratio is $M = 0.47 \pm 0.03$; if image B is itself microlensed or $M$ is in error, all four observed indices would be biased and the model comparison would no longer be valid.
Editorial extensions
If this is right
- If flattened geometries are correct, the H$\alpha$-emitting gas in HE0435-1223 is more likely orbiting in a disk (Keplerian or equatorial wind) than flowing in a biconical polar outflow.
- Multi-epoch spectroscopy of the microlensing signal should further discriminate the BLR models, because different geometries sample the caustic pattern differently as the source moves across the magnification map.
- Simultaneously modelling the microlensing distortions of several emission lines, such as C IV and H$\alpha$ in the Einstein Cross, would produce stronger constraints on the BLR geometry and kinematics.
- With the additional continuum-size constraint, the Keplerian disk is the single most favored model, implying rotation-dominated kinematics is marginally preferred over a radially accelerated equatorial wind.
Reading between the lines
- If the same four-index comparison is applied to other lensed quasars, it could build a statistical sample of BLR geometries and reveal whether the disk-versus-wind dichotomy depends on quasar luminosity or redshift.
- A sharper measurement of the H$\alpha$ continuum-emitting region's size could turn the slight preference for a Keplerian disk into a robust discrimination, because the $r_s \geq 0.6\,r_E$ cut is what produces the preference.
- The paper marginalises over the orientation of the caustic network relative to the BLR symmetry axis, so a joint fit that keeps orientation as a free parameter and uses multi-epoch data could also recover the disk's position angle.
- The smooth, axisymmetric emissivity laws assumed for the BLR may miss clumpy or spiral structure, which could mimic or mask microlensing distortions in the observed indices.
Signed reviews
Editorial analysis
A structured set of objections, weighed in public.
Referee Report
Summary. The paper analyzes microlensing-induced distortions of the Halpha line in image D of the quadruply lensed quasar HE0435-1223. It measures four observables defined in Paper I: the continuum magnification mu_cont, the line magnification mu_BLR, the red-blue asymmetry index RBI, and the wings-to-core index WCI, using image B as a non-microlensed reference and a macro-magnification ratio M = 0.47 +/- 0.03. These measurements are compared with simulations of three representative BLR geometries (Keplerian disk KD, polar wind PW, and equatorial wind EW) convolved with a microlensing magnification map appropriate to image D. The paper concludes that flattened geometries (KD and EW) reproduce the observed (WCI, RBI) and magnification constraints more easily than the biconical polar wind, and that adding a literature-based constraint on the continuum source size slightly favors the Keplerian disk.
Significance. If the comparison is valid, this is a useful step toward using single-epoch microlensing line-profile distortions to constrain BLR geometry and kinematics. The paper is transparent: the simulation grid, the index definitions, and the likelihood normalization are clearly described, and the diagnostic (WCI, RBI) diagrams make the comparison easy to interpret. The qualitative conclusion that flattened geometries out-produce the polar wind appears reasonably supported by the simulations. However, the strongest quantitative claim in the abstract and Section 3.3, that an independent continuum-size constraint favors the Keplerian disk, is currently not established because the simulations do not cover the full range of source sizes allowed by that constraint.
major comments (1)
- [Section 3.3 and Table 1] The 'additional independent constraint' on the continuum source size is implemented only as a lower-bound cut (rs >= 0.6 rE), but the independent size estimates quoted in Section 3.3 translate to rs ~ 0.7-4 rE. The simulation grid in Section 3 only goes up to rs = 0.7 rE, and hence rin <= 0.75 rE, so no simulated model explores the upper range of the independent constraint. The conclusion that the Keplerian disk model is 'slightly favored' is therefore not established over the full domain allowed by the independent measurement; it may be an artifact of the truncated grid. I ask the authors to extend the simulations to larger rs values (up to about 4 rE) and recompute Table 1, or alternatively to show quantitatively that the upper range is incompatible with the observed mu_cont and can be excluded.
minor comments (5)
- [Section 3.2] The word 'Nervertheless' after Eq. (8) should be 'Nevertheless'.
- [Appendix A] The statement that low-inclination PW models 'can generate a small number of unrealistic simulations' should specify whether those simulations are excluded from the probability counts in Table 1; if they are retained, a brief justification is needed because their inclusion could bias the comparison against the polar wind.
- [Section 3.3] The conversion R1/2(Halpha) = R1/2(UV) * (lambda_Halpha/lambda_UV)^p with an assumed p = 4/3 when p was not measured introduces an additional systematic uncertainty in the independent size constraint that is not propagated into the final comparison.
- [Section 2 and Eq. (6)] The errors on mu_BLR, RBI, and WCI are propagated from the same flux-density uncertainties, so the four observables are likely correlated; reporting the covariance matrix or at least acknowledging this correlation in the Gaussian likelihood of Eq. (6) would strengthen the statistical interpretation.
- [Eq. (7)] The summation over microlensing parameters is written as a sum over 'n' without an explicit index; using a notation such as sum_eta or defining eta_n would remove the ambiguity.
Circularity Check
No significant circularity: the observed microlensing indices are compared to a pre-computed simulation grid, with no parameter fitted to force the conclusion.
full rationale
The derivation chain is self-contained against external observations. The four observables (µcont, µBLR, RBI, WCI) are measured from HE0435-1223 spectra (Sect. 2) and compared with a pre-existing grid of microlensed BLR simulations from Paper I (Sect. 3). No model parameter is fitted to the observed indices; the posterior probabilities are likelihood comparisons with shared priors (Eqs. 5–8), and the quoted errors are propagated from spectral uncertainties. The only self-citations are to Paper I for the simulation framework and to Braibant et al. (2014) for the macro-magnification ratio M and the identification of image D as microlensed. These supply methods or prior measurements, not the target conclusion, and the Paper I simulations are parameter-free grids not tuned to HE0435-1223. The 'additional independent constraint' on continuum source size comes from external literature estimates and is applied as a restriction rs ≥ 0.6 rE; the paper's use of that constraint is incomplete because the simulation grid extends only to rs = 0.7 rE while the quoted estimates reach 4 rE, but that is a correctness risk, not a definitional equivalence or a fitted-input prediction. The paper explicitly concedes that the single-epoch constraints are not robust and that models cannot be unambiguously discriminated. No prediction in the paper reduces by construction to its inputs, so the circularity score is 0.
Assumptions & free parameters
free parameters (6)
- BLR inner radius rin
- BLR outer radius rout =
10 rin
- Emissivity index q =
1.5 or 3
- Continuum source radius rs
- Inclination i
- Microlensing source position and map rotation
assumptions (5)
- domain assumption The three BLR models (Keplerian disk, polar wind, equatorial wind) with emissivity laws q = 1.5 and 3 are representative of real BLRs.
- domain assumption Image B is unaffected by microlensing and the macro-magnification ratio M = 0.47 ± 0.03 is correct.
- domain assumption The macro-model parameters for image D (kappa_s = 0.124, kappa_c = 0.466, gamma = 0.640) and the computed caustic map are accurate.
- domain assumption The continuum source is a uniform disk with the same inclination as the BLR and radius rs.
- ad hoc to paper The independent continuum size estimates (R1/2 ~ 6-30 light days) map to rs >= 0.6 rE.
Cite this review
Pith. "Pith review of Constraining the geometry and kinematics of the quasar broad emission line region using gravitational microlensing. II. Comparing models with observations in the lensed quasar HE0435-1223." pith.science (2026). https://pith.science/paper/YBWZDM6Q
@misc{pith2026190804178,
  author       = {Pith},
  title        = {Pith review of: Constraining the geometry and kinematics of the quasar broad emission line region using gravitational microlensing. II. Comparing models with observations in the lensed quasar HE0435-1223},
  year         = {2026},
  howpublished = {\url{https://pith.science/paper/YBWZDM6Q}},
  note         = {Machine review of arXiv:1908.04178}
}
abstract
The quadruply lensed quasar HE0435-1223 shows a clear microlensing effect that affects differently the blue and red wings of the H$\alpha$ line profile in its image D. To interpret these observations, and constrain the broad emission line region (BLR) properties, the effect of gravitational microlensing on quasar broad emission line profiles and their underlying continuum has been simulated considering representative BLR models and microlensing magnification maps. The amplification and distortion of the H$\alpha$ line profile, characterized by a set of four indices, can be reproduced by the simulations. Although the constraints on the BLR models set by the observed single-epoch microlensing signal are not very robust, we found that flattened geometries (Keplerian disk and equatorial wind) can more easily reproduce the observed line profile deformations than a biconical polar wind. With an additional independent constraint on the size of the continuum source, the Keplerian disk model of the H$\alpha$ BLR is slightly favored.
Figures

Reference graph
Works this paper leans on
-
[1]
Blackburne, J. A., Kochanek, C. S., Chen, B., Dai, X., & Chart as, G. 2014, ApJ, 789, 125
work page 2014
-
[2]
A., Pooley, D., Rappaport, S., & Schechter, P
Blackburne, J. A., Pooley, D., Rappaport, S., & Schechter, P . L. 2011, ApJ, 729, 34
2011
-
[3]
Braibant, L. 2018, Probing the Broad Emission Line Region of Quasars using Gravitational Microlensing, PhD Thesis, University of Liège (http://hdl.handle.net/2268/221427) Article number, page 4 of 7 D. Hutsemékers et al.: Microlensing of the quasar broad line region. II. HE0435-1223
work page 2018
-
[4]
Braibant, L., Hutsemékers, D., Sluse, D., & Anguita, T. 2016 , A&A, 592, A23
work page 2016
-
[5]
Braibant, L., Hutsemékers, D., Sluse, D., Anguita, T., & Gar cía-V ergara, C. J. 2014, A&A, 565, L11
work page 2014
-
[6]
2017, A&A, 607, A32
Braibant, L., Hutsemékers, D., Sluse, D., & Goosmann, R. 2017, A&A, 607, A32
2017
-
[7]
Fian, C., Mediavilla, E., Jiménez-Vicente, J., Muñoz, J. A. , & Hanslmeier, A. 2018, ApJ, 869, 132
work page 2018
-
[8]
20 13, ApJ, 764, 160 Jiménez-Vicente, J., Mediavilla, E., Kochanek, C
Guerras, E., Mediavilla, E., Jimenez-Vicente, J., et al. 20 13, ApJ, 764, 160 Jiménez-Vicente, J., Mediavilla, E., Kochanek, C. S., & Muñoz, J. A. 2015, ApJ, 799, 149 Jiménez-Vicente, J., Mediavilla, E., Kochanek, C. S., et al . 2014, ApJ, 783, 47
work page 2015
Show all 15 references
-
[9]
M., Muñoz, J
Mosquera, A. M., Muñoz, J. A., Mediavilla, E., & Kochanek, C. S. 2011, ApJ, 728, 145
2011
-
[10]
2017, ApJ, 835, 1 32 O’Dowd, M., Bate, N
Motta, V ., Mediavilla, E., Rojas, K., et al. 2017, ApJ, 835, 1 32 O’Dowd, M., Bate, N. F., Webster, R. L., Wayth, R., & Labrie, K. 2011, MNRAS, 415, 1985
2017
-
[11]
T., Keeton, C
Richards, G. T., Keeton, C. R., Pindor, B., et al. 2004, ApJ, 6 10, 679
2004
-
[12]
2012, A&A, 544, A62
Sluse, D., Hutsemékers, D., Courbin, F., Meylan, G., & Wambs ganss, J. 2012, A&A, 544, A62
2012
-
[13]
2011, A&A, 528, A1 00
Sluse, D., Schmidt, R., Courbin, F., et al. 2011, A&A, 528, A1 00
2011
-
[14]
1999, Journal of Computational and Applied M athematics, 109, 353
Wambsganss, J. 1999, Journal of Computational and Applied M athematics, 109, 353
1999
-
[15]
B., O’Dowd, M., & Webster, R
Wayth, R. B., O’Dowd, M., & Webster, R. L. 2005, MNRAS, 359, 56 1 Article number, page 5 of 7 A&A proofs: manuscript no. aa31087 Appendix A: Examples of simulated magnification profiles µ(u ) Given the di fficulty of accurately measuring the whole magnifi- cation profile µ(v) and th...
2005
Reviewed August 14, 2026 · model on record in the stance chip above.
Discussion (0). Continue with ORCID to comment.