REVIEW 1 major objections 5 minor 84 references
Euclid preparation: V. Predicted yield of redshift 7<z<9 quasars from the wide survey
T0 review · 1 major / 5 minor · reviewed 2026-08-14 · deepseek-v4-flash
Pith's one-line read Euclid's wide survey should yield over 100 quasars at redshifts 7.0-7.5, and roughly 25 beyond 7.5, even if quasar numbers fade fast.
desk verdict A careful, transparent update of the Euclid z>7 quasar yield forecast, but the k=-0.92 scenario has an unquantified internal inconsistency (selection functions built with a k=-0.72 prior) that likely makes the headline 'over 100' an overestimate. read the letter →
The pith
A machine-rendered reading of the paper's core claim, the machinery that carries it, and where it could break.
The reading
What carries the argument
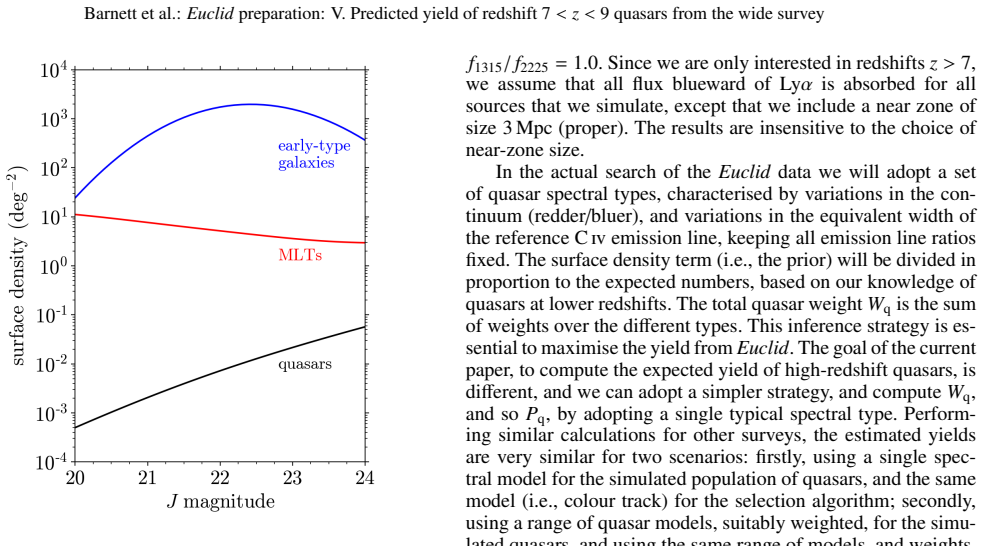
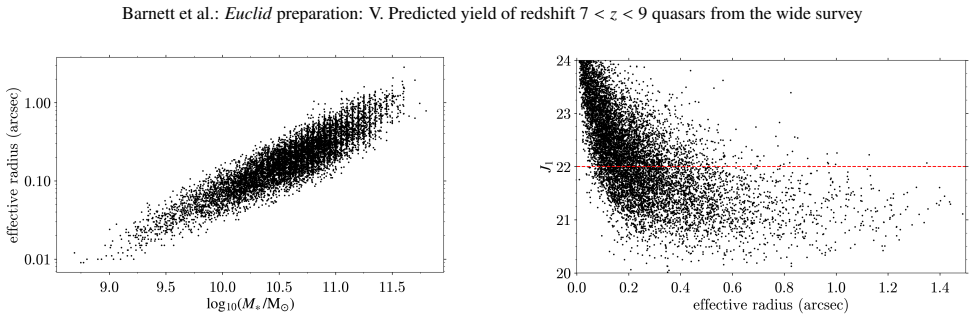
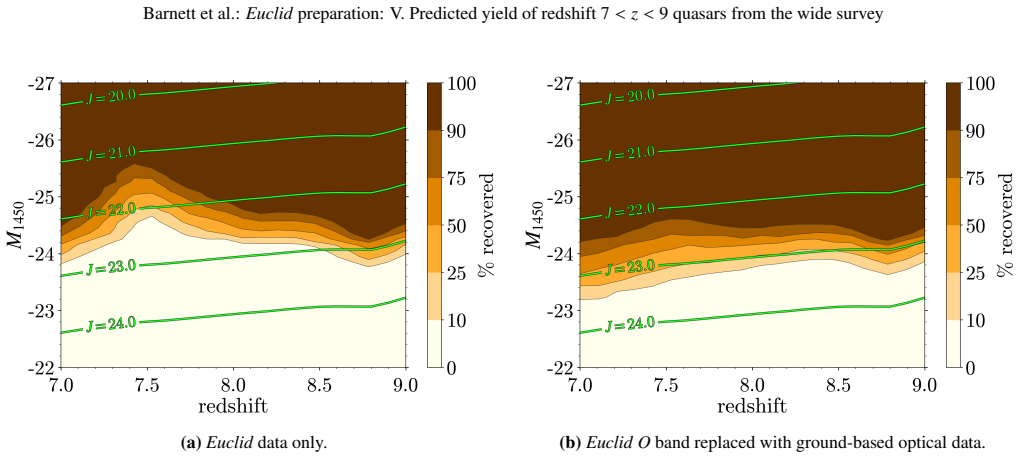
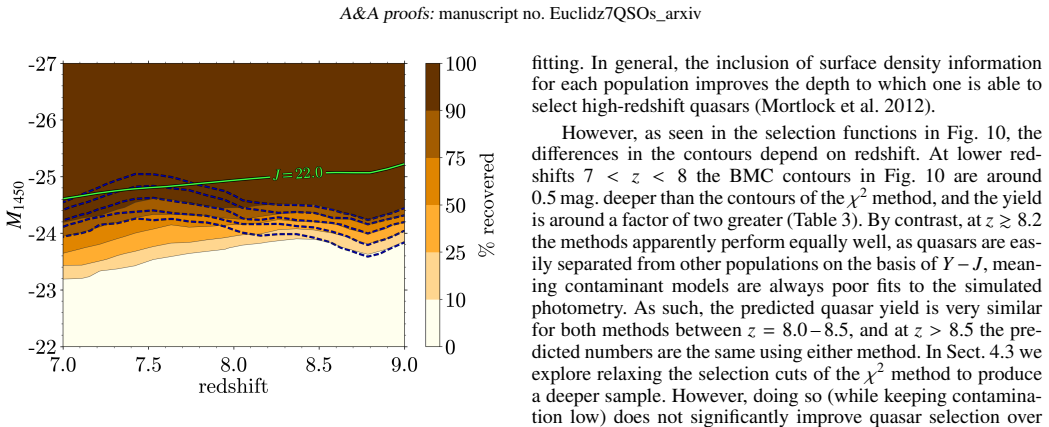
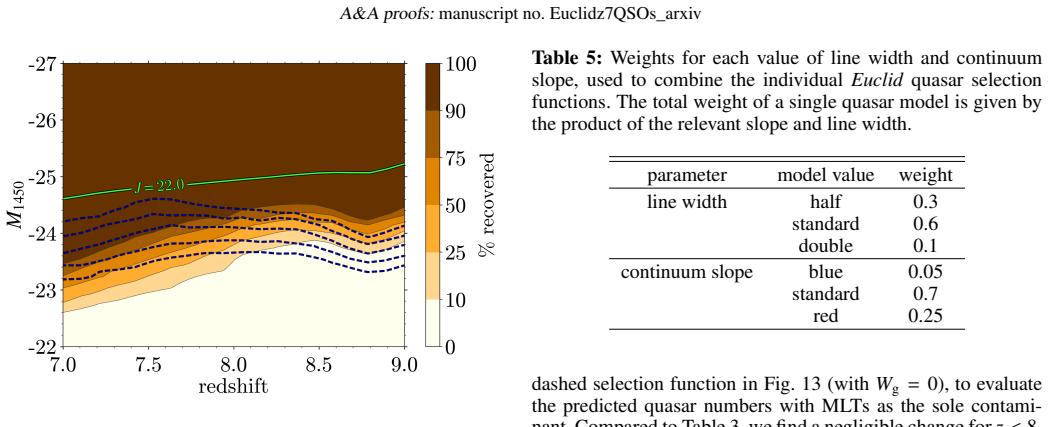
The machinery is the Bayesian model-comparison (BMC) selection function. For simulated quasars on a grid of luminosity and redshift, the method computes a posterior quasar probability $P_q$ from Gaussian photometric likelihoods weighted by the surface densities of three populations: quasars from the $z=6$ luminosity function, MLT dwarfs from published luminosity functions and colours, and compact early-type galaxies at $z=1-2$ modelled from COSMOS data with a size-mass relation. The selection function records the fraction of quasars with $P_q>0.1$ as a function of absolute magnitude and redshift, and the predicted yields follow by integrating the assumed luminosity function over these functions. The key comparison that carries the argument is between using Euclid's broad $O$ band and using deep ground-based $z$-band data, which sharpens the contrast across the Lyman break and deepens the selection by about a magnitude over $7<z<8$.
What would settle it
Search for spectroscopically confirmed quasars at $7.5<z<8.0$ in the Euclid DR1 southern field (1250 deg2 with one-year LSST data), where the prediction is 4.1 quasars for $k=-0.72$ and 1.8 for $k=-0.92$; a confirmed count consistent with zero across the full DR1 area would falsify the yield forecast.
Extended reading notes
Core claim
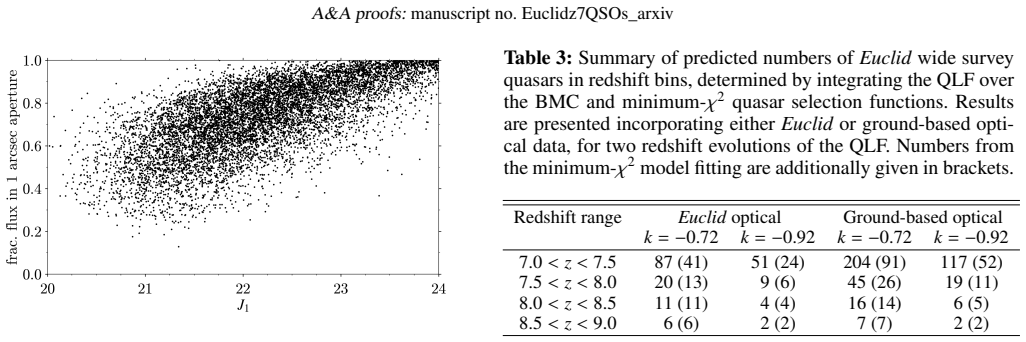
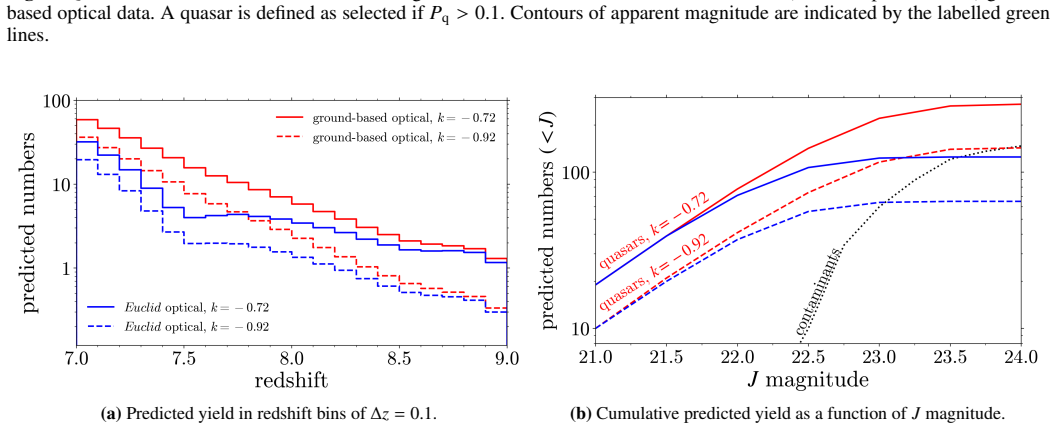
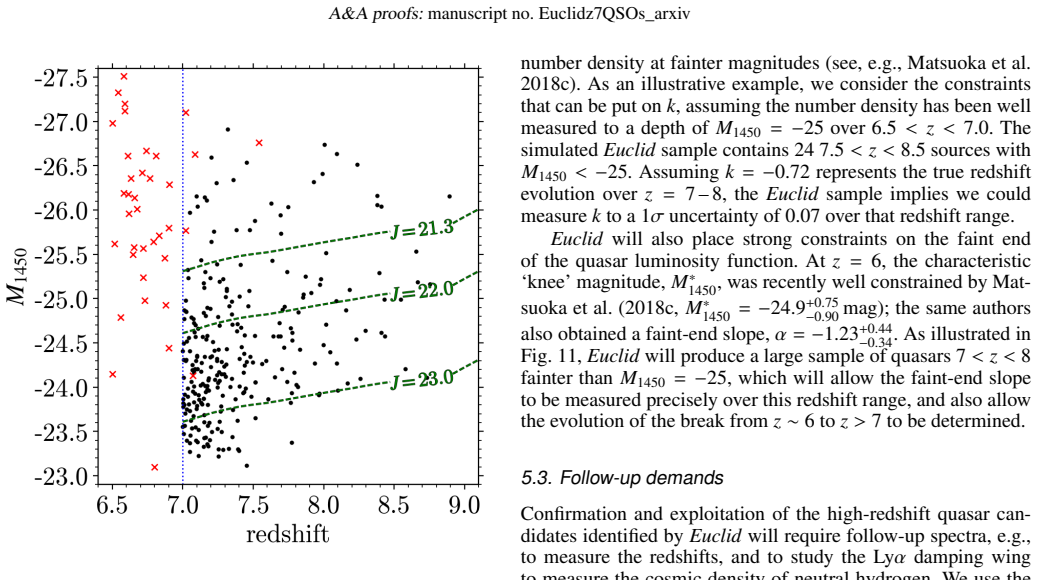
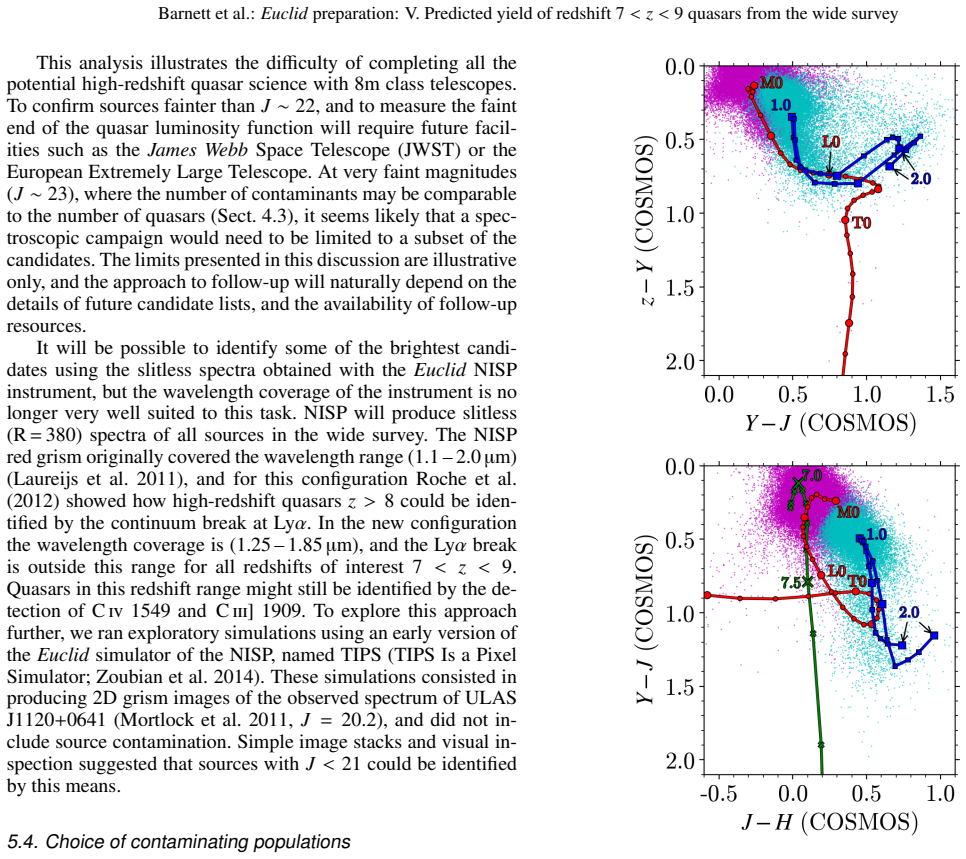
The central result is a new set of Euclid quasar selection functions, derived by simulating quasars on a grid of absolute magnitude and redshift and recording the fraction that survive a Bayesian model-comparison selection with quasar probability threshold $P_q>0.1$. When the $z=6$ quasar luminosity function is extrapolated as $\Phi\propto 10^{k(z-6)}$, the predicted yields are 204 quasars at $7.0<z<7.5$ and 45 at $7.5<z<8.0$ for $k=-0.72$ with ground-based optical data, falling to 117 and 19 for $k=-0.92$; the corresponding numbers beyond $z=8$ are 23 and 8. With deep $z$-band data the selection reaches $J_{AB}\sim23$, about a magnitude deeper than with Euclid's own optical band over $7<z<8$, and at that limit the predicted contamination leaves a selection efficiency of roughly two-thirds. The paper further shows that quasars at $z>8$ can be selected from Euclid $OYJH$ photometry alone, and that $k$ can be recovered to a $1\sigma$ uncertainty of 0.07 over $7<z<8$ if $k=-0.72$.
Load-bearing premise
The forecast rests on the assumption that the measured decline of bright quasars between redshifts 5 and 6 continues unchanged all the way to redshift 9 as a single power law, $\Phi\propto 10^{k(z-6)}$, with the decline rate set to $k=-0.72$ or $k=-0.92$; if the number density falls faster or the luminosity function bends, every predicted count shifts.
Editorial extensions
If this is right
- Under the nominal $k=-0.72$ decline, Euclid should yield over 200 quasars at $7.0<z<7.5$ and 45 at $7.5<z<8.0$ with ground-based optical data, giving the first large sample of $z>7$ quasars.
- Even under the steeper $k=-0.92$ decline, more than 100 quasars at $7<z<7.5$ and about 8 beyond $z>8$ are expected, so Euclid should break the current redshift record.
- Euclid's samples will constrain the bright-end slope of the quasar luminosity function over $7<z<8$ with 8m telescopes, while JWST or E-ELT follow-up will be needed to measure the faint-end slope.
- The first quasars at $z>7.5$ should appear in the DR1 data release in 2024, with more than ten $7<z<9$ quasars predicted over the 1250 deg2 southern DR1 area with LSST data.
- Assuming $k=-0.72$, the decline parameter $k$ can be measured to a $1\sigma$ uncertainty of 0.07 over $7<z<8$.
Reading between the lines
- Inference: if the predicted counts materialise, the same sample could be used to test black-hole seeding scenarios by checking whether the supply of $z>7$ bright quasars is consistent with Eddington-limited growth from stellar-mass seeds, because the survey would measure the bright-end space density directly rather than extrapolating it.
- Inference: the forecast's sensitivity to $z$-band depth implies that the realised yield is partly a survey-coordination outcome: a one-magnitude loss in Pan-STARRS or LSST coverage would more than halve the $7<z<8$ yield, so the paper functions as a quantitative argument for prioritising the ground-based overlap.
- Inference: because the simulation excludes gravitationally lensed quasars with optical flux from the deflecting galaxy, a future search that adds lensed templates could find an additional population; counting lensed candidates in the final sample would test whether the empirical lensing fraction near 1% holds at $z>7$.
- Inference: a quick test of the selection before DR1 is possible with the Q1 release over about 50 deg2, where the model predicts at most one $7<z<9$ quasar but also predicts the expected number of false candidates; matching that contamination rate would calibrate the Bayesian priors for later releases.
Signed reviews
Editorial analysis
A structured set of objections, weighed in public.
Referee Report
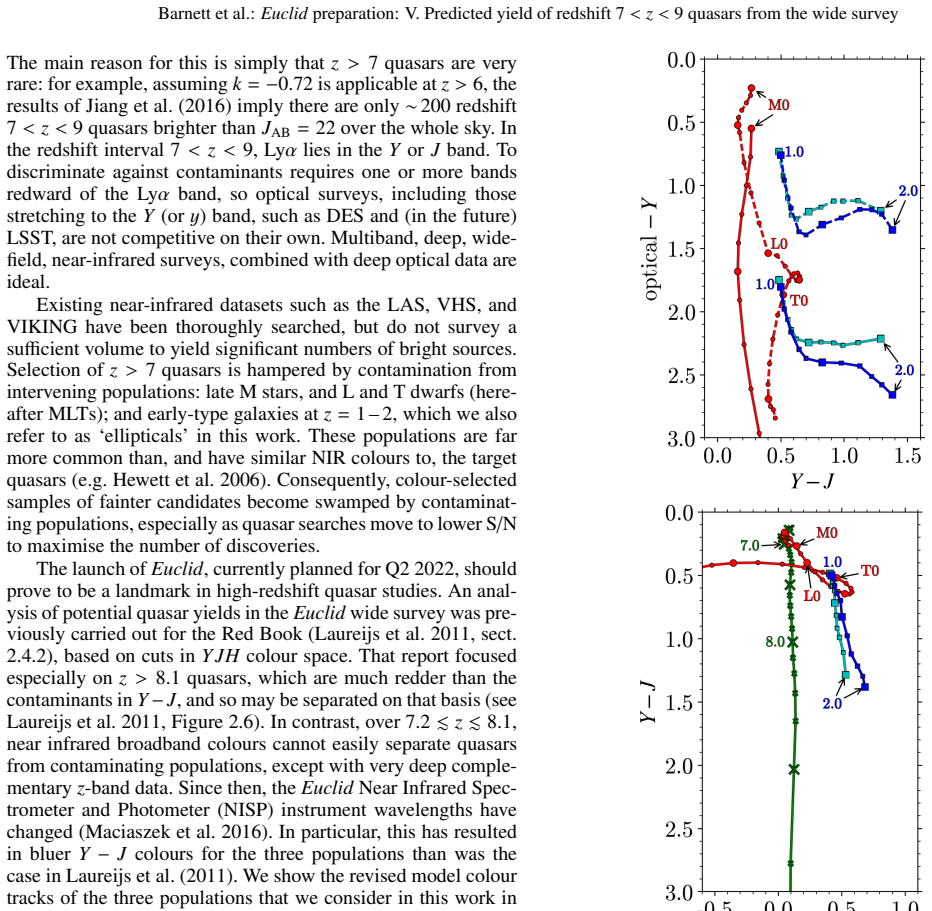
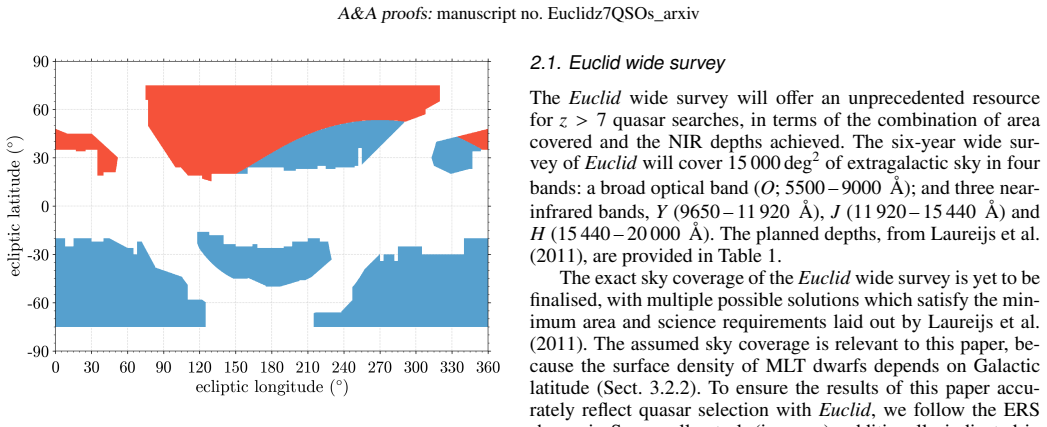
Summary. This paper presents simulated predictions of the number of 7<z<9 quasars that the Euclid wide survey will discover. The authors update the Red Book calculation using revised NISP filter curves, the Jiang et al. (2016) z=6 quasar luminosity function extrapolated with k=-0.72 or k=-0.92, improved models of MLT dwarf and early-type galaxy contaminants, and a Bayesian model comparison (BMC) selection method alongside a minimum-chi-squared method. They compute selection functions and integrate them over the QLF to obtain yields in redshift bins. With ground-based z-band data, they predict over 100 quasars at 7.0<z<7.5 even for k=-0.92, about 25 at z>7.5, and about 8 at z>8.0. They also discuss contamination rates, follow-up feasibility, and the timeline of Euclid data releases, and estimate that k could be measured to 1-sigma uncertainty of 0.07 over 7<z<8.
Significance. If the predictions are correct, Euclid will provide the first large statistical sample of z>7 quasars, enabling direct measurement of the quasar luminosity function at 7<z<9, constraints on SMBH growth, and Ly-alpha damping-wing measurements of reionization. The paper is thorough and reproducible in structure: the population models are described in detail, the BMC and chi-squared methods are compared, and the sensitivity to contaminant populations (Sects. 5.4-5.5) and quasar template variations (Sect. 5.6) is explicitly tested. The predicted yield for the k=-0.92 scenario, however, rests on an internal inconsistency in the selection-function prior, which needs to be resolved before the headline numbers can be considered robust.
major comments (1)
- [Sections 3.2.1 and 4.1, Table 3] The k=-0.92 yield forecasts are computed by integrating the k=-0.92 QLF over selection functions that were themselves derived with a quasar prior fixed to k=-0.72 (stated in Section 3.2.1). Because P_q in Eq. (2) depends on the quasar surface-density prior in Eq. (3), this is not a self-consistent forecast: in a true k=-0.92 world the prior would be lower by a factor of 10^{0.2(z-6)} (about 1.8 at z=7.25 and 2.9 at z=8.25), which would lower P_q for marginal sources and likely reduce the faint-end completeness. Since a substantial fraction of the Table 3 counts come from near J~23, the headline claim of 'over 100 quasars' for k=-0.92 in the abstract and Section 4.1 could be an overestimate. Please recompute the selection functions for the k=-0.92 prior or quantify the resulting bias; the current treatment leaves the size of the effect unquantified.
minor comments (5)
- [Table 3] The yields are reported as point estimates with no uncertainties; adding at least Poisson errors (and a brief discussion of systematic uncertainties from the contaminant surface densities) would help the reader assess the significance of the differences between scenarios.
- [Section 5.1, Table 4] The statement that 'the first Euclid quasars at z>7.5 should be found in DR1' is stronger than the numbers justify; for k=-0.92 the predicted DR1 yield at z>7.5 is 2.3 sources, so 'expected' or 'could' would be more appropriate.
- [Abstract] The headline 'over 100 quasars with 7.0<z<7.5' for k=-0.92 refers to the case with ground-based z-band data; the abstract mentions that z-band data improve selection over 7<z<8, but the claim should state this condition explicitly at that point.
- [Section 3.1.1, Eq. (3)] The notation 'theta_t is the set of parameters describing a single population' is ambiguous because the quasar population is described by a continuous grid in M_1450 and z while the MLT population is a set of discrete spectral types; please clarify.
- [Section 3.2.1] The statement that the results are insensitive to the near-zone size is not demonstrated; a one-sentence sensitivity test or a reference would support this claim.
Circularity Check
No circularity: the predicted yields are conditional forecasts obtained by integrating an externally measured QLF over simulated selection functions; the k=-0.92 prior mismatch is a consistency caveat, not a circular reduction.
full rationale
The paper's central prediction is the yield of z>7 quasars from Euclid, computed as the integral of an assumed quasar luminosity function over simulated selection functions. The QLF is taken from Jiang et al. (2016), an external measurement at z=5-6, with k=-0.72 adopted from that work and k=-0.92 chosen 'simply to present a more pessimistic forecast' (Sect. 4.1). The selection functions are derived from simulated photometry, model SEDs, noise, and the BMC or chi-squared selection algorithms; they are detection probabilities, not re-expressions of the yield. The BMC quasar prior does use the same Jiang et al. QLF family (Sect. 3.2.1), but the predicted counts are not equal to that prior by construction: they depend non-trivially on colors, contaminants, photometric noise, and the Pq threshold. No fitted parameter is renamed as a prediction, and no uniqueness theorem or load-bearing self-citation forces the result. The Mortlock et al. (2012) citation for the BMC method is not circular because the method is fully specified in Eqs. (2)-(4) and was externally validated by discovering a real z>7 quasar. The only notable issue is internal consistency: the k=-0.92 columns of Table 3 use selection functions computed with a k=-0.72 quasar prior, which could bias the yield estimate, but this is a modeling inconsistency rather than a circular argument, since the prediction is not logically equivalent to its inputs. The paper is self-contained against external benchmarks and transparently labels k as the dominant unknown, so no significant circularity is present.
Assumptions & free parameters
free parameters (4)
- QLF decline rate k =
-0.72 and -0.92 (assumed)
- Early-type galaxy surface density parameters (alpha, sigma, J0, b, z0) =
8969, 0.770, 20.692, 1.332, 0.424
- Pq selection threshold =
0.1
- Early-type galaxy formation redshift fractions =
0.8 at zf=3, 0.2 at zf=10
assumptions (8)
- standard math Bayes' theorem and Gaussian photometric likelihood (Eqs. 2-4) define the posterior quasar probability.
- domain assumption The Jiang et al. (2016) z=6 QLF with power-law decline Phi proportional to 10^{k(z-6)} holds at 7<z<9.
- domain assumption Quasars at z>7 have negligible flux blueward of the redshifted Ly-alpha line except for a 3 Mpc near zone.
- domain assumption MLT dwarfs and compact early-type galaxies are the only relevant contaminating populations.
- domain assumption The adopted Euclid wide survey depths, ERS footprint, and LSST/Pan-STARRS z-band depths will be realized.
- domain assumption All J1>22 early-type galaxies at 1<z<2 will be classified as point sources by Euclid.
- domain assumption A single typical quasar SED (EW C IV = 39.1 Angstrom, continuum slope f1315/f2225 = 1.0) represents the z>7 population when combined with template weights.
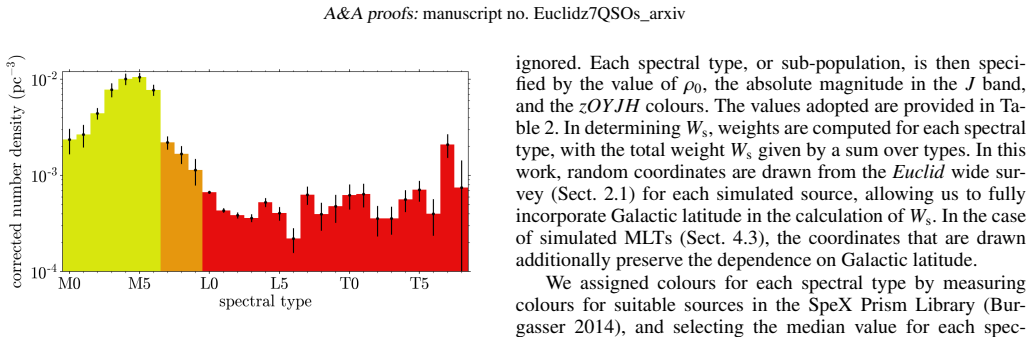
- domain assumption The Milky Way thin-disk MLT density model with a 300 pc scale height and literature colours is accurate, and subdwarfs are negligible.
Cite this review
Pith. "Pith review of Euclid preparation: V. Predicted yield of redshift 7<z<9 quasars from the wide survey." pith.science (2026). https://pith.science/paper/BFEM3WKY
@misc{pith2026190804310,
  author       = {Pith},
  title        = {Pith review of: Euclid preparation: V. Predicted yield of redshift 7<z<9 quasars from the wide survey},
  year         = {2026},
  howpublished = {\url{https://pith.science/paper/BFEM3WKY}},
  note         = {Machine review of arXiv:1908.04310}
}
abstract
We provide predictions of the yield of $7<z<9$ quasars from the Euclid wide survey, updating the calculation presented in the Euclid Red Book in several ways. We account for revisions to the Euclid near-infrared filter wavelengths; we adopt steeper rates of decline of the quasar luminosity function (QLF; $\Phi$) with redshift, $\Phi\propto10^{k(z-6)}$, $k=-0.72$, and a further steeper rate of decline, $k=-0.92$; we use better models of the contaminating populations (MLT dwarfs and compact early-type galaxies); and we use an improved Bayesian selection method, compared to the colour cuts used for the Red Book calculation, allowing the identification of fainter quasars, down to $J_{AB}\sim23$. Quasars at $z>8$ may be selected from Euclid $OYJH$ photometry alone, but selection over the redshift interval $7<z<8$ is greatly improved by the addition of $z$-band data from, e.g., Pan-STARRS and LSST. We calculate predicted quasar yields for the assumed values of the rate of decline of the QLF beyond $z=6$. For the case that the decline of the QLF accelerates beyond $z=6$, with $k=-0.92$, Euclid should nevertheless find over 100 quasars with $7.0<z<7.5$, and $\sim25$ quasars beyond the current record of $z=7.5$, including $\sim8$ beyond $z=8.0$. The first Euclid quasars at $z>7.5$ should be found in the DR1 data release, expected in 2024. It will be possible to determine the bright-end slope of the QLF, $7<z<8$, $M_{1450}<-25$, using 8m class telescopes to confirm candidates, but follow-up with JWST or E-ELT will be required to measure the faint-end slope. Contamination of the candidate lists is predicted to be modest even at $J_{AB}\sim23$. The precision with which $k$ can be determined over $7<z<8$ depends on the value of $k$, but assuming $k=-0.72$ it can be measured to a 1 sigma uncertainty of 0.07.
Figures
Figures from the paper (9 more)
Reference graph
Works this paper leans on
-
[1]
P., Decarli, R., et al
Bañados, E., Venemans, B. P., Decarli, R., et al. 2016, ApJS, 227, 11 Bañados, E., Venemans, B. P., Mazzucchelli, C., et al. 2018, Nature, 553, 473
2016
-
[2]
2017, A&A, 601, A16
Barnett, R., Warren, S., Becker, G., et al. 2017, A&A, 601, A16
2017
-
[3]
D., Bolton, J
Becker, G. D., Bolton, J. S., Madau, P., et al. 2015, MNRAS, 447, 3402
2015
-
[4]
C., V olonteri, M., & Rees, M
Begelman, M. C., V olonteri, M., & Rees, M. J. 2006, MNRAS, 370, 289
2006
-
[5]
Bochanski, J. J., Hawley, S. L., Covey, K. R., et al. 2010, AJ, 139, 2679
work page 2010
-
[6]
Bolton, J. S., Haehnelt, M. G., Warren, S. J., et al. 2011, MNRAS, 416, L70
work page 2011
-
[7]
& Loeb, A
Bromm, V . & Loeb, A. 2003, ApJ, 596, 34
2003
-
[8]
& Charlot, S
Bruzual, G. & Charlot, S. 2003, MNRAS, 344, 1000
2003
Show all 84 references
-
[9]
Burgasser, A. J. 2014, ArXiv e-prints: 1406.4887
2014 arXiv
-
[10]
Cantalupo, S., Porciani, C., & Lilly, S. J. 2008, ApJ, 672, 48
2008
-
[11]
L., Wang, R., Fan, X., et al
Carilli, C. L., Wang, R., Fan, X., et al. 2010, ApJ, 714, 834
2010
-
[12]
& Haiman, Z
Cen, R. & Haiman, Z. 2000, ApJ, 542, L75
2000
-
[13]
2003, PASP, 115, 763
Chabrier, G. 2003, PASP, 115, 763
2003
-
[14]
C., Magnier, E
Chambers, K. C., Magnier, E. A., Metcalfe, N., et al. 2016, ArXiv e-prints: 1612.05560
2016 arXiv
-
[15]
J., Bluck, A
Conselice, C. J., Bluck, A. F. L., Ravindranath, S., et al. 2011, MNRAS, 417, 2770 Article number, page 17 of 19 A&A proofs: manuscript no. Euclidz7QSOs_arxiv
2011
-
[16]
L., Reid, I
Cruz, K. L., Reid, I. N., Kirkpatrick, J. D., et al. 2007, AJ, 133, 439
2007
-
[17]
B., Furlanetto, S
Davies, F. B., Furlanetto, S. R., & McQuinn, M. 2016, MNRAS, 457, 3006
2016
-
[18]
B., Hennawi, J
Davies, F. B., Hennawi, J. F., Bañados, E., et al. 2018, ApJ, 864, 142
2018
-
[19]
M., Shiralilou, B., et al
Dayal, P., Rossi, E. M., Shiralilou, B., et al. 2019, MNRAS, 486, 2336
2019
-
[20]
P., et al
Decarli, R., Walter, F., Venemans, B. P., et al. 2017, Nature, 545, 457
2017
-
[21]
Dupuy, T. J. & Liu, M. C. 2012, ApJS, 201, 19
2012
-
[22]
B., Hennawi, J
Eilers, A.-C., Davies, F. B., Hennawi, J. F., et al. 2017, ApJ, 840, 24
2017
-
[23]
F., & Davies, F
Eilers, A.-C., Hennawi, J. F., & Davies, F. B. 2018, ApJ, 867, 30
2018
-
[24]
2006, AJ, 132, 117
Fan, X., Strauss, M., Becker, R., et al. 2006, AJ, 132, 117
2006
-
[25]
2019, ApJ, 870, L11
Fan, X., Wang, F., Yang, J., et al. 2019, ApJ, 870, L11
2019
-
[26]
2017, ApJ, 843, 141
Ferguson, D., Gardner, S., & Yanny, B. 2017, ApJ, 843, 141
2017
-
[27]
2014, MNRAS, 443, 2410
Ferrara, A., Salvadori, S., Yue, B., & Schleicher, D. 2014, MNRAS, 443, 2410
2014
-
[28]
2017, A&A, 598, A20
Galametz, A., Saglia, R., Paltani, S., Apostolakos, N., & Dubath, P. 2017, A&A, 598, A20
2017
-
[29]
2015, A&A, 578, A83
Giallongo, E., Grazian, A., Fiore, F., et al. 2015, A&A, 578, A83
2015
-
[30]
& Reid, N
Gilmore, G. & Reid, N. 1983, MNRAS, 202, 1025
1983
-
[31]
1996, A&AS, 117, 113
Girardi, L., Bressan, A., Chiosi, C., Bertelli, G., & Nasi, E. 1996, A&AS, 117, 113
1996
-
[32]
2019, MNRAS, 484, 5094
Greig, B., Mesinger, A., & Bañados, E. 2019, MNRAS, 484, 5094
2019
-
[33]
Gunn, J. E. & Peterson, B. A. 1965, ApJ, 142, 1633
1965
-
[34]
C., Warren, S
Hewett, P. C., Warren, S. J., Leggett, S. K., & Hodgkin, S. T. 2006, MNRAS, 367, 454
2006
-
[35]
W., Bridge, J
Holwerda, B. W., Bridge, J. S., Ryan, R., et al. 2018, A&A, 620, A132
2018
-
[36]
Inayoshi, K., Haiman, Z., & Ostriker, J. P. 2016, MNRAS, 459, 3738 Ivezi´c, Ž., Kahn, S. M., Tyson, J. A., et al. 2008, ArXiv e-prints: 0805.2366
2016 arXiv
-
[37]
2008, AJ, 135, 1057
Jiang, L., Fan, X., Annis, J., et al. 2008, AJ, 135, 1057
2008
-
[38]
D., Fan, X., et al
Jiang, L., McGreer, I. D., Fan, X., et al. 2016, AJ, 833, 222
2016
-
[39]
2017, Scientific Reports, 7, 41617
Koptelova, E., Hwang, C., Yu, P., Chen, W., & Guo, J. 2017, Scientific Reports, 7, 41617
2017
-
[40]
E., Reddy, N
Kriek, M., Shapley, A. E., Reddy, N. A., et al. 2015, ApJS, 218, 15
2015
-
[41]
2008, Synphot Data User’s Guide, (Balti- more, STScI)
Laidler, V ., Boffi, F., Barlow, T., et al. 2008, Synphot Data User’s Guide, (Balti- more, STScI)
2008
-
[42]
J., Ilbert, O., et al
Laigle, C., McCracken, H. J., Ilbert, O., et al. 2016, ApJS, 224, 24
2016
-
[43]
2011, ArXiv e-prints: 1110.3193
Laureijs, R., Amiaux, J., Arduini, S., et al. 2011, ArXiv e-prints: 1110.3193
2011 arXiv
-
[44]
J., Almaini, O., et al
Lawrence, A., Warren, S. J., Almaini, O., et al. 2007, MNRAS, 379, 1599
2007
-
[45]
2016, in Proc
Maciaszek, T., Ealet, A., Jahnke, K., et al. 2016, in Proc. SPIE, V ol. 9904, Space Telescopes and Instrumentation 2016: Optical, Infrared, and Millime- ter Wave, 99040T
2016
-
[46]
C., Péroux, C., Nestor, D
Maddox, N., Hewett, P. C., Péroux, C., Nestor, D. B., & Wisotzki, L. 2012, MN- RAS, 424, 2876
2012
-
[47]
C., Warren, S
Maddox, N., Hewett, P. C., Warren, S. J., & Croom, S. M. 2008, MNRAS, 386, 1605
2008
-
[48]
2017, MNRAS, 466, 1160
Manti, S., Gallerani, S., Ferrara, A., Greig, B., & Feruglio, C. 2017, MNRAS, 466, 1160
2017
-
[49]
2016, ApJ, 828, 26
Matsuoka, Y ., Onoue, M., Kashikawa, N., et al. 2016, ApJ, 828, 26
2016
-
[50]
2019, ApJ, 872, L2
Matsuoka, Y ., Onoue, M., Kashikawa, N., et al. 2019, ApJ, 872, L2
2019
-
[51]
P., et al
Mazzucchelli, C., Bañados, E., Venemans, B. P., et al. 2017, ApJ, 849, 91
2017
-
[52]
D., Jiang, L., Fan, X., et al
McGreer, I. D., Jiang, L., Fan, X., et al. 2013, ApJ, 768, 105
2013
-
[53]
A., Menanteau, F., et al
Morganson, E., Gruendl, R. A., Menanteau, F., et al. 2018, PASP, 130, 074501
2018
-
[54]
J., Patel, M., Warren, S
Mortlock, D. J., Patel, M., Warren, S. J., et al. 2012, MNRAS, 419, 390
2012
-
[55]
J., Warren, S
Mortlock, D. J., Warren, S. J., Venemans, B. P., et al. 2011, Nature, 474, 616
2011
-
[56]
2005, ApJ, 628, 368
Ohsuga, K., Mori, M., Nakamoto, T., & Mineshige, S. 2005, ApJ, 628, 368
2005
-
[57]
& Loeb, A
Pacucci, F. & Loeb, A. 2019, ApJ, 870, L12
2019
-
[58]
S., & McLure, R
Parsa, S., Dunlop, J. S., & McLure, R. J. 2018, MNRAS, 474, 2904
2018
-
[59]
2018, A&A, 617, A127 Planck Collaboration
Pipien, S., Cuby, J.-G., Basa, S., et al. 2018, A&A, 617, A127 Planck Collaboration. 2018, arXiv e-prints: 1807.06209
2018 arXiv
-
[60]
G., Simcoe, R
Pons, E., McMahon, R. G., Simcoe, R. A., et al. 2019, MNRAS, 484, 5142
2019
-
[61]
L., Banerji, M., Becker, G
Reed, S. L., Banerji, M., Becker, G. D., et al. 2019, MNRAS, 487, 1874
2019
-
[62]
L., McMahon, R
Reed, S. L., McMahon, R. G., Martini, P., et al. 2017, MNRAS, 468, 4702
2017
-
[63]
C., Aubourg, É., et al
Rhodes, J., Nichol, R. C., Aubourg, É., et al. 2017, ApJS, 233, 21
2017
-
[64]
2012, MNRAS, 420, 1764
Roche, N., Franzetti, P., Garilli, B., et al. 2012, MNRAS, 420, 1764
2012
-
[65]
P., Richards, G
Schneider, D. P., Richards, G. T., Hall, P. B., et al. 2010, AJ, 139, 2360
2010
-
[66]
2019, ApJ, 873, 35
Shen, Y ., Wu, J., Jiang, L., et al. 2019, ApJ, 873, 35
2019
-
[67]
& Skilling, J
Sivia, D. & Skilling, J. 2006, Data analysis: a Bayesian tutorial, Oxford science publications (Oxford University Press)
2006
-
[68]
J., & Faherty, J
Skrzypek, N., Warren, S. J., & Faherty, J. K. 2016, A&AS, 589, A49
2016
-
[69]
J., Faherty, J
Skrzypek, N., Warren, S. J., Faherty, J. K., et al. 2015, A&AS, 574, A78
2015
-
[70]
2017, MNRAS, 466, 4568
Tang, J., Goto, T., Ohyama, Y ., et al. 2017, MNRAS, 466, 4568
2017
-
[71]
M., Rudnick, G., et al
Trujillo, I., Förster Schreiber, N. M., Rudnick, G., et al. 2006, ApJ, 650, 18 van der Wel, A., Franx, M., van Dokkum, P. G., et al. 2014, ApJ, 788, 28
2006
-
[72]
P., Bañados, E., Decarli, R., et al
Venemans, B. P., Bañados, E., Decarli, R., et al. 2015, ApJ, 801, L11
2015
-
[73]
P., Findlay, J
Venemans, B. P., Findlay, J. R., Sutherland, W. J., et al. 2013, ApJ, 779, 24 V olonteri, M. 2010, Astron. Astrophys. Rev., 18, 279
2013
-
[74]
2017, ApJ, 839, 27
Wang, F., Fan, X., Yang, J., et al. 2017, ApJ, 839, 27
2017
-
[75]
2018a, ArXiv e-prints: 1810.11926
Wang, F., Yang, J., Fan, X., et al. 2018a, ArXiv e-prints: 1810.11926
-
[76]
A., Morgan, D
West, A. A., Morgan, D. P., Bochanski, J. J., et al. 2011, AJ, 141, 97
2011
-
[77]
J., Delorme, P., Reylé, C., et al
Willott, C. J., Delorme, P., Reylé, C., et al. 2010, AJ, 139, 906
2010
-
[78]
L., Eisenhardt, P
Wright, E. L., Eisenhardt, P. R. M., Mainzer, A. K., et al. 2010, AJ, 140, 1868
2010
-
[79]
2015, Proc
Wu, X.-B., Wang, F., Fan, X., et al. 2015, Proc. IAU, 11, 80
2015
-
[80]
Wyithe, J. S. B. & Loeb, A. 2002, ApJ, 577, 57
2002
-
[81]
2019, AJ, 157, 236
Yang, J., Wang, F., Fan, X., et al. 2019, AJ, 157, 236
2019
-
[82]
H., Galvez-Ortiz, M
Zhang, Z. H., Galvez-Ortiz, M. C., Pinfield, D. J., et al. 2018, MNRAS, 480, 5447
2018
-
[83]
2014, in Astronomical Society of the Pacific Conference Series, V ol
Zoubian, J., Kümmel, M., Kermiche, S., et al. 2014, in Astronomical Society of the Pacific Conference Series, V ol. 485, Astronomical Data Analysis Software and Systems XXIII, ed. N. Manset & P. Forshay, 509 1 Astrophysics Group, Blackett Laboratory, Imperial College London, Lo...
2014
-
[84]
Marconi, I-00185 Roma, Italy 75 Centro de Investigaciones Energéticas, Medioambientales y Tec- nológicas (CIEMAT), Avenida Complutense 40, 28040 Madrid, Spain 76 Phys
Gif-sur-Yvette, France 64 INAF-IASF Bologna, Via Piero Gobetti 101, I-40129 Bologna, Italy 65 Observatoire de Sauverny, Ecole Polytechnique Fédérale de Lau- sanne, CH-1290 Versoix, Switzerland 66 INFN-Bologna, Via Irnerio 46, I-40126 Bologna, Italy 67 Kapteyn Astronomical Inst...
2008
Reviewed August 14, 2026 · model on record in the stance chip above.
Discussion (0). Continue with ORCID to comment.