REVIEW 3 major objections 4 minor 1 cited by
Droplets II: Internal Velocity Structures and Potential Rotational Motions in Pressure-dominated Coherent Structures
T0 review · 3 major / 4 minor · reviewed 2026-08-14 · deepseek-v4-flash
Pith's one-line read Tiny prestellar droplets appear to spin just like larger dense cores, with the same scaling laws reaching down to 0.02 pc.
desk verdict Solid new measurements of velocity gradients in sub-0.1 pc droplets extending G93 scaling, but the rotation interpretation is underdetermined at ~2-beam resolution; worth serious peer review. read the letter →
The pith
A machine-rendered reading of the paper's core claim, the machinery that carries it, and where it could break.
The reading
What carries the argument
The load-bearing object is the two-dimensional linear velocity fit $v(x,y)=c_x x + c_y y + c_0$, whose coefficient vector defines the gradient $G=(c_x,c_y)$. Interpreting $|G|$ as rotation uses the solid-body, uniform-density sphere: angular velocity $\omega=|G|/\sin i$ with $\sin i=1$, specific angular momentum $J/M=\frac{2}{5}\omega R^2$, and rotational parameter $\beta=\frac{1}{3}\omega^2 R^3/(GM)$. This is the same machinery Goodman et al. (1993) applied to larger cores, so the cross-scale comparison is apples-to-apples; the paper supplements it with a pixel-by-pixel integration of angular momentum from Herschel column density maps and an adapted histogram of relative orientations to test whether gradients align with core shapes.
What would settle it
Map one of the 13 analyzed droplets with an interferometer at roughly five to ten times finer resolution, for example in NH$_3$ or N$_2$H$^+$. If the motion is true solid-body rotation, a monotonic gradient should persist across the droplet and the specific-angular-momentum profile should approach $j(r)\propto r^2$; if the single-dish gradient was produced by beam-smearing, background cloud contamination, or a few turbulent pixels, the resolved map will show multiple or non-monotonic gradient directions and a broken or shallower $j(r)$.
Extended reading notes
Core claim
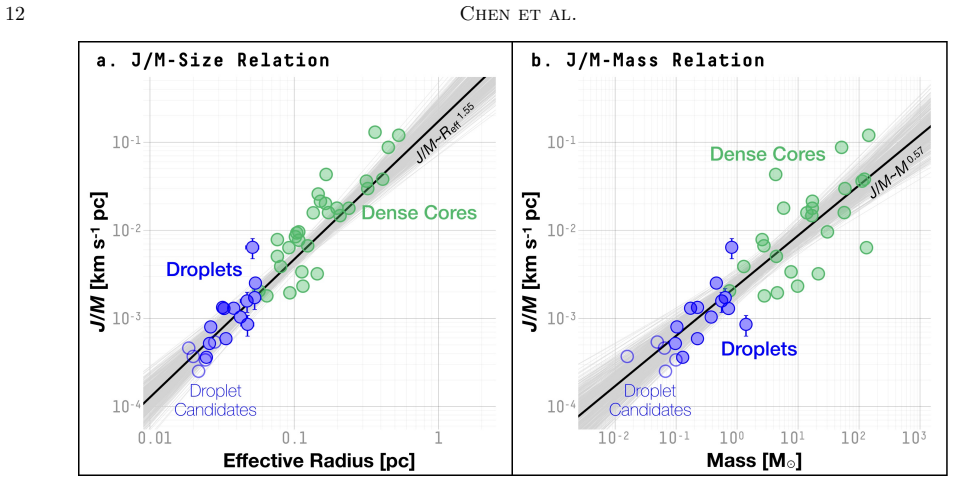
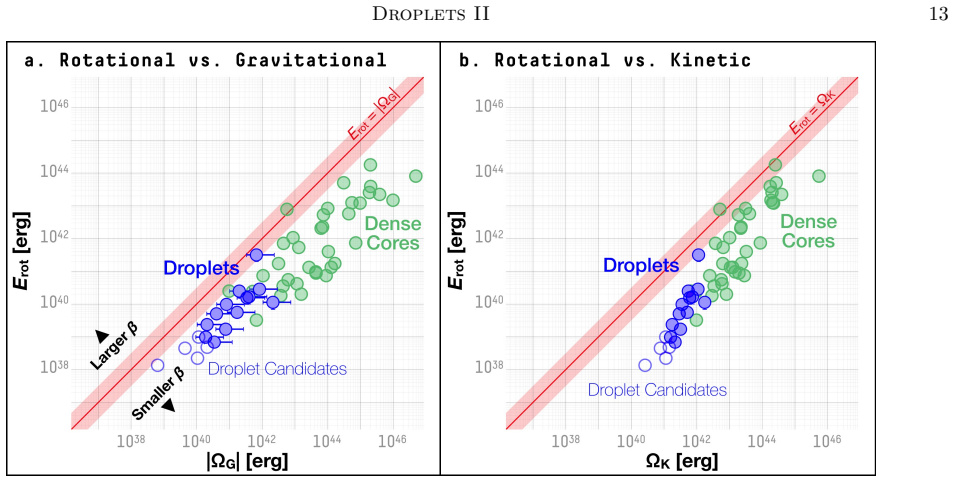
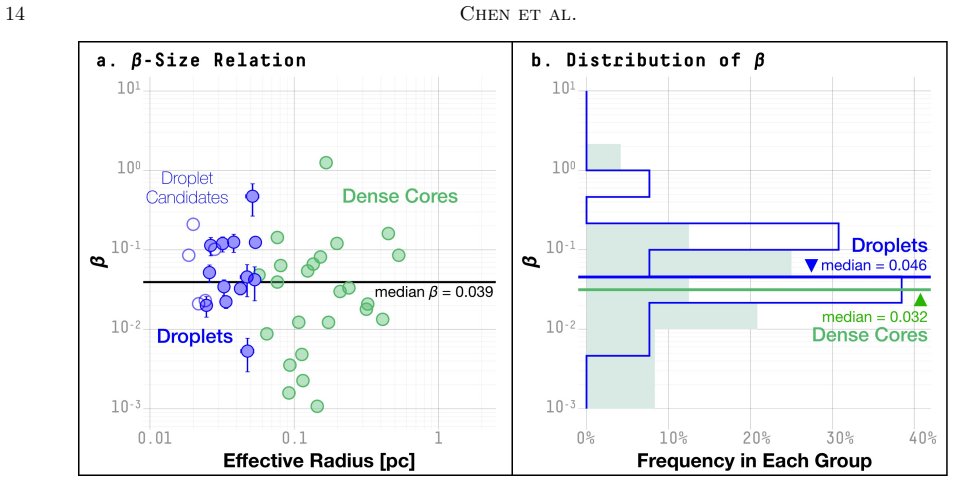
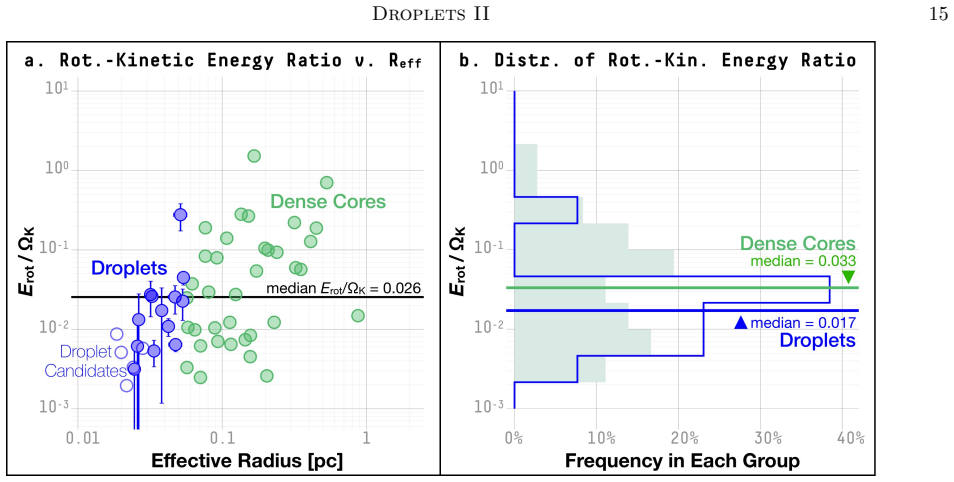
The paper's central claim is that droplets—small, pressure-confined coherent structures with radii near 0.04 pc—share a common rotational state with the larger, self-gravitating dense cores studied by Goodman et al. (1993). Fitting a plane to NH$_3$ centroid velocities yields velocity gradient magnitudes that grow with decreasing size, and assuming solid-body rotation of a uniform-density sphere gives a specific angular momentum relation $J/M = 10^{-0.72\pm 0.20}(R/1\,\mathrm{pc})^{1.55\pm 0.20}$ km/s pc that extends the earlier core relation to smaller scales. The rotational-to-gravitational energy ratio is $\beta = 0.046^{+0.079}_{-0.024}$ for droplets alone and $\beta\approx 0.039$ when larger cores are included, with no strong dependence on size. The authors are careful to label these as "net rotational motions," since turbulence, infall, outflows, and beam effects can contribute to the fitted gradient, and they find no statistically significant alignment between the velocity gradient direction and each droplet's elongation.
Load-bearing premise
The result rests on treating each droplet's fitted line-of-sight velocity gradient as ordered solid-body rotation of a uniform-density sphere seen at the most favorable inclination, even though the droplets span only a few telescope beams and turbulence, infall, outflows, or beam-smearing could produce the same gradient.
Editorial extensions
If this is right
- The specific angular momentum of prestellar material follows $J/M \sim 10^{-0.72}(R/1\,\mathrm{pc})^{1.55}$ km/s pc down to 0.02 pc, giving disk-formation models a defined initial condition at core scales.
- Because $\beta\approx 0.04$ is far below unity, self-gravity alone can easily bind these structures against rotation, and rotation cannot dominate core dynamics unless magnetic braking or turbulence intervenes.
- The near-constancy of $\beta$ with size implies that whatever sets the rotation—turbulent accretion, cloud-scale shear, or larger-scale flow—operates with roughly the same efficiency from 0.02 pc to about 1 pc.
- The lack of alignment between velocity gradient and core elongation indicates that droplet shapes are not rotationally flattened, favoring formation via pressure confinement and ambient flows.
- The $J/M\propto R^{1.5}$ scaling is exactly what turbulence models produce, so the observed "rotation" may largely trace ambient turbulent velocity structure rather than a coherent spinning body.
Reading between the lines
- A testable extension: if the gradients are true rotation, higher-resolution interferometric maps of individual droplets should show a monotonic gradient and a specific-angular-momentum profile approaching $j(r)\propto r^2$; if the gradients come from beam-smearing or turbulence, the apparent gradient should break apart at finer resolution.
- One consequence the authors do not spell out: because most droplets are pressure-confined rather than self-gravitating, the small $\beta$ measured against self-gravity may understate rotation's importance relative to the external pressure that actually confines them.
- Another extension: correlating droplet gradient orientation with the surrounding filament or magnetic-field direction would test whether the apparent rotation is inherited from large-scale turbulent flows, as the $J/M\propto R^{1.5}$ scaling already hints.
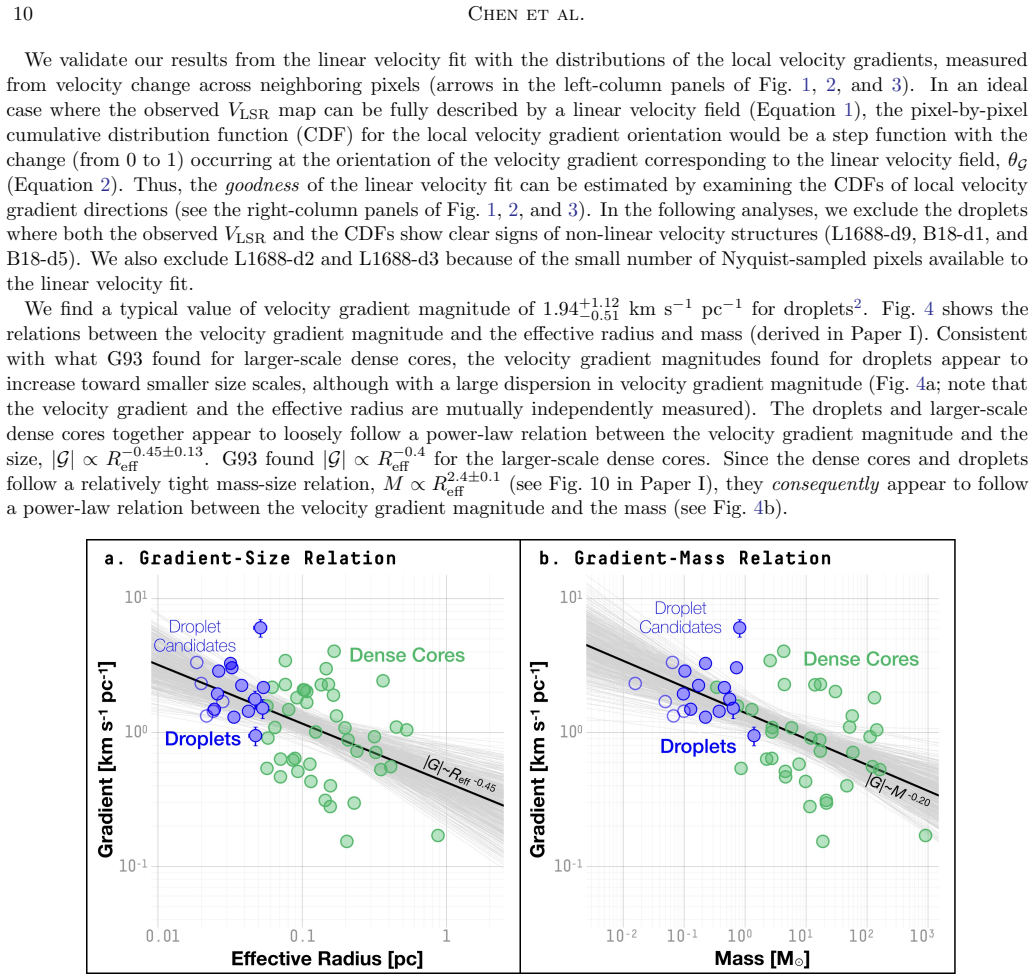
- Applying the same analysis to additional Green Bank Ammonia Survey regions would test whether the $|G|\propto R^{-0.45}$ and $\beta\approx 0.04$ relations are universal or specific to L1688 and B18.
Signed reviews
Editorial analysis
A structured set of objections, weighed in public.
Referee Report
Summary. The paper analyzes GBT NH3 velocity centroid maps of 18 sub-0.1 pc coherent structures ('droplets') in L1688 and B18, fitting 2D linear velocity fields to derive velocity gradient magnitudes and orientations. Under assumptions of solid-body rotation, uniform density, and sin i = 1, the authors derive specific angular momentum J/M, rotational energy E_rot, and the rotational-to-gravitational energy ratio beta. They report that droplets follow the same velocity-gradient-size relation as larger cores (|G| ∝ R_eff^-0.45), that J/M = 10^(-0.72) (R/1 pc)^1.55, that beta ≈ 0.046 for droplets and ≈ 0.039 for the combined sample, and that there is no definitive alignment between velocity gradients and core elongations. The paper explicitly discusses non-rotational interpretations including turbulence, infall, outflows, and beam effects.
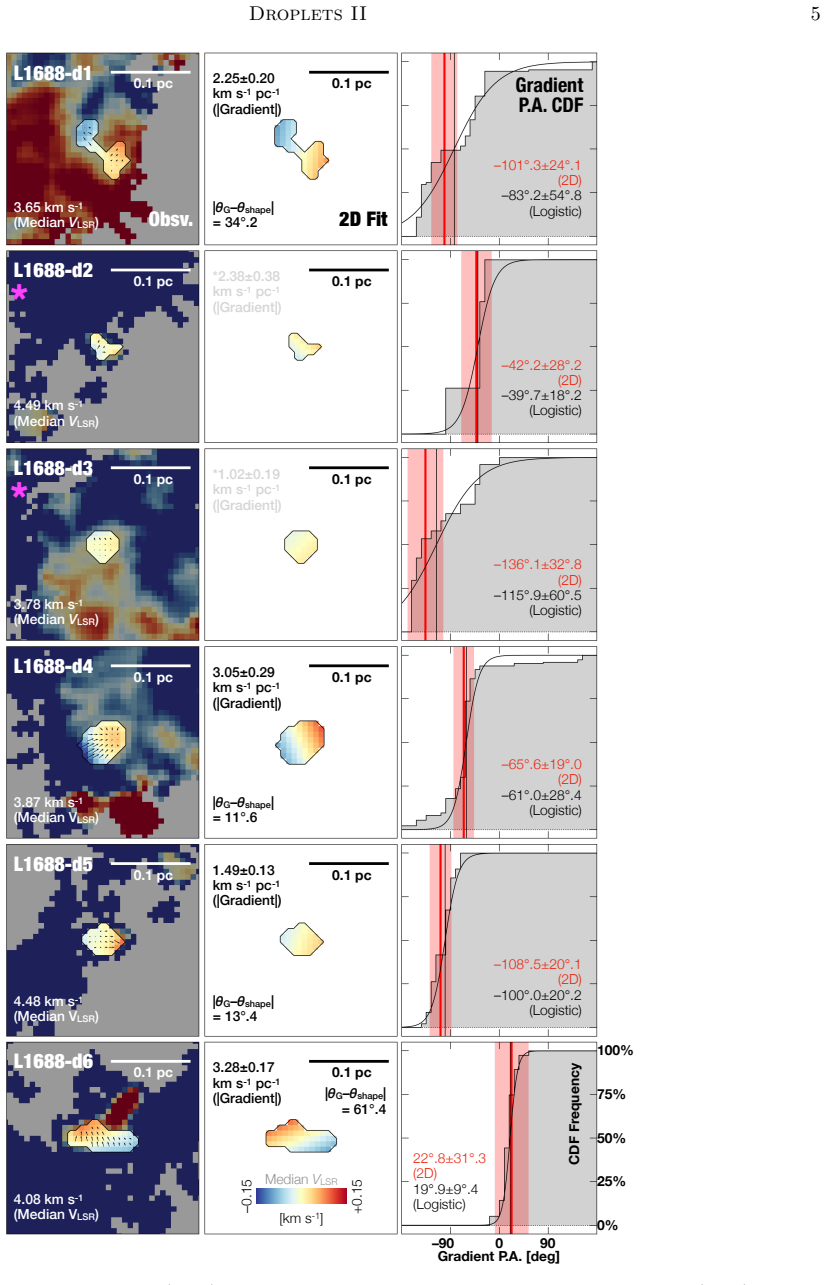
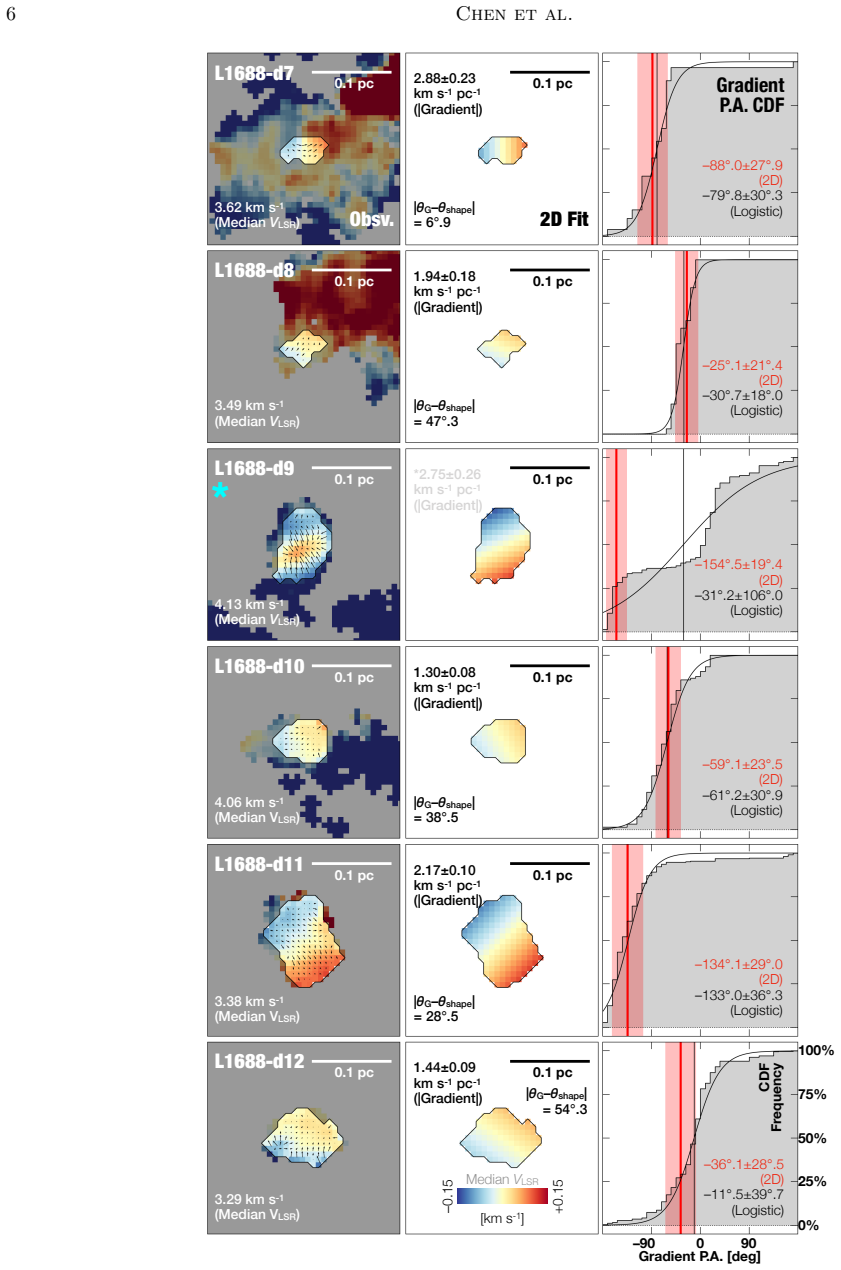
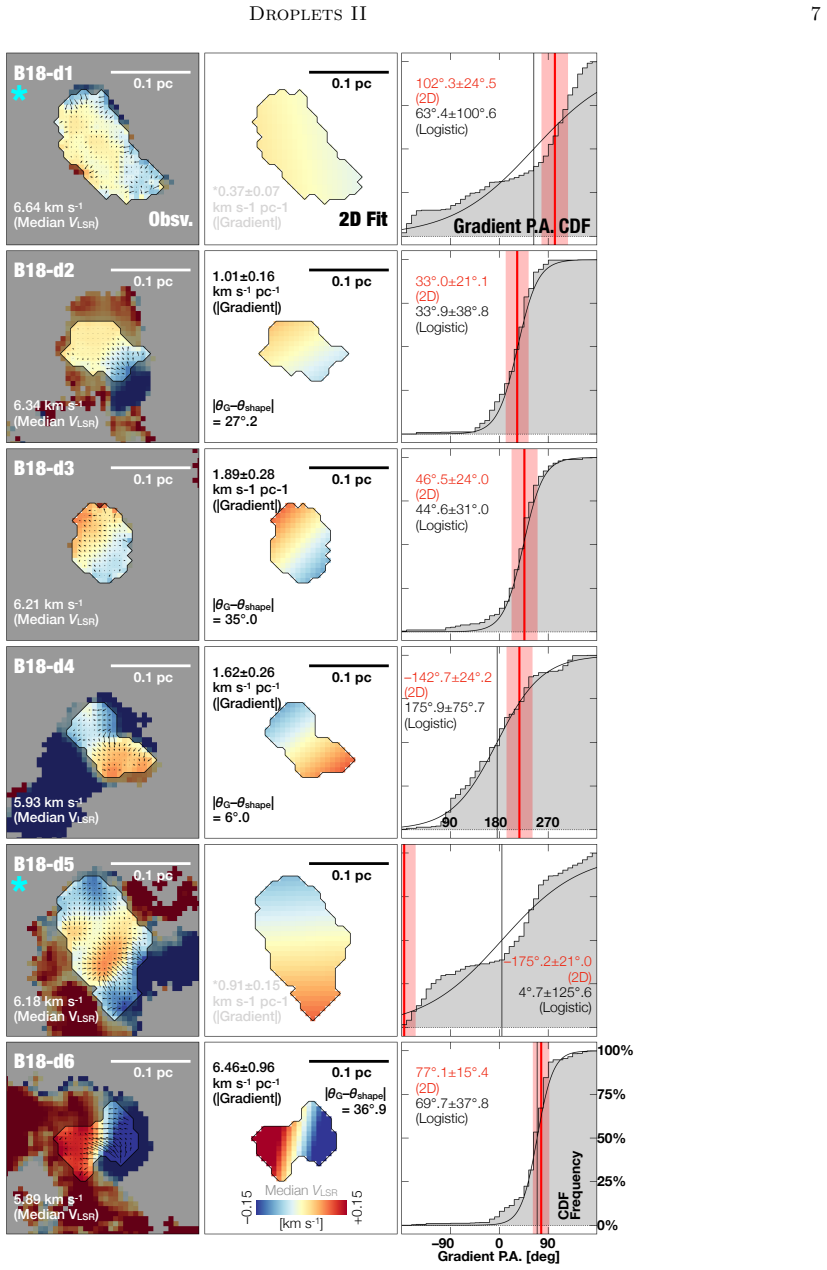
Significance. If the rotational interpretation holds, the paper extends G93's scaling of core angular momentum down to ~0.02 pc, supports a roughly scale-invariant rotational state with beta well below unity, and provides observationally grounded initial conditions for disk and planet formation models. The paper is transparent and careful: it validates the linear fits with local-gradient CDFs, excludes clearly non-linear or poorly sampled cases explicitly, and includes a pixel-by-pixel integration using Herschel column density maps that relaxes the uniform-density and solid-body assumptions. These are real strengths. However, the central rotation-derived quantities are conditional on the premise that the fitted line-of-sight centroid gradients are dominated by ordered internal rotation. Given the small sample (13 droplets after exclusions) and the modest number of independent beams across each droplet, the rotational interpretation is not uniquely established; the derived beta and J/M values are inclination-limited and partly inherited from the assumed relation between gradient, radius, and angular momentum.
major comments (3)
- [§3.1, Table 1, Figs. 1-3] The load-bearing premise is that the fitted 2D plane (Eq. 1) measures ordered internal rotation. The paper itself notes in §3.1 that turbulence, infall, outflows, and beam effects can contribute, and a typical droplet radius of ~0.04 pc corresponds to only ~2 GBT beams (32 arcsec at ~137 pc), so the centroid map contains roughly four independent beams across the diameter. The CDF validation excludes clearly non-linear structures but does not quantify how much of the fitted gradient could be produced by the beam-smoothed ambient cloud gradient or by noise. Please add a quantitative control: for example, compare fitted droplet gradients with gradients fitted to off-source or surrounding regions, or use synthetic velocity maps to show that a pure turbulent field with the same beam and noise would not reproduce the observed gradient magnitudes and scatter. Without such a control, the reported beta is an inclination-limited estimator of the line-of-sight gradient, not an established rotational energy ratio.
- [§3.2, Eq. (6)] The J/M-R relation in Eq. (6) is not an independent scaling measurement: with sin i = 1, J/M = (2/5)|G| R^2 (Eqs. 3-5), so the fitted slope 1.55 ± 0.20 is algebraically 2 minus the fitted |G|-R slope 0.45 from §3.1 (Fig. 4a). The paper concedes that the relation is 'partly due to the fact that J/M is a power-law function of the radius,' but the abstract and conclusions present Eq. (6) as an empirical result and compare it to the turbulent expectation J/M ∝ R^1.5. Please reframe Eq. (6) as a derived quantity, state explicitly that its slope is set by the assumed functional form together with the measured |G|-R relation, and propagate the covariance between the two fitted power laws into the reported uncertainties. The agreement with the turbulent scaling is then not evidence for rotation, as the paper itself later notes.
- [§3.4, Eq. (12) and Fig. 11] The pixel-by-pixel integration is a useful robustness test for the density weighting, but it does not break the degeneracy between ordered rotation and non-rotational contributions. Equation (12) still assigns the fitted line-of-sight velocity V_fit,i as the rotational velocity at each pixel, assumes sin i = 1, and fixes the rotation axis perpendicular to the fitted gradient. Consequently, the steeper pixel-by-pixel J_tot/M-R relation (slope ~2.08) is also consistent with a turbulent velocity field under a Larson-type scaling, as the paper notes in §4. Please state explicitly that this test validates the treatment of the column density but does not validate the rotational interpretation, and that the pixel-by-pixel values are not independent of the plane-fit assumption that they are meant to test.
minor comments (4)
- [§3.3, Eq. (9) and §4] Since sin i = 1 is adopted, the reported beta values are lower limits on the true rotational-to-gravitational energy ratio (beta ∝ 1/sin^2 i). Please state this explicitly wherever the values 0.046 and 0.039 appear, rather than only noting that sin i = 1 gives a lower limit on the angular velocity.
- [§3.5, Eq. (14)] The histogram shape parameter xi is based on a small number of objects (Nc = 15, Ne = 9 in the combined sample). Please provide a bootstrap confidence interval on xi, since the paper's text already notes that the small number of cores can bias the result.
- [Figure 4 caption] In the caption for panel (b), the black line is said to show a power-law relation between the velocity gradient and the effective radius, but panel (b) plots velocity gradient against mass; this should be corrected to refer to mass.
- [§3.1 and Eq. (11)] Minor typographical and notation issues: 'coefficeints' should be 'coefficients' in §3.1; 'cylindrincal' should be 'cylindrical'; and in Eq. (11) the text says 'Tkin is the kinetic energy,' which appears to be a typo for 'kinetic temperature.'
Circularity Check
The J/M–R scaling (Eq. 6) is algebraically forced by the fitted |G|–R relation under the assumed definition J/M=(2/5)|G|R^2; the paper openly concedes this, so the |G|–R measurement remains the independent core result.
-
self definitional
[§3.2 (Eqs. 3–6) and §3.1 (|G|–R fit), with acknowledgment in §3.2 and §5]
"Using Equation 5, we find a typical value of J/M = ... For both the droplets and the dense cores, we find J/M = 10−0.72±0.20 (R/1pc)1.55±0.20 km s−1 pc, (6) ... However, as G93 has noticed, the seemingly tight power-law relation between J/M and the radius is partly due to the fact that J/M is a power-law function of the radius (Equation 5)."
Equation 5 defines J/M = (2/5)ωR^2, and Equation 3 gives ω=|G| after adopting sin i=1, so J/M = (2/5)|G|R^2. The |G|–R relation was already fitted in §3.1 as |G|∝R^{−0.45±0.13}. Substituting gives J/M ∝ R^{2−0.45}=R^{1.55±0.20}, exactly Eq. 6. Thus Eq. 6 is not an independently measured angular-momentum scaling: its exponent and tightness are the algebraic image of the input |G|–R fit under the assumed solid-body/uniform-density definition. Presenting it as 'we find' and as extending G93 is therefore a definitional consequence rather than a new test. The paper explicitly acknowledges this ('partly due to...'), so this is a disclosed, partial construction, not a concealed one.
full rationale
The primary empirical measurement in the paper—the |G|–R power law fitted to droplets and G93 cores (Fig. 4)—is independent of the rotational assumptions; it is a fit to VLSR centroid gradients. The J/M–R relation is then obtained by inserting that fitted relation into a definition, so it is forced by construction. The same is true, to a lesser degree, of β: with ω=|G| and the Paper I M–R relation (M∝R^2.4), β∝|G|^2R^3/M∝R^{−0.3}, so the claimed near-size-independence is roughly but not exactly encoded; I do not count it as a separate defining step. The paper is also explicit about the fragility of the rotation interpretation (§3.1 lists turbulence, infall, outflows, and beam effects; §3.4 gives a pixel-by-pixel alternative), so the rotation assumption is a caveat rather than a circularity. Paper I self-citations supply the droplet catalog, masses, and radii, but these are separate observational products, not the target results, and no load-bearing uniqueness claim is imported. Therefore the only concrete circularity is the algebraic forcing of Eq. 6, which is acknowledged. Score 4: partial, disclosed construction; the |G|–R finding retains independent content.
Assumptions & free parameters
free parameters (3)
- Power-law slope p of |G| vs R_eff =
-0.45 ± 0.13
- Power-law slope s of J/M vs R_eff (Eq. 6) =
1.55 ± 0.20
- Power-law slope of pixel-by-pixel J_tot/M vs R_eff =
2.08
assumptions (6)
- standard math Solid-body rotation formulas for a uniform-density sphere: I = (2/5)MR^2, E_rot = (1/5)MR^2ω^2, Ω_G = -(3/5)GM^2/R (Eqs. 4, 7, 8)
- domain assumption The fitted line-of-sight velocity gradient is interpreted as rotation with inclination sin i = 1 (Eq. 3)
- domain assumption Observed VLSR gradients represent a 'net rotational motion' rather than pure turbulence, infall, or larger-scale flow (Eqs. 1-2)
- domain assumption Single-Gaussian decomposition of NH3 (1,1) and (2,2) spectra in GAS DR1
- domain assumption Herschel column density assumptions: κ_ν0 = 0.1 cm^2/g, emissivity index β = 1.62, mean molecular weight 2.8 u
- domain assumption Distances of 137.3 pc for L1688 and 135 pc for B18
Cite this review
Pith. "Pith review of Droplets II: Internal Velocity Structures and Potential Rotational Motions in Pressure-dominated Coherent Structures." pith.science (2026). https://pith.science/paper/X4Q6JZKW
@misc{pith2026190804367,
  author       = {Pith},
  title        = {Pith review of: Droplets II: Internal Velocity Structures and Potential Rotational Motions in Pressure-dominated Coherent Structures},
  year         = {2026},
  howpublished = {\url{https://pith.science/paper/X4Q6JZKW}},
  note         = {Machine review of arXiv:1908.04367}
}
abstract
We present an analysis of the internal velocity structures of the newly identified sub-0.1 pc coherent structures, droplets, in L1688 and B18. By fitting 2D linear velocity fields to the observed maps of velocity centroids, we determine the magnitudes of linear velocity gradients and examine the potential rotational motions that could lead to the observed velocity gradients. The results show that the droplets follow the same power-law relation between the velocity gradient and size found for larger-scale dense cores. Assuming that rotational motion giving rise to the observed velocity gradient in each core is a solid-body rotation of a rotating body with a uniform density, we derive the "net rotational motions" of the droplets. We find a ratio between rotational and gravitational energies, $\beta$, of $\sim 0.046$ for the droplets, and when including both droplets and larger-scale dense cores, we find $\beta \sim 0.039$. We then examine the alignment between the velocity gradient and the major axis of each droplet, using methods adapted from the histogram of relative orientations (HRO) introduced by Soler et al. (2013). We find no definitive correlation between the directions of velocity gradients and the elongations of the cores. Lastly, we discuss physical processes other than rotation that may give rise to the observed velocity field.
Figures
Figures from the paper (9 more)


Forward citations
Cited by 1 Pith paper
-
Preferential alignment of Class 0, Class I protostellar disks in multiple systems across nine nearby molecular clouds
Disks around young stars in binary and higher-order multiple systems are preferentially aligned out to 6000 AU, implying turbulent fragmentation alone cannot explain how most multiples form.
Reference graph
Works this paper leans on
-
[1]
Allen, A., Li, Z.-Y., & Shu, F. H. 2003, ApJ, 599, 363, doi: 10.1086/379243 Andr´ e, P., Di Francesco, J., Ward-Thompson, D., et al. 2014, Protostars and Planets VI, 27, doi: 10.2458/azu uapress 9780816531240-ch002 Andr´ e, P., Men’shchikov, A., Bontemps, S., et al. 2010, A&A, 518, L102
doi:10.1086/379243 2003
-
[2]
1984, PhD thesis, UNIVERSITY OF MASSACHUSETTS
Arquilla, R. 1984, PhD thesis, UNIVERSITY OF MASSACHUSETTS
work page 1984
-
[3]
Arquilla, R., & Goldsmith, P. F. 1985, ApJ, 297, 436, doi: 10.1086/163542 —. 1986, ApJ, 303, 356, doi: 10.1086/164082
doi:10.1086/163542 1985
-
[4]
2013, A&A, 553, A119, doi: 10.1051/0004-6361/201220822
Arzoumanian, D., Andr´ e, P., Peretto, N., & K¨ onyves, V. 2013, A&A, 553, A119, doi: 10.1051/0004-6361/201220822
-
[5]
Banerjee, R., & Pudritz, R. E. 2006, ApJ, 641, 949, doi: 10.1086/500496
-
[6]
2015, in Astronomical Society of the Pacific Conference Series, Vol
Beaumont, C., Goodman, A., & Greenfield, P. 2015, in Astronomical Society of the Pacific Conference Series, Vol. 495, Astronomical Data Analysis Software an Systems XXIV (ADASS XXIV), ed. A. R. Taylor & E. Rosolowsky, 101
work page 2015
-
[7]
Benson, P. J., & Myers, P. C. 1989, ApJS, 71, 89, doi: 10.1086/191365
doi:10.1086/191365 1989
-
[8]
Bonnor, W. B. 1956, MNRAS, 116, 351, doi: 10.1093/mnras/116.3.351
Show all 47 references
-
[9]
2000, ApJ, 543, 822, doi: 10.1086/317122
Burkert, A., & Bodenheimer, P. 2000, ApJ, 543, 822, doi: 10.1086/317122
2000 doi
-
[10]
Chen, C.-Y., & Ostriker, E. C. 2018, ApJ, 865, 34, doi: 10.3847/1538-4357/aad905 22 Chen et al
2018 doi
-
[11]
H.-H., Pineda, J
Chen, H. H.-H., Pineda, J. E., Goodman, A. A., et al. 2019, ApJ, 877, 93, doi: 10.3847/1538-4357/ab1a40
2019 doi
-
[12]
E., et al
Dib, S., Hennebelle, P., Pineda, J. E., et al. 2010, ApJ, 723, 425, doi: 10.1088/0004-637X/723/1/425
2010 doi
-
[13]
P., Juhasz, A., Pohl, A., et al
Dullemond, C. P., Juhasz, A., Pohl, A., et al. 2012, RADMC-3D: A multi-purpose radiative transfer tool, Astrophysics Source Code Library. http://ascl.net/1202.015
2012
-
[14]
K., Di Francesco, J., Shirley, Y
Friesen, R. K., Di Francesco, J., Shirley, Y. L., & Myers, P. C. 2009, ApJ, 697, 1457, doi: 10.1088/0004-637X/697/2/1457
2009 doi
-
[15]
K., Pineda, J
Friesen, R. K., Pineda, J. E., co-PIs, et al. 2017, ApJ, 843, 63, doi: 10.3847/1538-4357/aa6d58
2017 doi
-
[16]
2011, PySpecKit: Python Spectroscopic Toolkit, Astrophysics Source Code Library
Ginsburg, A., & Mirocha, J. 2011, PySpecKit: Python Spectroscopic Toolkit, Astrophysics Source Code Library. http://ascl.net/1109.001
2011
-
[17]
F., & Arquilla, R
Goldsmith, P. F., & Arquilla, R. 1985, in IN: Protostars and planets II (A86-12626 03-90). Tucson, AZ, University of Arizona Press, 1985, p. 137-149. Research supported by the Observatoire de Paris and NSF., 137–149
1985
-
[18]
A., Barranco, J
Goodman, A. A., Barranco, J. A., Wilner, D. J., & Heyer, M. H. 1998, ApJ, 504, 223, doi: 10.1086/306045
1998 doi
-
[19]
A., Benson, P
Goodman, A. A., Benson, P. J., Fuller, G. A., & Myers, P. C. 1993, ApJ, 406, 528, doi: 10.1086/172465
1993 doi
-
[20]
2013, A&A, 554, A55, doi: 10.1051/0004-6361/201220090
Hacar, A., Tafalla, M., Kauffmann, J., & Kov´ acs, A. 2013, A&A, 554, A55, doi: 10.1051/0004-6361/201220090
2013 doi
-
[21]
Hildebrand, R. H. 1983, QJRAS, 24, 267
1983
-
[22]
G., & Whitworth, A
Hosking, J. G., & Whitworth, A. P. 2004, MNRAS, 347, 994, doi: 10.1111/j.1365-2966.2004.07273.x Kauffmann, J., Bertoldi, F., Bourke, T. L., Evans, II, N. J., & Lee, C. W. 2008, A&A, 487, 993, doi: 10.1051/0004-6361:200809481
2004
-
[23]
K., Pineda, J
Kirk, H., Friesen, R. K., Pineda, J. E., et al. 2017, ApJ, 846, 144, doi: 10.3847/1538-4357/aa8631
2017 doi
-
[24]
F., Myers, P
Ladd, E. F., Myers, P. C., & Goodman, A. A. 1994, ApJ, 433, 117, doi: 10.1086/174629
1994 doi
-
[25]
S., Norman, M
Li, P. S., Norman, M. L., Mac Low, M.-M., & Heitsch, F. 2004, ApJ, 605, 800, doi: 10.1086/382652
2004 doi
-
[26]
2011, ApJ, 738, doi: 10.1088/0004-637X/738/2/180
Li, Z.-Y., Krasnopolsky, R., & Shang, H. 2011, ApJ, 738, doi: 10.1088/0004-637X/738/2/180
2011 doi
- [27]
-
[28]
F., & Ostriker, E
McKee, C. F., & Ostriker, E. C. 2007, ARA&A, 45, 565, doi: 10.1146/annurev.astro.45.051806.110602
2007 arXiv
-
[29]
E., Liu, H
Monsch, K., Pineda, J. E., Liu, H. B., et al. 2018, ApJ, 861, 77, doi: 10.3847/1538-4357/aac8da
2018 doi
-
[30]
Myers, P. C. 2009, ApJ, 700, 1609, doi: 10.1088/0004-637X/700/2/1609 Offner, S. S. R., Klein, R. I., & McKee, C. F. 2008, ApJ, 686, 1174, doi: 10.1086/590238 Ortiz-Le´ on, G. N., Loinard, L., Kounkel, M. A., et al. 2017, ApJ, 834, 141, doi: 10.3847/1538-4357/834/2/141
2009 doi
-
[31]
2014, Protostars and Planets VI, 77, doi: 10.2458/azu uapress 9780816531240-ch004
Padoan, P., Federrath, C., Chabrier, G., et al. 2014, Protostars and Planets VI, 77, doi: 10.2458/azu uapress 9780816531240-ch004
2014 doi
-
[32]
M., et al
Pattle, K., Ward-Thompson, D., Kirk, J. M., et al. 2015, MNRAS, 450, 1094, doi: 10.1093/mnras/stv376
2015 doi
-
[33]
E., Goodman, A
Pineda, J. E., Goodman, A. A., Arce, H. G., et al. 2010, ApJL, 712, L116, doi: 10.1088/2041-8205/712/1/L116
2010 doi
-
[34]
E., Zhao, B., Schmiedeke, A., et al
Pineda, J. E., Zhao, B., Schmiedeke, A., et al. 2019, arXiv e-prints, arXiv:1906.05578. https://arxiv.org/abs/1906.05578
2019 arXiv
-
[35]
E., Offner, S
Pineda, J. E., Offner, S. S. R., Parker, R. J., et al. 2015, Nature, 518, 213, doi: 10.1038/nature14166 Planck Collaboration, Abergel, A., Ade, P. A. R., et al. 2014, A&A, 571, A11, doi: 10.1051/0004-6361/201323195 Planck Collaboration, Ade, P. A. R., Aghanim, N., et al. 2016, ...
2015 doi
-
[36]
2017, glueviz v0.13.1: multidimensional data exploration glueviz v0.13.1: multidimensional data exploration, doi: 10.5281/zenodo.1237692
Goodman, A. 2017, glueviz v0.13.1: multidimensional data exploration glueviz v0.13.1: multidimensional data exploration, doi: 10.5281/zenodo.1237692. https://doi.org/10.5281/zenodo.1237692
2017 doi
-
[37]
2003, ApJ, 599, 258, doi: 10.1086/379166
Rosolowsky, E., Engargiola, G., Plambeck, R., & Blitz, L. 2003, ApJ, 599, 258, doi: 10.1086/379166
2003 doi
-
[38]
W., Pineda, J
Rosolowsky, E. W., Pineda, J. E., Foster, J. B., et al. 2008a, ApJS, 175, 509, doi: 10.1086/524299
-
[39]
Goodman, A. A. 2008b, ApJ, 679, 1338, doi: 10.1086/587685 Schlafly, E. F., Green, G., Finkbeiner, D. P., et al. 2014, ApJ, 786, 29, doi: 10.1088/0004-637X/786/1/29
2014 doi
-
[40]
Pudritz, R. E. 2011, MNRAS, 417, 1054, doi: 10.1111/j.1365-2966.2011.19320.x
2011
-
[41]
E., & Klessen, R
Seifried, D., Banerjee, R., Pudritz, R. E., & Klessen, R. S. 2012, MNRAS, 423, L40, doi: 10.1111/j.1745-3933.2012.01253.x
2012
-
[42]
H., Adams, F
Shu, F. H., Adams, F. C., & Lizano, S. 1987, Annual Review of Astronomy and Astrophysics, 25, 23, doi: 10.1146/annurev.aa.25.090187.000323
1987
-
[43]
D., Hennebelle, P., Martin, P
Soler, J. D., Hennebelle, P., Martin, P. G., et al. 2013, ApJ, 774, doi: 10.1088/0004-637X/774/2/128
2013 doi
-
[44]
W., Dunham, M
Stephens, I. W., Dunham, M. M., Myers, P. C., et al. 2018, ApJS, 237, 22, doi: 10.3847/1538-4365/aacda9
2018 doi
-
[45]
2015, A&A, 574, A104, doi: 10.1051/0004-6361/201424576 Droplets II 23
Tafalla, M., & Hacar, A. 2015, A&A, 574, A104, doi: 10.1051/0004-6361/201424576 Droplets II 23
2015 doi
-
[46]
C., Caselli, P., & Walmsley, C
Tafalla, M., Myers, P. C., Caselli, P., & Walmsley, C. M. 2004, A&A, 416, 191, doi: 10.1051/0004-6361:20031704 The Astropy Collaboration, Price-Whelan, A. M., Sip˝ ocz, B. M., et al. 2018, ArXiv e-prints. https://arxiv.org/abs/1801.02634
2004 arXiv
-
[47]
S., Schlafly, E
Zucker, C., Speagle, J. S., Schlafly, E. F., et al. 2019, arXiv e-prints, arXiv:1902.01425. https://arxiv.org/abs/1902.01425
2019 arXiv
Reviewed August 14, 2026 · model on record in the stance chip above.
Discussion (0). Continue with ORCID to comment.