REVIEW 3 major objections 5 minor 15 references
Zero Black-Derman-Toy interest rate model
T0 review · 3 major / 5 minor · reviewed 2026-08-14 · deepseek-v4-flash
Pith's one-line read This paper proposes a modified Black-Derman-Toy tree that lets interest rates jump to a near-zero crisis zone, and claims this allows pricing high-strike bond options that standard BDT cannot price.
desk verdict A clean, useful discrete-time ZIRP extension of BDT with correct calibration math, but the empirical section does not support the 'more accurate' claim and even contains an internal contradiction. read the letter →
The pith
A machine-rendered reading of the paper's core claim, the machinery that carries it, and where it could break.
The reading
What carries the argument
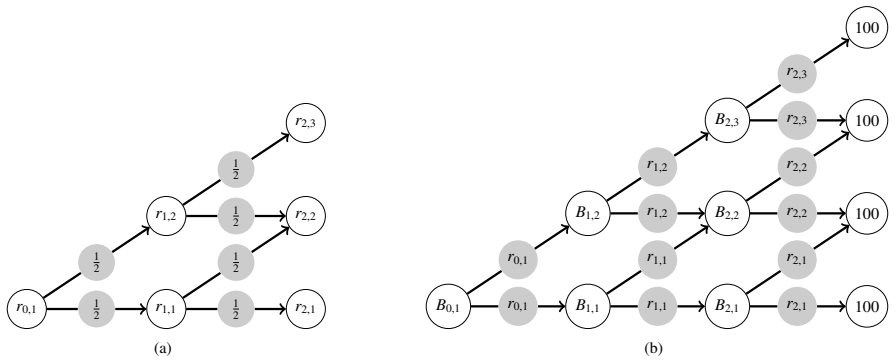
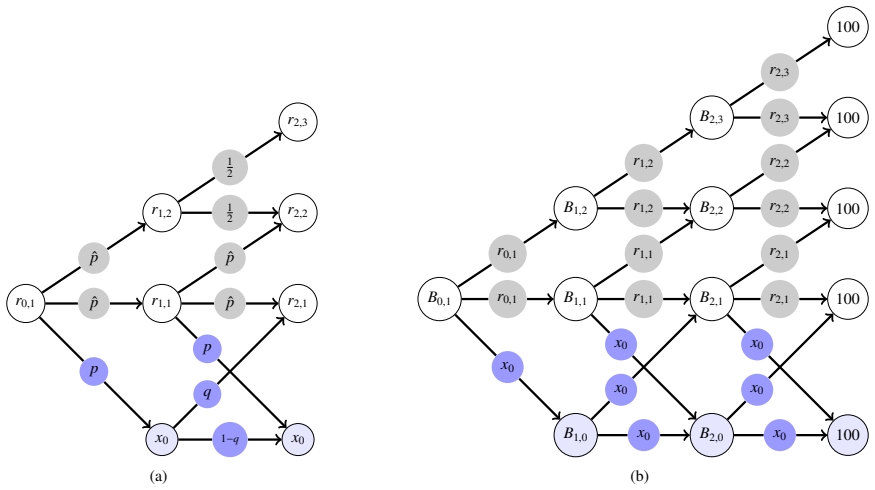
The key machinery is the ZBDT tree, a mixed binary-ternary tree: all ordinary nodes branch up/down with probability 1/2, while the lowest node at each time level (j=1) has three branches—up, down, and a jump to the ZIRP zone with probability p, where the remaining probability is split as (1-p)/2. Calibration proceeds level by level, matching the observed yield curve and yield volatilities; the variance equations for the three-branch nodes use the logarithmic ratios l_u = log(y_u/y_0) and l_d = log(y_d/y_0), giving the variance formula in equation (4). Bond prices are computed backwards through the tree, and option prices are converted to implied volatilities using Black's formula.
What would settle it
Take actual market prices of two-year European call options on five-year US Treasury bonds from one of the six scenarios, calibrate p, q, and x0 to those prices, and check whether the resulting ZBDT option prices and implied volatilities match the market better than BDT; if the fitted parameters are not small or the pricing errors do not shrink, the claim of greater accuracy fails.
Extended reading notes
Core claim
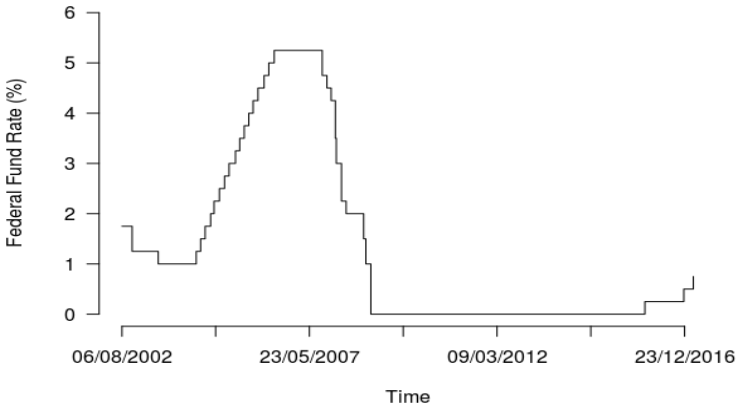
The central discovery is a discrete-time, discrete-state extension of the BDT tree in which, at every level, the lowest regular interest-rate node can jump with small probability p to a fixed near-zero rate x0, the ZIRP zone. Once in that zone, the process remains there with probability 1-q and exits with probability q. The authors provide the modified calibration equations that solve for the tree's interest rates and bond prices using the same inputs as BDT, namely zero-coupon yields and yield volatilities, plus the three hand-set parameters p, q, and x0. They show in six empirical scenarios that this ZBDT model produces nonzero prices for high-strike options (strikes 93-99 on a 100 face-value bond) where BDT gives zero, and that implied volatilities computed with Black's formula are uniformly higher in ZBDT. They interpret these higher implied volatilities as reflecting crisis risk and conclude that ZBDT gives more accurate option prices in pre-crisis periods.
Load-bearing premise
The claim that ZBDT gives more accurate option prices rests on the hand-set choices p=0.02, q=0.07, and x0=0.25%, and on the unmotivated structural rule that only the lowest regular node at each level can jump into the zero-rate zone.
Editorial extensions
If this is right
- The ZBDT model produces strictly positive prices for high-strike bond options where BDT returns zero, so it can be used to price out-of-the-money options written near the face value of a bond.
- Implied volatilities from the ZBDT model are higher than those from BDT in every scenario studied, meaning the model embeds an additional crisis-risk premium.
- The model provides a calibration tool: from observed bond option prices one can in principle fit the crisis probability p and recovery probability q.
- The calibration uses the same inputs as BDT, so existing BDT implementations can be extended to ZBDT without requiring new market data.
- If the model is correct, it offers a discrete-time alternative to continuous-time ZIRP models, making crisis-risk pricing accessible to tree-based fixed-income practice.
Reading between the lines
- A natural next step that the paper leaves implicit is to estimate p, q, and x0 from market option prices rather than fixing them; the paper's own empirical comparison fixes these parameters and never compares against actual market option prices.
- The structural choice that only the lowest regular node at each level can jump to the ZIRP zone is an unmotivated modeling assumption; allowing all nodes to jump would test whether the uniformly higher implied volatilities survive under a more symmetric crisis mechanism.
- The same tree machinery could be applied to other fixed-income derivatives such as caps, floors, and swaptions, where a rare jump to a zero-rate zone would similarly affect high-strike pricing behavior.
- A continuous-time analog of this discrete jump-to-zero model might connect to sticky-boundary or skew-diffusion ZIRP models, though the paper does not construct such a limit.
Signed reviews
Editorial analysis
A structured set of objections, weighed in public.
Referee Report
Summary. The paper proposes a modification of the Black-Derman-Toy interest rate tree, called ZBDT, in which each lowest regular node can jump with small probability p into a near-zero-rate ``ZIRP zone''; while in that zone the rate stays at x0 with probability 1-q and recovers with probability q. The authors derive modified calibration equations, calibrate both BDT and ZBDT to US Treasury yield data in six scenarios covering 2002-2017, and report European call option prices and Black implied volatilities for a five-year zero-coupon bond. They conclude that ZBDT prices high-strike options that BDT cannot price, that implied volatilities are higher in ZBDT, and that this gives more accurate option prices in pre-crisis periods.
Significance. The model construction is clear and plausible, and the three-branch variance formula in Eq. (4) is algebraically correct. If the parameters p, q, and x0 were calibrated to market data or estimated from observed option prices, the ZBDT tree could provide a simple discrete-time tool for pricing bonds and derivatives under crisis risk. The explicit calibration equations and the six empirical scenarios are useful. However, the paper's central empirical claim of more accurate option prices is not supported: no market option prices are used as a benchmark, the three new parameters are set by hand, and the reported differences between BDT and ZBDT mainly reflect the mechanical addition of a jump state. As it stands, the paper is an illustrative modeling exercise with overreaching conclusions rather than a demonstrated improvement.
major comments (3)
- [Section 4.2 and Section 5] The claim that ZBDT ``gives more accurate option prices in pre-crisis periods'' is not supported by the evidence. The comparison in Tables 3, 5, 7, 9, 11, and 13 is between BDT and ZBDT only, with p=0.02, q=0.07, and x0=0.25% set by hand in Section 4.2, and no market option prices or statistical benchmark are provided. The higher implied volatilities in ZBDT follow mechanically from adding a positive-probability jump to a near-zero rate, which increases the variance of the underlying bond price; this does not demonstrate accuracy. To justify the accuracy claim the authors would need to calibrate p, q, and x0 to market option data and compare pricing errors, or alternatively restrict the conclusion to a model-comparison statement.
- [Section 5 and Table 13] The statement in the conclusions that ``all of the observed implied volatilities are higher in the ZBDT model than in the BDT model'' is contradicted by the paper's own Table 13 (Scenario VI): at strikes 80 and 81 the BDT and ZBDT prices and implied volatilities are identical to four decimals (11.1312 vs 11.1312 with volatility 1.6207, and 10.1562 vs 10.1562 with volatility 1.5959). These deep-in-the-money options are always exercised, so the model difference disappears. The claim should be corrected to ``higher or equal'' and the caveat acknowledged.
- [Section 3.1] The calibration algorithm is not fully specified, which makes the numerical results hard to reproduce. The recursion for the lowest regular node is written as ``Bi,1 = 1/(1+ri,j)...'' with j undefined; it should presumably be ri,1. In addition, the general-n calibration equations introduce yu and yd through Bu and Bd and impose two variance relations, one involving yu, yd, and y0, and another involving r_{n-1,1}, r_{n-1,2}, and x0, but the text does not state how yu and yd are computed from the candidate rates or how the nonlinear system is solved (initial values, iteration, existence or uniqueness). Section 3 also refers to ``nodes of the form (1,j)'' when the intended meaning appears to be nodes with j=1. Please specify the algorithm completely and, ideally, provide pseudo-code or code.
minor comments (5)
- [Section 4.1] The text says ``the factor 252 corresponds to the number of business day of one year''; this should be ``business days.''
- [Section 5] There is a typo in ``the ZIRP models allows u to price options with high strikes''; it should be ``allows us.''
- [Tables 3, 5, 7, 9, 11, 13] The column header ``v'' is not defined in the tables; it would be helpful to state explicitly that v denotes the Black implied volatility.
- [Abstract and Section 1.2] The abstract says the model ``provides a tool to calibrate the probability of this event,'' but the empirical section does not calibrate p; the authors either need to include a calibration exercise or rephrase this claim.
- [References] Several references have formatting issues, such as ``V ol 3'' and inconsistent comma usage; these should be cleaned up before publication.
Circularity Check
No circularity in the derivation; the empirical 'more accurate' claim is unvalidated and is a support problem, not a circular one.
full rationale
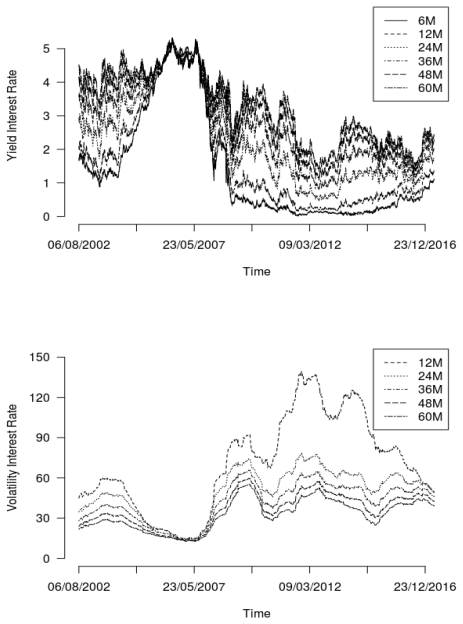
The paper's derivation chain is self-contained. The yield curve y(k) and yield volatilities beta(k) are explicit data inputs, and both BDT and ZBDT calibration equations are designed to reproduce those inputs; matching the term structure is therefore calibration, not an independent prediction. The ZBDT option prices and implied volatilities are outputs of the calibrated tree using Black's formula, not fitted parameters renamed as predictions. The ZBDT-specific parameters p=0.02, q=0.07, x0=0.25% are exogenously fixed in Section 4.2 and are not calibrated to the option prices reported, so the high-strike option prices are not statistically forced by a fit to those same prices. No load-bearing self-citation or imported uniqueness theorem appears; citations to Lewis (2016) and Duffie-Singleton (1999) are motivational, not used as unexamined premises. The main weakness is not circularity but missing empirical support: Section 5 states 'This gives more accurate option prices in pre-crisis periods', but no market option prices are used as a benchmark, so the claim is unfalsified rather than independently demonstrated. Additionally, the statement 'All of the observed implied volatilities are higher in the ZBDT model than in the BDT model' is contradicted by the paper's own Table 13, where BDT and ZBDT implied volatilities are identical for strikes 80 and 81 in Scenario VI. These are evidentiary and consistency issues, not circular reductions of the derivation to its inputs.
Assumptions & free parameters
free parameters (3)
- p (crisis jump probability) =
0.02
- q (recovery probability from ZIRP) =
0.07
- x0 (ZIRP interest rate) =
0.25%
assumptions (4)
- domain assumption Local interest rate variance is constant across nodes at the same time period
- domain assumption The tree is calibrated to the observed yield curve and historical yield volatilities under the risk-neutral measure
- ad hoc to paper Jump to zero can only occur from the lowest regular node at each level (nodes with j=1)
- ad hoc to paper Once in the ZIRP zone, the process stays with probability 1-q and recovers with probability q
invented entities (1)
-
ZIRP zone (zero interest rate state, node 0)
independent evidence
Cite this review
Pith. "Pith review of Zero Black-Derman-Toy interest rate model." pith.science (2026). https://pith.science/paper/BXD4T63G
@misc{pith2026190804401,
  author       = {Pith},
  title        = {Pith review of: Zero Black-Derman-Toy interest rate model},
  year         = {2026},
  howpublished = {\url{https://pith.science/paper/BXD4T63G}},
  note         = {Machine review of arXiv:1908.04401}
}
read the original abstract
We propose a modification of the classical Black-Derman-Toy (BDT) interest rate tree model, which includes the possibility of a jump with small probability at each step to a practically zero interest rate. The corresponding BDT algorithms are consequently modified to calibrate the tree containing the zero interest rate scenarios. This modification is motivated by the recent 2008-2009 crisis in the United States and it quantifies the risk of a future crises in bond prices and derivatives. The proposed model is useful to price derivatives. This exercise also provides a tool to calibrate the probability of this event. A comparison of option prices and implied volatilities on US Treasury bonds computed with both the proposed and the classical tree model is provided, in six different scenarios along the different periods comprising the years 2002-2017.
Figures
Figures from the paper (1 more)
Reference graph
Works this paper leans on
-
[1]
(1976), The Pricing of Commodity Contracts
Black, F. (1976), The Pricing of Commodity Contracts. Journal of Financial Economics , V ol 3, pp 167-179
work page 1976
- [2]
-
[3]
Borodin, A. N.; Salminen, P. (2002), Handbook of Brownian motion-facts and formulae. Second edition. Probability and its Applications. Birkhuser Verlag, Basel, 2002
work page 2002
-
[4]
(2006), Interest Rate Models Theory and Practice with Smile, Inflation and Credit
Brigo, D., Mercurio, F. (2006), Interest Rate Models Theory and Practice with Smile, Inflation and Credit. Second Edition Springer Verlag
work page 2006
- [5]
-
[6]
Du ffie, D., Singleton, K. (1999), Modeling Term Structure of Defaultable Bonds.Review of Financial Studies, V ol 12, pp 687-720
work page 1999
-
[7]
Eberlein, E., Gerhart, G. & Grbac, Z. (2018), Multiple Curve L´ evy Forward Price Model Allowing for Negative Interest Rates. Quantitative Finance, V ol 18, Issue 4
work page 2018
-
[8]
(2009), Term Structure Models.Springer Finance
Filipovic, D. (2009), Term Structure Models.Springer Finance
work page 2009
Show all 15 references
-
[9]
(2009) Technical Note No
Hull, J. (2009) Technical Note No. 23. Options, Futures, and Other Derivatives.Options, Futures, and Other Derivatives
2009
-
[10]
(2006), On the Constructions of the Skew Brownian Motion
Lejay, A. (2006), On the Constructions of the Skew Brownian Motion. Probability Surveys, V ol 3, pp 413-466
2006
-
[11]
(2016), Option Valuation under Stochastic Volatility II.Finance Press, Newport Beach, California, USA
Lewis, A. (2016), Option Valuation under Stochastic Volatility II.Finance Press, Newport Beach, California, USA
2016
-
[12]
(2018), An Overview of Post-crisis Term Structure Models.New Methods in Fixed Income Modeling, Springer, pp 85-97
Martin, M. (2018), An Overview of Post-crisis Term Structure Models.New Methods in Fixed Income Modeling, Springer, pp 85-97
2018
-
[13]
(2006), Derivatives Markets
McDonald, R. (2006), Derivatives Markets. Third edition, Pearson Series in Finance, Boston: Addison-Wesley, 2006
2006
-
[14]
(2018), Skew CIR Process, Conditional Characteristic Function, Moments and Bond Pricing
Tian, Y ., Zhang, H. (2018), Skew CIR Process, Conditional Characteristic Function, Moments and Bond Pricing. Applied Mathematics and Computation, V ol 329, pp 230-238. 10
2018
-
[15]
Appendix Scenario I (May 23, 2003): Expanding economy, normal term structure. 100 9.32 91.47 100 8.34 6.56 85.52 93.84 100 6.52 5.30 4.62 82.36 89.95 95.58 100 3.76 3.50 3.36 3.26 82.30 88.42 93.08 96.85 100 1.36 1.54 1.87 2.13 2.29 84.53 89.05 92.44 95.27 97.76 100 100 21.24 ...
2003
Reviewed August 14, 2026 · model on record in the stance chip above.
Discussion (0). Continue with ORCID to comment.