REVIEW 4 major objections 5 minor 62 references
The probability distribution of 3-D shapes of galaxy clusters from 2-D X-ray images
T0 review · 4 major / 5 minor · reviewed 2026-08-14 · deepseek-v4-flash
Pith's one-line read This paper claims that the 3-D shape distribution of 89 galaxy clusters can be recovered from single 2-D X-ray images, using filamentarity stereology.
desk verdict Clever forward model and a possible radial shape trend, but the inverse step is underconstrained and the reported axis ratios lack error bars. read the letter →
The pith
A machine-rendered reading of the paper's core claim, the machinery that carries it, and where it could break.
The reading
What carries the argument
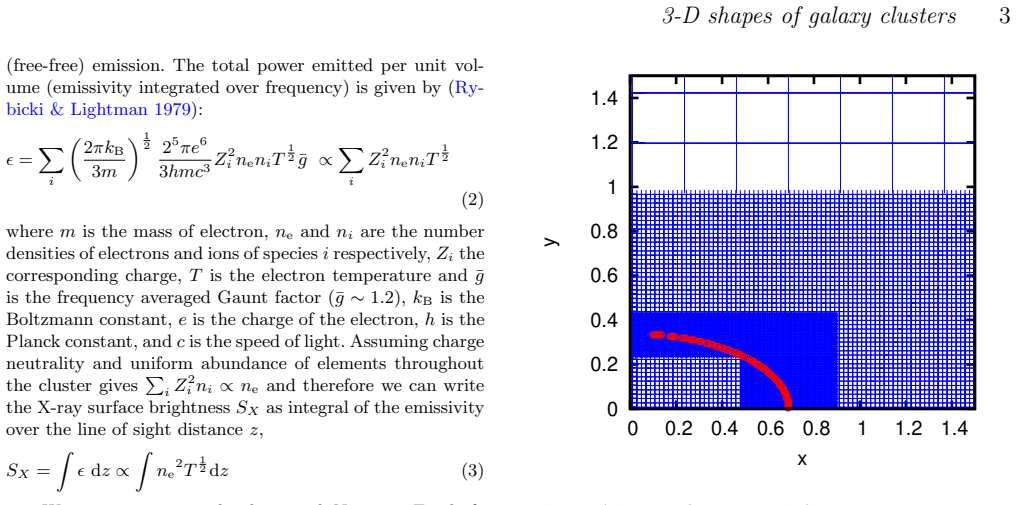
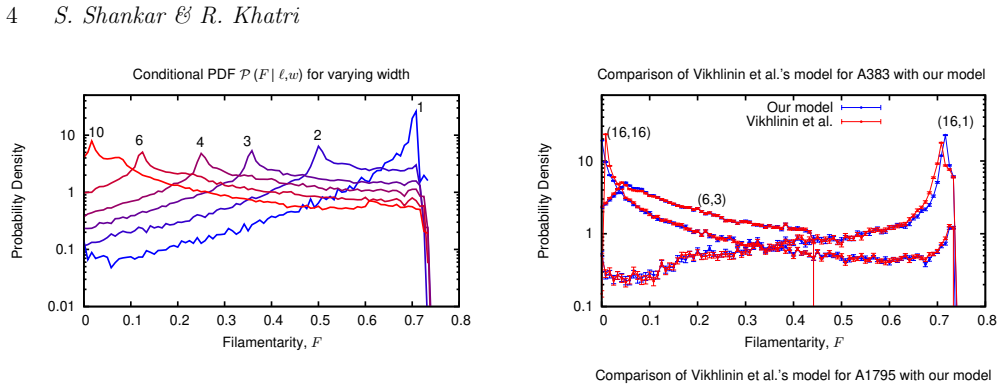
The central object is the filamentarity $F=(P^2-4\pi S)/(P^2+4\pi S)$, a dimensionless shape descriptor built from the perimeter $P$ and area $S$ of an X-ray isocontour, which is 0 for a circle and approaches 1 for a line. For each candidate shape $(\ell,w)$, the authors project a self-similar triaxial ellipsoidal emissivity model (generalized NFW density with a universal temperature profile) from roughly 150,000 isotropically distributed lines of sight, fit an ellipse to each projected isocontour, and thereby build the conditional PDF $P(F|\ell,w)$. The observed filamentarity PDF is then written as a mixture $\sum_i a_i P(F|\ell_i,w_i)$; minimizing chi-square over the weights and shape pairs, or a Monte Carlo point-removal scheme, recovers the shape PDF $P(\ell,w)$. This ratio-symmetric projection library is what converts an ensemble of single 2-D images into a statistical statement about 3-D shapes.
What would settle it
Generate mock X-ray images from cosmological hydrodynamical simulations whose 3-D axis-ratio profiles are known, apply the filamentarity-PDF method to hundreds of projected images, and compare the recovered P(\ell,w) with the input distribution; a systematic mismatch, especially a shift toward the two-shape mixture, would show the self-similar-ellipsoid assumption fails. Alternatively, compare the inferred P(\ell,w) for the same clusters with axis ratios obtained from joint X-ray/SZ/lensing triaxial fits; disagreement beyond the quoted errors would falsify the claim.
Extended reading notes
Core claim
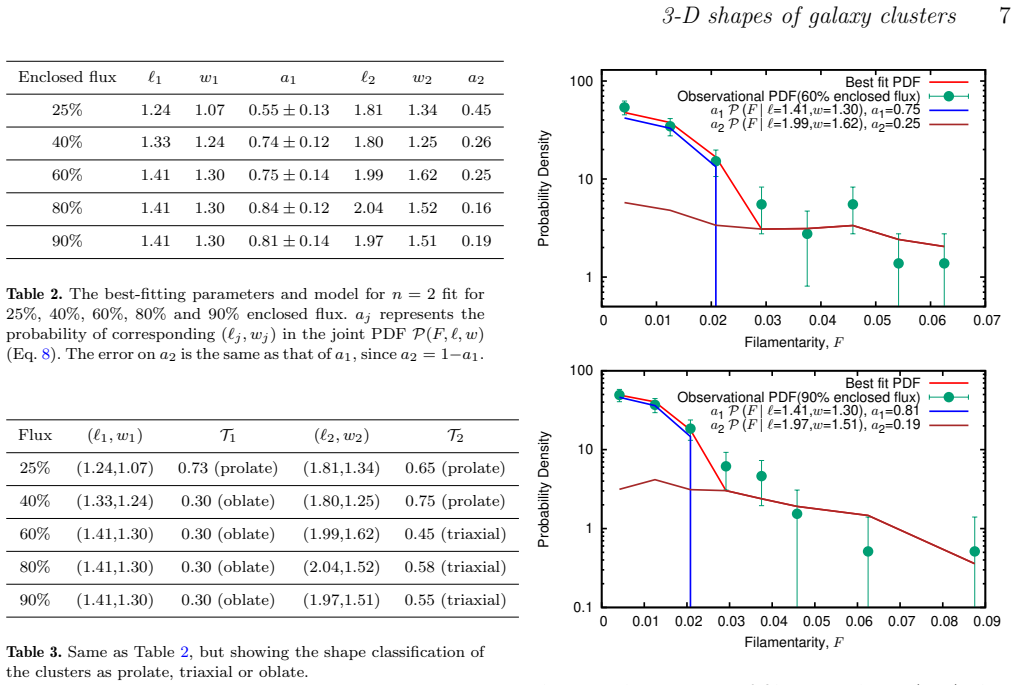
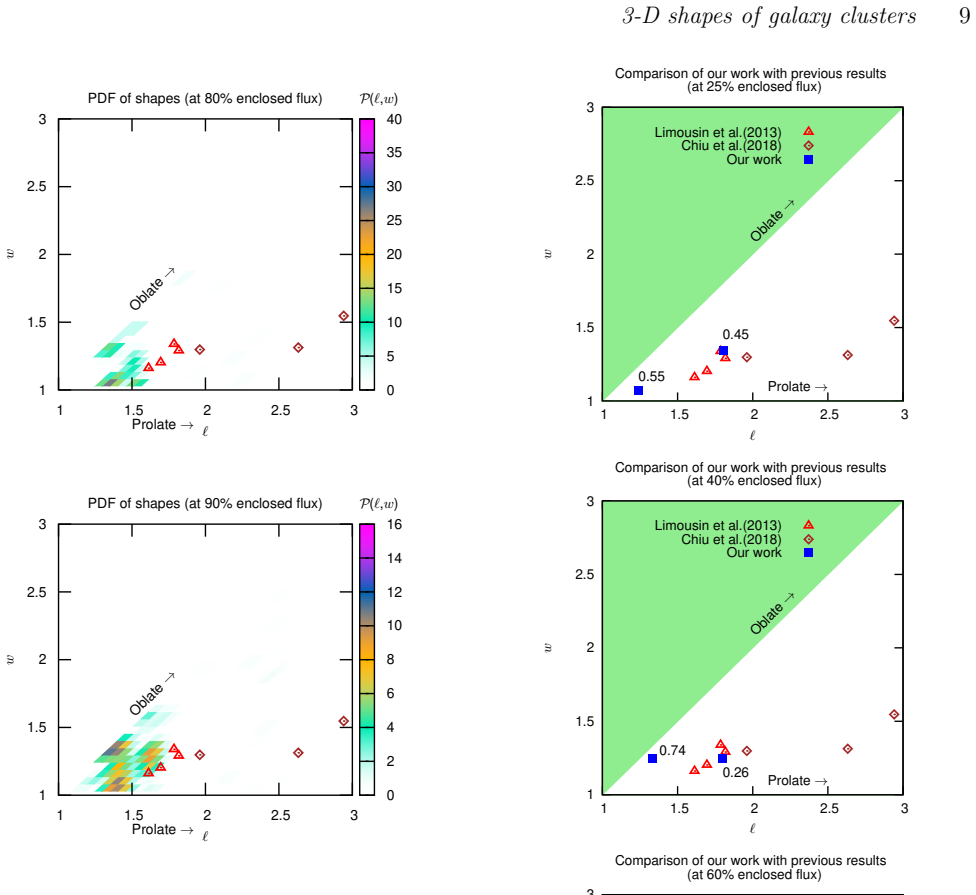
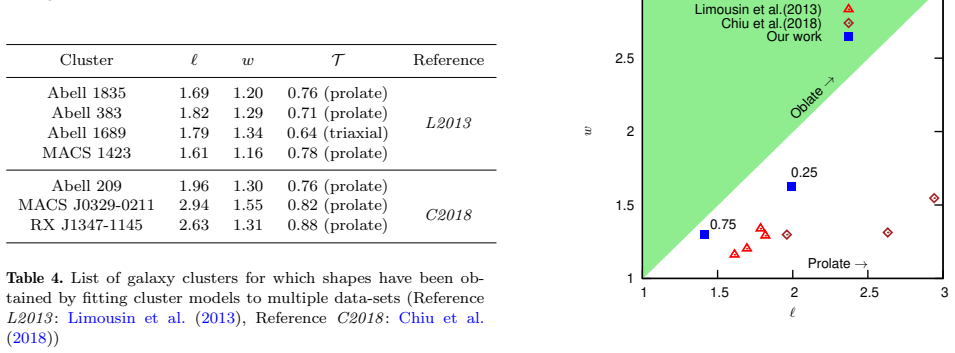
The paper's central claim is that the probability distribution of filamentarity $F$ measured from the X-ray surface-brightness contours of 89 galaxy clusters is adequately described by a superposition of two conditional distributions $P(F|\ell,w)$, i.e. two discrete ellipsoidal shapes, and that the deprojected shape PDF $P(\ell,w)$ describes the X-ray gas as prolate in the inner region and progressively oblate in the outer region. For the 60%, 80%, and 90% enclosed-flux contours, the dominant shape sits at $(\ell,w)=(1.41,1.30)$, corresponding to principal-axis ratios about $1.4:1.3:1$, with weights around 0.75--0.84; a second, less probable more elongated shape contributes to the high-filamentarity tail. The authors further claim the recovered PDF is insensitive to the assumed radial density and temperature profiles, and that the ellipsoidal assumption is not essential to the approach.
Load-bearing premise
The load-bearing assumption is that the X-ray-emitting gas in every cluster is stratified on concentric, similar ellipsoids, so that the emissivity depends on scale radius through a single self-similar coordinate; if real clusters have radially varying axis ratios, twisting isophotes, or non-ellipsoidal substructure, the inferred shape PDF is biased.
Editorial extensions
If this is right
- The observed filamentarity PDF can be matched by two ellipsoidal shapes, so a single average shape is insufficient and cluster shapes must vary from cluster to cluster.
- The recovered shape PDF varies with enclosed flux: the X-ray gas is prolate in the inner parts and shows an oblate preference in the outer parts.
- The method requires only one X-ray (or SZ) image per cluster and a large sample, so it is directly applicable to future surveys of hundreds of thousands of clusters.
- The inferred shape PDF is insensitive to the radial density and temperature profiles used to model the X-ray emission.
- The same formalism extends to non-ellipsoidal shapes and to optical or SZ data, since filamentarity is defined for any contour.
Reading between the lines
- If cluster gas has axis ratios that vary continuously with radius or isophotes that twist, the two-shape mixture would be a projection artifact; a natural stress test is to run the method on simulated clusters with known radial shape profiles.
- Applied to a sample large enough to split by mass or redshift, the shape PDF could map how cluster elongation evolves with cosmic time, something the present 89-cluster sample cannot do.
- The contrast with lensing-based shape measurements suggests baryons and dark matter may have different axis-ratio distributions; that comparison becomes decisive once both methods are applied to the same clusters.
- Because the method treats only the population PDF, it can also serve as a cheap complement to individual-cluster triaxial fits, flagging samples where single-object reconstruction is likely to be biased.
Signed reviews
Editorial analysis
A structured set of objections, weighed in public.
Referee Report
Summary. The paper presents a stereological method to recover the probability distribution of intrinsic triaxial shapes of galaxy clusters from the distribution of filamentarity measured on 2-D X-ray images. A forward library P(F|l,w) is generated by projecting randomly oriented ellipsoids with a generalized NFW emissivity; the observed filamentarity PDF of 89 Chandra clusters is then fitted by a superposition of a small number of delta-function shapes (Eq. 11), and a Monte Carlo variant is used to map the shape PDF. The authors report that two shape components suffice, with a dominant component near (l,w) = (1.41, 1.30), and that the gas is prolate in the inner regions and becomes more oblate/triaxial outward. They claim the method is insensitive to density and temperature profiles and extendable to non-ellipsoidal shapes.
Significance. If the recovered shape PDF were identifiable, the method would be a valuable complement to per-object triaxial fitting: it requires only one band and is computationally cheap, making it scalable to eROSITA-era samples. The forward-model checks in Fig. 4 and the error-propagation appendix are useful, and the presentation is generally clear. However, the central inference is currently undermined by the non-uniqueness of the 1-D-to-2-D inversion and by an internal inconsistency between the assumed self-similar ellipsoidal model and the claimed radial shape variation; these issues must be resolved before the method's scientific results can be accepted.
major comments (4)
- [Section 3.1, Eqs. (8)-(11), Table 2] The inversion from the 1-D filamentarity PDF to the 2-D shape PDF is not identifiable as posed. For a spheroid, P(F|l=w=s) and P(F|l=s,w=1) are identical, because the orientation-averaged projected axis-ratio distribution depends only on the ratio of the unique axis to the circular axes; this is the classical oblate-prolate degeneracy. Consequently, any allocation of probability between the degenerate pair (s,s) and (s,1) leaves P(F) unchanged, so the shape PDF is non-unique even with infinite data. The search over a fixed random grid of 100 points and the delta-function ansatz in Eq. (9) do not address this non-uniqueness, and Table 2 provides errors only on a1, not on the shapes (l1,w1,l2,w2). The claim that the data prefer a dominant oblate component at (1.41,1.30) therefore requires either an identifiability analysis (e.g., mock recovery tests), an explicit and justified prior over P(l,w), or a restriction to identifiable shape combinations.
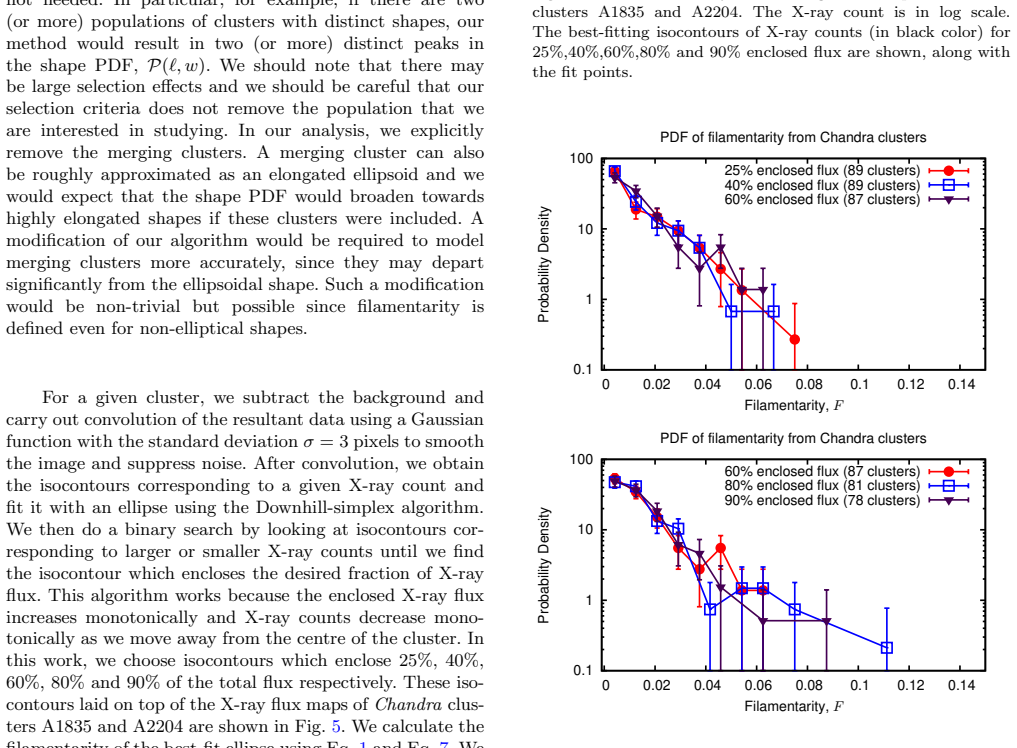
- [Section 2.1 and Section 3, Eqs. (4)-(5), Table 2] Under the assumed self-similar ellipsoidal model, all X-ray isocontours of a cluster have the same projected axis ratio, because the surface brightness depends only on a single quadratic form in the projected coordinates after integrating along the line of sight. The conditional PDFs P(F|l,w) are therefore independent of the enclosed-flux fraction. The differences among the five observed PDFs in Fig. 6, and the different best-fit (l,w) values in Table 2, are thus not predictions of this model; they indicate either that the model is rejected by the data or that the differences are noise. Interpreting the separate fits as evidence for radial variation of the 3-D shape (Section 3.3 and the abstract) is not self-consistent. A radially varying shape requires a forward model in which the axis ratios depend on radius, and a joint fit to all enclosed-flux PDFs.
- [Table 1 and Section 3.1] The claim that n=2 is adequate is not supported by the reported chi^2 values. Table 1 gives chi^2/d.o.f. = 2.61 for the 40% enclosed-flux case and 1.19 for the 25% case at n=2, contradicting the statement that chi^2_min/d.o.f becomes approximately 1 at n=2 for all cases. The decision to prefer n=2 over n=3 at 40% flux is justified only by asserting that chi^2/d.o.f. = 0.07 indicates overfitting; no formal model-selection criterion (AIC, BIC, cross-validation, or posterior model probabilities) is supplied. The absence of uncertainties on l_i and w_i in Table 2 means that even if the model selection were sound, the reported shape values and the prolate-to-oblate radial trend would lack error bars.
- [Section 3.2, Eqs. (14)-(17), Figs. 8-9] The Monte Carlo procedure is not a validated estimator of P(l,w). It greedily removes points from a uniform grid whenever chi^2 improves, so the final density depends on the initial sample, the order of removal, and the stopping rule; no convergence proof or mock-data calibration is given. The uniform sampling of l in [1,2.6] and w in [1,l] imposes a triangular prior that biases the recovered distribution toward larger l, and this prior dependence is not discussed. The resulting density maps in Figs. 8-9 therefore cannot be interpreted as an unbiased estimate of the shape PDF without substantial validation.
minor comments (5)
- [Abstract] The phrase "principle axes" should be "principal axes".
- [Section 2.2, text before Fig. 4] The labels (l=w=16) and (l=16,w=1) are reversed: l=w=16 corresponds to an oblate spheroid and l=16,w=1 to a prolate spheroid.
- [Table 4] The Reference column entries such as "L2013Abell 383" are concatenated and should be separated into the reference key and the cluster name.
- [Section 3 and Appendix A] The number of clusters used decreases from 89 (25% and 40% flux) to 78 (90% flux) after rejecting distorted isocontours; the possible selection bias in the outer-flux PDFs is discussed only qualitatively, and the Appendix A rejection criterion should be applied or justified in the main analysis.
- [Abstract and Section 4] The statement that the method is "directly applicable to non-ellipsoidal shapes" is not demonstrated anywhere in the paper, since the theoretical library P(F|l,w) is built entirely from ellipsoidal projections.
Circularity Check
No significant circularity: the recovered shape PDF is an explicitly fitted inverse-problem output, not a prediction equivalent to its inputs.
full rationale
The paper does not claim to derive the cluster shape PDF from first principles independent of data; it performs a forward-model inversion of an observed filamentarity distribution. The conditional PDFs P(F|l,w) are precomputed from an explicit ellipsoidal emissivity model (Eqs. 2-7, Sec. 2), and the paper explicitly tests the sensitivity of these library PDFs to the assumed density and temperature profiles against Vikhlinin et al. profiles (Fig. 4). These theoretical kernels are not fitted to the Chandra data before use. The observed P_obs(F) is then decomposed into a mixture of these fixed kernels by minimizing chi^2 (Eqs. 9-12, Sec. 3.1), and the output (l_i, w_i, a_i) is presented as the fitted recovery of P(l,w), not as an independent prediction. The only external method citation, Makarenko et al. (2015), introduces filamentarity as a shape descriptor and is not a load-bearing self-citation. The restriction to 100 random (l,w) grid points, the uniform prior on [1,2.6], and the possible projection degeneracy between oblate and prolate shapes are model-selection and identifiability limitations rather than circular reductions: they affect the robustness or interpretation of the fit, but the chain from model kernels to data to fitted shape PDF is not equivalent to its inputs by construction. No circular step is present.
Assumptions & free parameters
free parameters (5)
- a1 (mixture amplitude of dominant shape) =
0.55 to 0.84 depending on enclosed flux
- (l1, w1) and (l2, w2) =
e.g., (1.41, 1.30) and (1.99, 1.62) for 60% flux
- n (number of shape components) =
2
- l_max (upper limit of l grid) =
2.6
- sigma (Gaussian smoothing scale) =
3 pixels
assumptions (5)
- domain assumption X-ray gas is stratified on concentric, similar ellipsoids, so emissivity depends only on R^2 = x^2/L^2 + y^2/W^2 + z^2/T^2.
- domain assumption Cluster orientations are isotropic for the purpose of building the theoretical PDF.
- domain assumption Each cluster is an ellipsoid with l >= w >= 1.
- standard math The observed filamentarity histogram follows Poisson statistics.
- domain assumption The NFW plus universal temperature profile is representative for generating X-ray surface brightness maps.
Cite this review
Pith. "Pith review of The probability distribution of 3-D shapes of galaxy clusters from 2-D X-ray images." pith.science (2026). https://pith.science/paper/KJYCVR7W
@misc{pith2026190804454,
  author       = {Pith},
  title        = {Pith review of: The probability distribution of 3-D shapes of galaxy clusters from 2-D X-ray images},
  year         = {2026},
  howpublished = {\url{https://pith.science/paper/KJYCVR7W}},
  note         = {Machine review of arXiv:1908.04454}
}
read the original abstract
We present a new method to determine the probability distribution of the 3-D shapes of galaxy clusters from the 2-D images using stereology. In contrast to the conventional approach of combining different data sets (such as X-rays, Sunyaev-Zeldovich effect and lensing) to fit a 3-D model of a galaxy cluster for each cluster, our method requires only a single data set, such as X-ray observations or Sunyaev-Zeldovich effect observations, consisting of sufficiently large number of clusters. Instead of reconstructing the 3-D shape of an individual object, we recover the probability distribution function (PDF) of the 3-D shapes of the observed galaxy clusters. The shape PDF is the relevant statistical quantity which can be compared with the theory and used to test the cosmological models. We apply this method to publicly available \emph{Chandra} X-ray data of 89 well resolved galaxy clusters. Assuming ellipsoidal shapes, we find that our sample of galaxy clusters is a mixture of prolate and oblate shapes, with a preference for oblateness with the most probable ratio of principle axes 1.4 : 1.3 : 1. The ellipsoidal assumption is not essential to our approach and our method is directly applicable to non-ellipsoidal shapes. Our method is insensitive to the radial density and temperature profiles of the cluster. Our method is sensitive to the changes in shape of the X-ray emitting gas from inner to outer regions and we find evidence for variation in the 3-D shape of the X-ray emitting gas with distance from the centre.
Figures

Figures from the paper (7 more)



Reference graph
Works this paper leans on
-
[2]
A., van de Weygaert R., Jones B
Arag \'o n-Calvo M. A., van de Weygaert R., Jones B. J. T., van der Hulst J. M., 2007, @doi [ ] 10.1086/511633 , https://ui.adsabs.harvard.edu/abs/2007ApJ...655L...5A 655, L5
doi:10.1086/511633 2007
-
[3]
Baddeley A., Jensen E., 2004, Stereology for Statisticians. Chapman & Hall/CRC Monographs on Statistics & Applied Probability, CRC Press, Boca Raton, @doi 10.1201/9780203496817
-
[4]
Bailin J., Steinmetz M., 2005, @doi [The Astrophysical Journal] 10.1086/430397 , http://adsabs.harvard.edu/abs/2005ApJ...627..647B 627, 647
doi:10.1086/430397 2005
-
[5]
Battaglia N., Bond J. R., Pfrommer C., Sievers J. L., 2012, @doi [ ] 10.1088/0004-637X/758/2/74 , https://ui.adsabs.harvard.edu/abs/2012ApJ...758...74B 758, 74
-
[7]
Bharadwaj S., Sahni V., Sathyaprakash B. S., Shandarin S. F., Yess C., 2000, @doi [The Astrophysical Journal] 10.1086/308163 , http://adsabs.harvard.edu/abs/2000ApJ...528...21B 528, 21
doi:10.1086/308163 2000
-
[8]
Binggeli B., 1982, Astronomy and Astrophysics, http://adsabs.harvard.edu/abs/1982A\
work page 1982
-
[9]
Brunino R., Trujillo I., Pearce F. R., Thomas P. A., 2007, @doi [ ] 10.1111/j.1365-2966.2006.11282.x , https://ui.adsabs.harvard.edu/abs/2007MNRAS.375..184B 375, 184
arXiv 2007
-
[10]
Buote D. A., Canizares C. R., 1992, in American Astronomical Society Meeting Abstracts \#180. p. 823
work page 1992
Show all 62 references
-
[11]
A., Canizares C
Buote D. A., Canizares C. R., 1996, @doi [Astrophysical Journal] 10.1086/176753 , http://adsabs.harvard.edu/abs/1996ApJ...457..565B 457, 565
1996 doi
-
[12]
Carter D., Metcalfe N., 1980, @doi [Monthly Notices of the Royal Astronomical Society] 10.1093/mnras/191.2.325 , http://adsabs.harvard.edu/abs/1980MNRAS.191..325C 191, 325
1980 doi
-
[13]
V., Lau E
Chen H., Avestruz C., Kravtsov A. V., Lau E. T., Nagai D., 2019, @doi [ ] 10.1093/mnras/stz2776 , https://ui.adsabs.harvard.edu/abs/2019MNRAS.490.2380C 490, 2380
2019 doi
-
[14]
Chiu I.-N., Umetsu K., Sereno M., Ettori S., Meneghetti M., Merten J., Sayers J., Zitrin A., 2018, @doi [The Astrophysical Journal] 10.3847/1538-4357/aac4a0 , http://adsabs.harvard.edu/abs/2018ApJ...860..126C 860, 126
2018 doi
-
[15]
Clowe D., De Lucia G., King L., 2004, @doi [ ] 10.1111/j.1365-2966.2004.07723.x , https://ui.adsabs.harvard.edu/abs/2004MNRAS.350.1038C 350, 1038
2004
-
[16]
Colless M., et al., 2001, @doi [Monthly Notices of the Royal Astronomical Society] 10.1046/j.1365-8711.2001.04902.x , http://adsabs.harvard.edu/abs/2001MNRAS.328.1039C 328, 1039
2001
-
[17]
L., King L
Corless V. L., King L. J., 2007, @doi [ ] 10.1111/j.1365-2966.2007.12018.x , https://ui.adsabs.harvard.edu/abs/2007MNRAS.380..149C 380, 149
2007
-
[18]
S., White S
Davis M., Efstathiou G., Frenk C. S., White S. D. M., 1985, @doi [ ] 10.1086/163168 , https://ui.adsabs.harvard.edu/abs/1985ApJ...292..371D 292, 371
1985 doi
-
[19]
G., 1991, @doi [Astrophysical Journal] 10.1086/170451 , http://adsabs.harvard.edu/abs/1991ApJ...378..496D 378, 496
Dubinski J., Carlberg R. G., 1991, @doi [Astrophysical Journal] 10.1086/170451 , http://adsabs.harvard.edu/abs/1991ApJ...378..496D 378, 496
1991 doi
-
[20]
Evans A. K. D., Bridle S., 2009, @doi [The Astrophysical Journal] 10.1088/0004-637X/695/2/1446 , http://adsabs.harvard.edu/abs/2009ApJ...695.1446E 695, 1446
2009 doi
-
[21]
Fabricant D., Rybicki G., Gorenstein P., 1984, @doi [Astrophysical Journal] 10.1086/162586 , http://adsabs.harvard.edu/abs/1984ApJ...286..186F 286, 186
1984 doi
-
[23]
S., White S
Frenk C. S., White S. D. M., Davis M., Efstathiou G., 1988b, @doi [Astrophysical Journal] 10.1086/166213 , http://adsabs.harvard.edu/abs/1988ApJ...327..507F 327, 507
-
[24]
Gavazzi R., 2005, @doi [ ] 10.1051/0004-6361:20053166 , https://ui.adsabs.harvard.edu/abs/2005A&A...443..793G 443, 793
2005 doi
-
[25]
J., Huchra J
Geller M. J., Huchra J. P., 1989, @doi [Science] 10.1126/science.246.4932.897 , https://ui.adsabs.harvard.edu/abs/1989Sci...246..897G 246, 897
1989 doi
-
[26]
Gott J. Richard I., Juri \'c M., Schlegel D., Hoyle F., Vogeley M., Tegmark M., Bahcall N., Brinkmann J., 2005, @doi [ ] 10.1086/428890 , https://ui.adsabs.harvard.edu/abs/2005ApJ...624..463G 624, 463
2005 doi
-
[27]
B., Ntampaka M., Nagai D., Lovisari L., Dolag K., Eckert D., ZuHone J
Green S. B., Ntampaka M., Nagai D., Lovisari L., Dolag K., Eckert D., ZuHone J. A., 2019, @doi [ ] 10.3847/1538-4357/ab426f , https://ui.adsabs.harvard.edu/abs/2019ApJ...884...33G 884, 33
2019 doi
-
[28]
U ber Inhalt, Oberfl \
Hadwiger H., 1957, Vorlesungen \"U ber Inhalt, Oberfl \"a che und Isoperimetrie . Berlin : Springer, @doi 10.1007/978-3-642-94702-5
1957 doi
-
[29]
P., Suto Y., 2002, @doi [The Astrophysical Journal] 10.1086/341065 , http://adsabs.harvard.edu/abs/2002ApJ...574..538J 574, 538
Jing Y. P., Suto Y., 2002, @doi [The Astrophysical Journal] 10.1086/341065 , http://adsabs.harvard.edu/abs/2002ApJ...574..538J 574, 538
2002 doi
-
[30]
K. N. Abazajian et al. 2016, preprint, http://adsabs.harvard.edu/abs/2016arXiv161002743A ( @eprint arXiv 1610.02743 )
2016 arXiv
-
[31]
F., Evrard A
Kasun S. F., Evrard A. E., 2005, @doi [The Astrophysical Journal] 10.1086/430811 , 629, 781
2005 doi
-
[32]
Kawahara H., 2010, @doi [The Astrophysical Journal] 10.1088/0004-637X/719/2/1926 , http://adsabs.harvard.edu/abs/2010ApJ...719.1926K 719, 1926
2010 doi
-
[33]
A., Shandarin S
Klypin A. A., Shandarin S. F., 1983, @doi [ ] 10.1093/mnras/204.3.891 , https://ui.adsabs.harvard.edu/abs/1983MNRAS.204..891K 204, 891
1983 doi
-
[34]
Lee J., Suto Y., 2004, @doi [ ] 10.1086/380506 , https://ui.adsabs.harvard.edu/abs/2004ApJ...601..599L 601, 599
2004 doi
-
[35]
J., 1932, @doi [ The Mathematical Gazette ] 10.2307/3606857 , 16
Lidstone G. J., 1932, @doi [ The Mathematical Gazette ] 10.2307/3606857 , 16
1932 doi
-
[36]
Limousin M., Morandi A., Sereno M., Meneghetti M., Ettori S., Bartelmann M., Verdugo T., 2013, @doi [Space Science Reviews] 10.1007/s11214-013-9980-y , 177, 155
2013 doi
-
[37]
L., Nelson E., Burns J., Bryan G
Loken C., Norman M. L., Nelson E., Burns J., Bryan G. L., Motl P., 2002, @doi [ ] 10.1086/342825 , https://ui.adsabs.harvard.edu/abs/2002ApJ...579..571L 579, 571
2002 doi
-
[38]
Makarenko I., Fletcher A., Shukurov A., 2015, @doi [Monthly Notices of the Royal Astronomical Society: Letters] 10.1093/mnrasl/slu169 , 447, L55
2015 doi
-
[39]
B., et al., 2015, @doi [ ] 10.1093/mnras/stu2096 , http://adsabs.harvard.edu/abs/2015MNRAS.446.2205M 446, 2205
Mantz A. B., et al., 2015, @doi [ ] 10.1093/mnras/stu2096 , http://adsabs.harvard.edu/abs/2015MNRAS.446.2205M 446, 2205
2015 doi
-
[40]
Merloni A., German eROSITA Consortium 2012, preprint, http://adsabs.harvard.edu/abs/2012arXiv1209.3114M ( @eprint arXiv 1209.3114 )
2012 arXiv
-
[41]
F., Frenk C
Navarro J. F., Frenk C. S., White S. D. M., 1996, @doi [Astrophys. J.] 10.1086/177173 , https://ui.adsabs.harvard.edu/\#abs/1996ApJ...462..563N 462, 563
1996 doi
-
[42]
A., Mead R., 1965, @doi [The Computer Journal] 10.1093/comjnl/7.4.308 , 7, 308
Nelder J. A., Mead R., 1965, @doi [The Computer Journal] 10.1093/comjnl/7.4.308 , 7, 308
1965 doi
-
[43]
P., 2010, @doi [ ] 10.1111/j.1365-2966.2010.16622.x , http://adsabs.harvard.edu/abs/2010MNRAS.405.2215O 405, 2215
Oguri M., Takada M., Okabe N., Smith G. P., 2010, @doi [ ] 10.1111/j.1365-2966.2010.16622.x , http://adsabs.harvard.edu/abs/2010MNRAS.405.2215O 405, 2215
2010
-
[44]
B., Dahle H., Sharon K., Gladders M
Oguri M., Bayliss M. B., Dahle H., Sharon K., Gladders M. D., Natarajan P., Hennawi J. F., Koester B. P., 2012, @doi [Monthly Notices of the Royal Astronomical Society] 10.1111/j.1365-2966.2011.20248.x , http://adsabs.harvard.edu/abs/2012MNRAS.420.3213O 420, 3213
2012
-
[45]
G., Cuesta A
Patiri S. G., Cuesta A. J., Prada F., Betancort-Rijo J., Klypin A., 2006, @doi [ ] 10.1086/510330 , https://ui.adsabs.harvard.edu/abs/2006ApJ...652L..75P 652, L75
2006 doi
-
[46]
Peter A. H. G., Rocha M., Bullock J. S., Kaplinghat M., 2013, @doi [ ] 10.1093/mnras/sts535 , https://ui.adsabs.harvard.edu/abs/2013MNRAS.430..105P 430, 105
2013 doi
-
[47]
Piffaretti R., Jetzer P., Schindler S., 2003, @doi [ ] 10.1051/0004-6361:20021648 , https://ui.adsabs.harvard.edu/abs/2003A&A...398...41P 398, 41
2003 doi
-
[48]
Planck Collaboration et al., 2016, @doi [ ] 10.1051/0004-6361/201525833 , https://ui.adsabs.harvard.edu/abs/2016A&A...594A..24P 594, A24
2016 doi
-
[49]
B., Lightman A
Rybicki G. B., Lightman A. P., 1979, Radiative processes in astrophysics . Wiley-Interscience, New York
1979
-
[50]
H., 2012, @doi [ ] 10.1088/0004-637X/748/1/21 , https://ui.adsabs.harvard.edu/abs/2012ApJ...748...21S 748, 21
Samsing J., Skielboe A., Hansen S. H., 2012, @doi [ ] 10.1088/0004-637X/748/1/21 , https://ui.adsabs.harvard.edu/abs/2012ApJ...748...21S 748, 21
2012 doi
-
[51]
R., Ameglio S., Pierpaoli E., 2011, @doi [The Astrophysical Journal] 10.1088/0004-637X/728/1/39 , http://adsabs.harvard.edu/abs/2011ApJ...728...39S 728, 39
Sayers J., Golwala S. R., Ameglio S., Pierpaoli E., 2011, @doi [The Astrophysical Journal] 10.1088/0004-637X/728/1/39 , http://adsabs.harvard.edu/abs/2011ApJ...728...39S 728, 39
2011 doi
-
[52]
R., Provenzale A., eds, Dark Matter in the Universe, ProceedingsInternational School of Physics, Enrico Fermi , Course 132
Schmalzing J., Kerscher M., Buchert T., 1996, in Bonometto S., Primack J. R., Provenzale A., eds, Dark Matter in the Universe, ProceedingsInternational School of Physics, Enrico Fermi , Course 132. IOS press, Amsterdam, p. 281 ( @eprint astro-ph/9508154 )
1996 arXiv
-
[53]
F., Zeldovich Y
Shandarin S. F., Zeldovich Y. B., 1989, @doi [Reviews of Modern Physics] 10.1103/RevModPhys.61.185 , https://ui.adsabs.harvard.edu/abs/1989RvMP...61..185S 61, 185
1989 doi
-
[54]
S., 2012, @doi [The Astrophysical Journal] 10.1088/2041-8205/758/1/l16 , 758, L16
Skielboe A., Wojtak R., Pedersen K., Rozo E., Rykoff E. S., 2012, @doi [The Astrophysical Journal] 10.1088/2041-8205/758/1/l16 , 758, L16
2012 doi
-
[55]
P., 1987, Astronomy and Astrophysics, http://adsabs.harvard.edu/abs/1987A 172, L14
Soucail G., Fort B., Mellier Y., Picat J. P., 1987, Astronomy and Astrophysics, http://adsabs.harvard.edu/abs/1987A 172, L14
1987
-
[56]
J., Melott A
Splinter R. J., Melott A. L., Linn A. M., Buck C., Tinker J., 1997, @doi [ ] 10.1086/303896 , https://ui.adsabs.harvard.edu/abs/1997ApJ...479..632S 479, 632
1997 doi
-
[57]
Springel V., et al., 2005, @doi [Nature] 10.1038/nature03597 , http://adsabs.harvard.edu/abs/2005Natur.435..629S 435, 629
2005 doi
-
[58]
A., Zeldovich Y
Sunyaev R. A., Zeldovich Y. B., 1972, Comments on Astrophysics and Space Physics, http://adsabs.harvard.edu/abs/1972CoASP...4..173S 4, 173
1972
-
[59]
S., Van Speybroeck L., 2006, @doi [ ] 10.1086/500288 , https://ui.adsabs.harvard.edu/abs/2006ApJ...640..691V 640, 691
Vikhlinin A., Kravtsov A., Forman W., Jones C., Markevitch M., Murray S. S., Van Speybroeck L., 2006, @doi [ ] 10.1086/500288 , https://ui.adsabs.harvard.edu/abs/2006ApJ...640..691V 640, 691
2006 doi
-
[60]
S., Quinn P
Warren M. S., Quinn P. J., Salmon J. K., Zurek W. H., 1992, @doi [Astrophysical Journal] 10.1086/171937 , http://adsabs.harvard.edu/abs/1992ApJ...399..405W 399, 405
1992 doi
-
[61]
B., 1970, , http://adsabs.harvard.edu/abs/1970A
Zeldovich Y. B., 1970, , http://adsabs.harvard.edu/abs/1970A
1970
-
[62]
B., Sunyaev R
Zeldovich Y. B., Sunyaev R. A., 1969, @doi [Astrophysics and Space Science] 10.1007/BF00661821 , http://adsabs.harvard.edu/abs/1969Ap\
1969 doi
-
[63]
de Haan T., et al., 2016, @doi [ ] 10.3847/0004-637X/832/1/95 , http://adsabs.harvard.edu/abs/2016ApJ...832...95D 832, 95
2016 doi
-
[64]
van Haarlem M., van de Weygaert R., 1993, @doi [ ] 10.1086/173416 , https://ui.adsabs.harvard.edu/abs/1993ApJ...418..544V 418, 544
1993 doi
-
[65]
write newline
" write newline "" before.all 'output.state := FUNCTION fin.entry write newline FUNCTION new.block output.state before.all = 'skip after.block 'output.state := if FUNCTION new.sentence output.state after.block = 'skip output.state before.all = 'skip after.sentence 'output.stat...
Reviewed August 14, 2026 · model on record in the stance chip above.
Discussion (0). Continue with ORCID to comment.