REVIEW 3 major objections 4 minor 46 references
Development of Hydrogen and Helium Proximity Zones around Quasars
T0 review · 3 major / 4 minor · reviewed 2026-08-14 · deepseek-v4-flash
Pith's one-line read Quasar H I proximity zones are age indicators: their sizes track He II zones at z~3-4, so the hydrogen ionizing front expands no faster than the helium front, and H I zone size can identify quasars younger than 1 Myr.
desk verdict A potentially important first comparison of H I and He II proximity zones, but the H I zone sizes rest on an unvalidated visual estimator that a referee should probe. read the letter →
The pith
A machine-rendered reading of the paper's core claim, the machinery that carries it, and where it could break.
The reading
What carries the argument
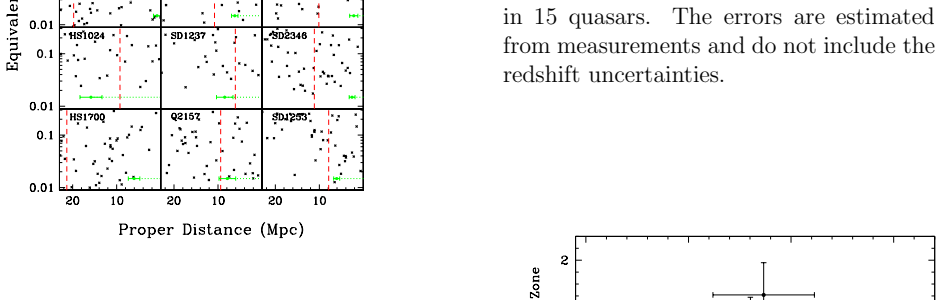
The H I proximity zone size is estimated from the hydrogen Lyman-$\alpha$ forest: absorption lines with rest-frame equivalent width below 0.2 Å are tabulated within about 23 Mpc of the quasar, and a 30% decline in either the line number or the total equivalent width (computed as geometric mean times number) marks the zone edge. Features that decline and then recover toward the quasar are classified as foreground external voids rather than intrinsic zones. The He II zone size is taken from the UV proximity profile at the point where the transmitted flux drops to 10% of the unattenuated level. Both sizes are normalized by the characteristic radius $R_{\omega=1}$ at which the quasar ionizing flux equals the metagalactic background ($\Gamma_{\rm HI}=10^{-12}\,{\rm s^{-1}}$ and $\Gamma_{\rm HeII}=10^{-14.3}\,{\rm s^{-1}}$); comparing measured to normalized sizes is what converts zone-size data into statements about quasar age.
What would settle it
Build mock quasar sightlines with known intrinsic H I zone sizes and embedded foreground external voids, then apply the 30%-decline and 'decline then recover' recipe; if the recovered zone sizes do not match the inputs, the reported correlation would not be established. Alternatively, a luminous quasar with a small He II zone but a full-sized H I zone would directly falsify the claim that H I fronts do not outrun He II fronts.
Extended reading notes
Core claim
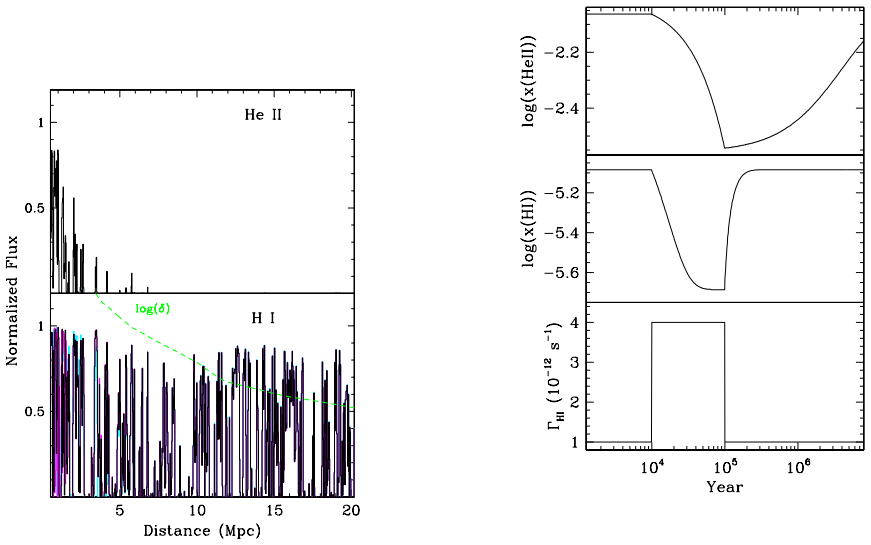
The central claim is that at $z\sim3$--$4$ the H I and He II proximity zones around quasars develop together, not at very different speeds. Quantitatively, the He II and H I zone sizes for the 15 quasars give a correlation coefficient $r=0.62$ with a no-correlation probability of 1.2%; after normalizing each zone by the characteristic radius at which the quasar's ionizing flux equals the metagalactic background, the correlation is $r=0.69$ with probability 0.46%, and the regression slope of 0.39 indicates H I zones are usually smaller than He II zones. The most extreme object, HE2347-4342, has essentially no zone in either species ($R_{\rm HI} = 0.8 \pm 0.8$ Mpc and $R_{\rm HeII} < 1.3$ Mpc) despite a luminosity that should produce zones of roughly 20--30 Mpc. The paper interprets the paired small zones as young quasars, with the H I zone responding to the latest ionizing burst on a $\sim10^4$ yr timescale while the He II zone integrates over the quasar's lifetime; this explains why small H I zones are not masked by a fast H I front.
Load-bearing premise
The H I zone-size measurements depend on treating a 30% decline in the number of weak hydrogen absorption lines as the edge of the ionization zone, and on treating any 'decline then recover' feature as a foreground void rather than an intrinsic zone; if that classification is mistaken, the measured H I sizes and their correlation with He II sizes could be artifacts.
Editorial extensions
If this is right
- The four quasars with small He II zones also have small H I zones, so a young quasar does not acquire a large, full-sized H I proximity zone.
- H I and He II zone sizes remain correlated after normalization for luminosity, so H I zones can be used as an age indicator at $z\sim3$--$4$.
- The paired small zones rule out the assumption that H I ionizing fronts propagate at essentially the speed of light along the line of sight.
- Quasars showing zones smaller than about 3 Mpc should be considerably younger than about 1 Myr.
- Episodic quasar activity naturally explains the paired sizes, with H I reacting to the latest burst and He II integrating the entire quasar lifetime.
Reading between the lines
- If H I zones really track age, then large ground-based Lyman-alpha forest surveys could measure quasar age distributions at $z\sim3$--$4$ without the expensive UV spectra needed for He II, increasing the sample by orders of magnitude.
- The flickering scenario predicts that a quasar observed just after a new burst could show a re-established H I zone while its He II zone is still small on a $\sim10^4$ yr timescale; pairing zone sizes with continuum light curves would test this.
- Alternatively, the small H I zones could be caused by dense, rapidly recombining gas in the quasar's host environment rather than by youth; measuring the foreground absorber distribution along each line of sight would separate density effects from age effects.
Signed reviews
Editorial analysis
A structured set of objections, weighed in public.
Referee Report
Summary. The paper compares H I and He II proximity-zone sizes in 15 quasars at z≈2.7–3.8, using archival HST/COS and GHRS UV spectra together with Keck/HIRES and VLT/UVES optical spectra. H I zone sizes are estimated from the radius at which the number or total equivalent width of weak Lyα lines (EW<0.2 Å) declines by 30% toward the quasar, and candidate outer voids that 'decline and recover' are classified as external foreground effects and rejected. The authors report a Pearson correlation r=0.62 (p=1.2%) between R_HI and R_HeII, a null H I zone in HE2347-4342 (with an inferred age <0.2 Myr from time-dependent simulations), and conclude that H I proximity zones can serve as quasar age indicators and that the H I ionizing front does not expand considerably faster than its He II counterpart.
Significance. If the central correlation is real, the result would be observationally important: it would establish H I proximity zones as an accessible age indicator for z~3 quasars and would constrain the propagation of ionizing fronts. The paper makes good use of a valuable archival data set, consistently remeasures the He II zones, and presents the measurements transparently in Table 2 and in the individual case discussions. The quantitative claims are, however, not yet supported by a validated measurement procedure: the H I zone estimator is partly subjective and untested against mock data, and the reported correlation is sensitive to a few classification decisions. With a blind, mock-validated re-analysis and proper robustness tests, the paper could make a solid case; as it stands, the evidence is suggestive but not load-bearing.
major comments (3)
- [§3.1, §3.4] The H I proximity-zone sizes are set by an unvalidated, partly subjective procedure that is entangled with the comparison being made. The 30% decline threshold is applied to 3/5/7 Å bins, the zone edge is chosen by visual inspection, and candidate outer voids are rejected as 'external' whenever the line density declines and then recovers; the paper itself notes in §3.1 that 'the larger value is rejected because it is likely an external effect' for several quasars. No mock catalog or simulated foreground-void test is presented to show that this procedure recovers true zone sizes or that 'decline then recover' is a reliable discriminator, and ordinary Lyα forest fluctuations can produce such patterns by chance. Because the rejection is performed with knowledge of the He II zone sizes and the age narrative, it can systematically pull R_HI toward R_HeII. A concrete sensitivity check shows the fragility: if for SDSSJ0915+4756 and PKS1935-692 the larger candidate voids (16 and 18 Mpc) are retained instead of the adopted 5.3 and 6.3 Mpc values in Table 2, the Pearson r drops from 0.62 to approximately 0.47, which is not significant at the 5% level (p≈0.08). The paper needs an objective, blind, and mock-validated estimator before the correlation can be used as evidence.
- [§3.1, Table 2] The significance of the reported correlation is not robust under simple sensitivity checks and does not propagate the quoted measurement errors. Restricting the sample to the ten objects with R_HeII > 3 Mpc removes essentially all correlation (r≈0.2, N=10), so the r=0.62 result is driven by the cluster of five small-zone quasars rather than by a smooth trend across the sample. In addition, the p=1.2% treats the R_HI and R_HeII point estimates as exact, even though Table 2 lists errors of order 1–2.5 Mpc and the paper states that the errors are 'estimated from visual inspections.' A Monte Carlo or bootstrap test that draws both zone sizes from their error distributions, and that includes the redshift-uncertainty term, should be reported before a 'significant correlation' is claimed.
- [§4.2, §4.3] The age interpretation is tied to simplifications that are acknowledged but not quantified. The simulation for HE2347-4342 in §4.2 explicitly excludes the light-travel-time delay along the line of sight, yet the abstract's headline age limit (<0.2 Myr) is quoted without an assessment of how this simplification changes the limit. The conclusion in §5 also states that the proximity effect may provide only upper limits to quasar ages, but the actual dependence on the light-cone treatment is not derived. Furthermore, §4.3 introduces episodic quasar activity as an alternative explanation without a model; the data may be consistent with either a young single-burst quasar or a flickering quasar, so the age inference is not unique. The paper should either implement the light-cone correction and an episodic-burst model, or explicitly bound the resulting uncertainty in the quoted ages.
minor comments (4)
- [§5, conclusion item (3)] The conclusion states a 'significant correlation between H I and H I proximity-zone sizes'; this should read 'He II and H I.'
- [§3.1, Table 2] The text refers to 'SDSS0915−0016' in §3.1 while Tables 1 and 2 list 'SDSSJ0915+4756'; please reconcile the naming.
- [Abstract, Table 2] The abstract describes HE2347-4342 as displaying a 'null proximity zone' in H I, but Table 2 lists R_HI = 0.8 ± 0.8 Mpc; 'consistent with null' would be more precise.
- [References] The Pâris et al. 2017 reference is garbled, with the journal name and volume apparently missing ('˚a, 597, 79'); please correct the entry.
Circularity Check
No significant circularity: the H I/He II correlation is a new empirical measurement, and the age modeling uses fixed external inputs rather than fitted parameters fed back into the measurement.
full rationale
The paper's central claim is an empirical correlation between newly measured H I proximity-zone sizes and previously reported He II proximity-zone sizes. The He II sizes come from earlier work, but the authors explicitly remeasure them from the archival UV spectra and find consistency with published values, so the comparison is not defined in terms of the conclusion. The H I sizes are measured from independent Keck/HIRES and VLT/UVES optical spectra via an explicit, if partly visual, criterion: a 30% decline in line number or total equivalent width is taken as the proximity signal, and candidate outer voids showing a decline-then-recover pattern are classified as external foreground effects. That classification is a measurement-validity issue and could in principle bias the correlation, but it is not circular in the formal sense: the rejection rule is stated in terms of spectral morphology, not in terms of the He II zone size or the age narrative, and no fitted parameter is fed back into the measurement. The age modeling for HE2347-4342 solves the time-dependent photoionization equations with fixed literature inputs for the UV background, luminosity, and density profile; these inputs do not include the measured R_HI or R_HeII values used in the correlation. The simulations therefore interpret the observations rather than generate them. The paper's self-citations (e.g., Zheng et al. 2015 for redshifts and He II sizes, Zheng et al. 2004 for the normalized UVES spectrum) are normal references to prior data papers and are not load-bearing; the key measurements are remeasured or obtained from independent archival data. No load-bearing step reduces by construction to its own inputs, so the circularity score is low.
Assumptions & free parameters
free parameters (2)
- H I proximity effect threshold =
30% decline
- Weak Ly-alpha line cutoff =
EW < 0.2 Å
assumptions (5)
- domain assumption Weak Ly-alpha lines (EW < 0.2 A) trace the H I proximity effect: their equivalent width decreases inversely with ionizing flux according to a curve of growth at b = 30 km/s.
- domain assumption External foreground quasars produce spectral voids with a symmetric decline-recover pattern, which can be distinguished from intrinsic proximity zones.
- domain assumption The quasar spectral energy distribution is a broken power law with slopes -0.44 below and -1.73 above 1 Ry, and the metagalactic UVB rates are Gamma_HI = 1e-12 s^-1 and Gamma_HeII = 1e-14.3 s^-1.
- domain assumption The time-dependent ionization equations (1) and (2) with case-A recombination, a lognormal density distribution, and the Guimaraes et al. (2007) overdensity profile describe the growth of the He II proximity zone.
- ad hoc to paper For the HE2347-4342 age simulation, no light-travel time delay along the line of sight is included.
Cite this review
Pith. "Pith review of Development of Hydrogen and Helium Proximity Zones around Quasars." pith.science (2026). https://pith.science/paper/LKIVBEQU
@misc{pith2026190804691,
  author       = {Pith},
  title        = {Pith review of: Development of Hydrogen and Helium Proximity Zones around Quasars},
  year         = {2026},
  howpublished = {\url{https://pith.science/paper/LKIVBEQU}},
  note         = {Machine review of arXiv:1908.04691}
}
read the original abstract
Increasing evidence suggests that He II proximity profiles in the quasar spectra at z ~ 3 - 4 are sensitive probes of quasar ages. But the development of their H I counterparts is difficult to trace and remains poorly constrained. We compare the UV spectra of 15 He II quasars with their high-resolution optical counterparts and find a significant correlation between the sizes of He II and H I proximity zones. The luminous quasar HE2347-4342 displays a null proximity zone in both He II and H I, suggesting that it is extremely young (age < 0.2 Myr). Three other quasars also display small proximity zones for He II and H I. There is no evidence that a H I ionization zone expands considerably faster than its He II counterpart. The results suggest that the expansion of quasar ionizing fronts may be noticeably slower than the speed of light, and raise the possibility of distinguishing young and old quasars from the sizes of their H I proximity zones.
Figures


Figures from the paper (4 more)


Reference graph
Works this paper leans on
-
[1]
Anderson, S. F., Hogan, C. J., Willimas, B. F. & Carswell, R. F. 1999, , 117, 56
work page 1999
-
[2]
Bajtlik, S., Duncan, R. C. & Ostriker, J. P. 1988, , 327, 570
work page 1988
-
[3]
Becker G. D. & Bolton, J. S. 2013, , 436, 1023
work page 2013
- [4]
-
[5]
Bolton, J. S. & Haehnelt, M. G. 2007, , 374, 493
work page 2007
-
[6]
Bolton, J. S. & Haehnelt, M. G., Viel, M., & Springel, V. 2005, , 357, 1178
work page 2005
- [7]
- [8]
Show all 46 references
-
[9]
2008, , 491, 465
Dall'Aglio, A., Wisotzki, L., & Worseck, G. 2008, , 491, 465
2008
-
[10]
F., Kriss, G
Davidsen, A. F., Kriss, G. A. & Zheng, W. 1996, Nature 380, 47
1996
-
[11]
& Bechtold, J
Dobrzycki, A. & Bechtold, J. 1991, , 377, L69
1991
-
[12]
Fechner, C., Reimers, D., Kriss, G, A. et al. 2006, , 455, 91
2006
-
[13]
Guimar\ aes, R., Petitjean, P., Rollinde, E. et al. 2007, , 377, 657
2007
-
[14]
& Madau, P
Haardt, F. & Madau, P. 2012, , 746, 125
2012
-
[15]
R., Williger, G
Heap, S. R., Williger, G. M., Smette, A. et al.\ 2000, , 534, 69
2000
-
[16]
Hodge, P. E. \ 2011, in Astronomical Data Analysis Software and Systems XX , eds. I. N. Evans, A. Accomazzi, D. J. Mink, & A. H. Rots, ( A. S. P. Conf. Series 442 , ASP, San Francisco), 391
2011
-
[17]
J., Anderson, S
Hogan, C. J., Anderson, S. F. & Rugers, M. H. 1997, , 113, 1495
1997
-
[18]
M., Greenfield, P., Jedrzejewski, R., & Paresce, F
Jakobsen, P., Boksenberg, A., Deharveng, J. M., Greenfield, P., Jedrzejewski, R., & Paresce, F. 1994, Nature, 370, 35
1994
-
[19]
S., Hennawi, J
Khrykin, I. S., Hennawi, J. F., McQuinn, M., & Worseck, G. 2016, , 824, 133
2016
-
[20]
S., Hennawi, J
Khrykin, I. S., Hennawi, J. F. & Worseck, G. 2019, , 484, 3897
2019
-
[21]
M., Carswell, R
Kim, T.-S., Partl, A. M., Carswell, R. F., & M\"uller, V. 2013, , 552, 77
2013
-
[22]
& Tytler, D
Kirkman, D. & Tytler, D. 2008, MNRAS, 391, 1547
2008
-
[23]
Lu, Y. & Yu, Q. 2011, , 736, 49
2011
-
[24]
Lusso E., Worseck G., Hennawi J. F. et al. 2015, , 449, 4204
2015
-
[25]
Meiksin, A. A. 2009, Rev. Modern Phys., 841, 1405
2009
-
[26]
S., Ostriker J
Novak G. S., Ostriker J. P. & Ciotti L. 2011, , 737, 26
2011
-
[27]
M., Lehner, N., Howk, J
O'Meara, J. M., Lehner, N., Howk, J. C. et al. 2017, , 154, 114
2017
-
[28]
Petijean, P., Ross, N
P \^a ris, I. Petijean, P., Ross, N. et al. 2017, , 597, 79
2017
-
[29]
& Wamsteker, W
Reimers, D., K\"ohler, S., Wisotzki, L., Groote, D., Rodriguez-Pascual, P. & Wamsteker, W. 1997, , 327, 890
1997
-
[30]
& Sartori, L
Schawinski, K., Koss, M., Berney, S. & Sartori, L. F. 2015, , 451, 2517
2015
-
[31]
Schlafly, E. F. & Finkbeiner, D. P. 2011, , 737, 103
2011
-
[32]
P., Richards, G
Schneider, D. P., Richards, G. T., Hall, P. B. et al.\ 2010, , 139, 2360
2010
-
[33]
M., France, K., Danforth, C
Shull, J. M., France, K., Danforth, C. W., & Smith, B. 2010, , 722, 1312
2010
-
[34]
A., Burgasser, A
Simcoe, R. A., Burgasser, A. J., Schechter, P. L. et al. 2013, PASP, 125, 270
2013
-
[35]
& Shull, J
Syphers, D. & Shull, J. M. 2013, , 765, 119
2013
-
[36]
A., & Davidsen, A
Telfer, R., Zheng, W., Kriss, G. A., & Davidsen, A. F.\ 2002, , 565, 733
2002
-
[37]
E., Richards, G
Vanden Berk, D. E., Richards, G. T., Bauer, A. et al. 2001, , 122, 549
2001
-
[38]
L., Becker, R., Fan, X., & Strauss, M
White, R. L., Becker, R., Fan, X., & Strauss, M. A. 2003, , 126, 1
2003
-
[39]
B., Hennawi, J
Worseck, G., Davies, F. B., Hennawi, J. F. & Prochaska, J. X. 2019, , 875, 111
2019
-
[40]
2007, 473, 805
Worseck, G., Fechner, C., Wisotzki, L., & Dall'Aglio, A. 2007, 473, 805
2007
-
[41]
F., Prochaska, J
Worseck, G., Hennawi, J. F., Prochaska, J. X. et al. 2012, http://www.stsci.edu/hst/phase2-public/13013.pro
2012
-
[42]
X., Hennawi, J
Worseck, G., Prochaska, J. X., Hennawi, J. F. & McQuinn, M. 2016, , 825, 144
2016
-
[43]
& Davidsen, A
Zheng, W. & Davidsen, A. F. 1995, , 440, L53
1995
-
[44]
A., Deharveng, J.-M.\ et al.\ 2004, , 605, 631
Zheng, W., Kriss, G. A., Deharveng, J.-M.\ et al.\ 2004, , 605, 631
2004
-
[45]
A., Telfer, R
Zheng, W., Kriss, G. A., Telfer, R. C. et al. 1997, , 475, 469
1997
-
[46]
Zheng, W., Syphers, D., Meiksin, A. et al. 2015, , 806, 142
2015
Reviewed August 14, 2026 · model on record in the stance chip above.
Discussion (0). Continue with ORCID to comment.