REVIEW 3 major objections 7 minor 45 references
Automated Brain Metastases Detection Framework for T1-Weighted Contrast-Enhanced 3D MRI
T0 review · 3 major / 7 minor · reviewed 2026-08-14 · deepseek-v4-flash
Pith's one-line read A two-stage framework detects brain metastases under 15 mm on a single MRI sequence at 90% sensitivity.
desk verdict Solid incremental CAD paper with a genuinely useful small-lesion focus and a clean patient-wise CV, but the missing candidate-to-lesion match criterion makes the headline numbers non-reproducible as reported. read the letter →
The pith
A machine-rendered reading of the paper's core claim, the machinery that carries it, and where it could break.
The reading
What carries the argument
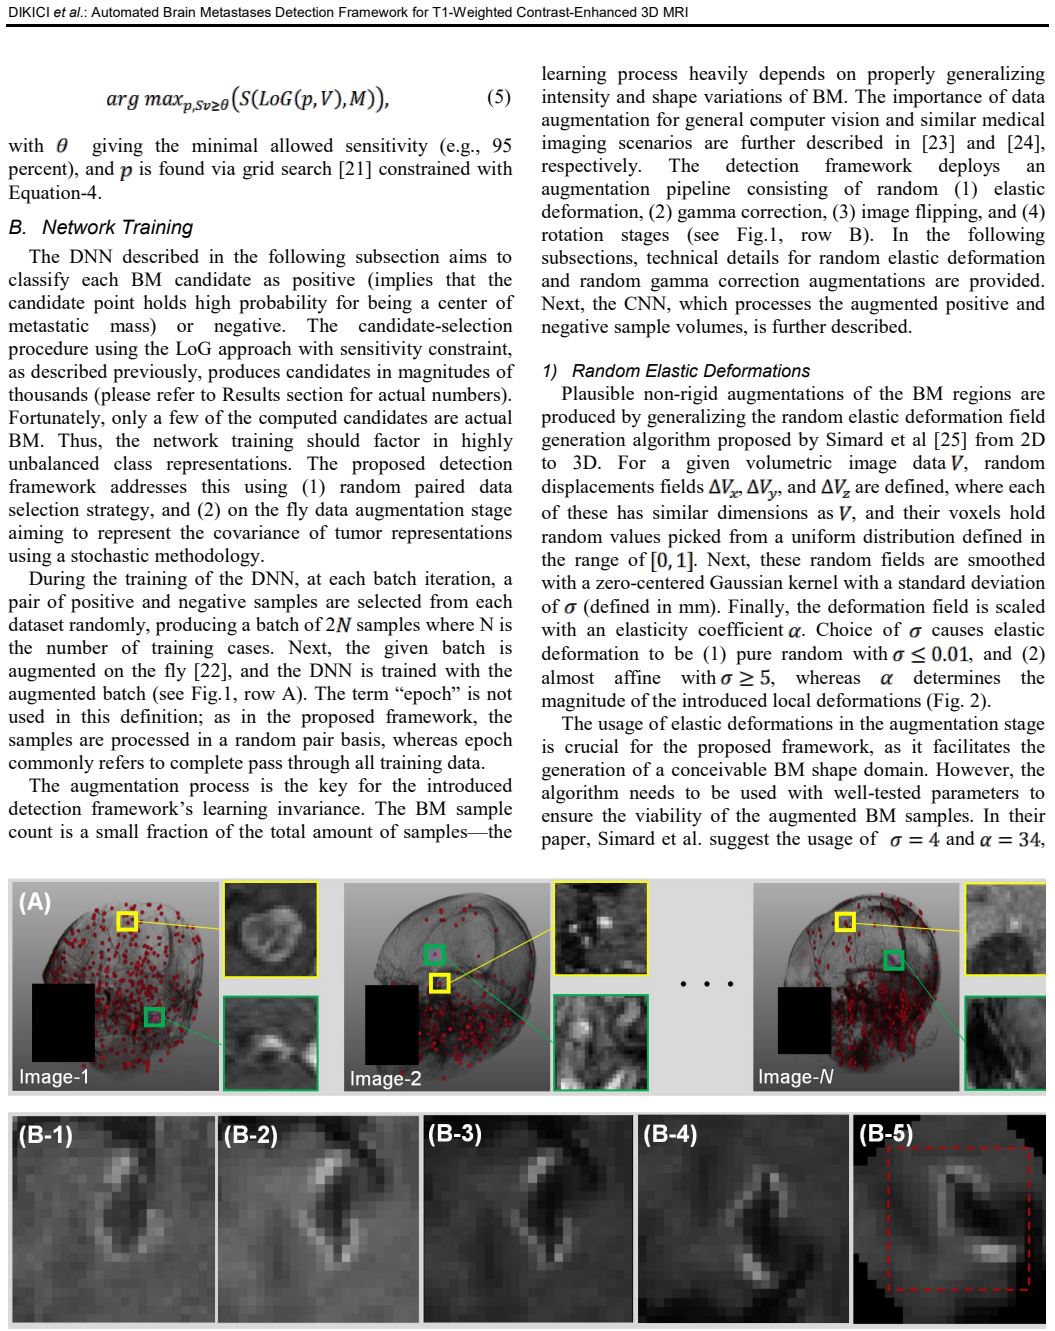
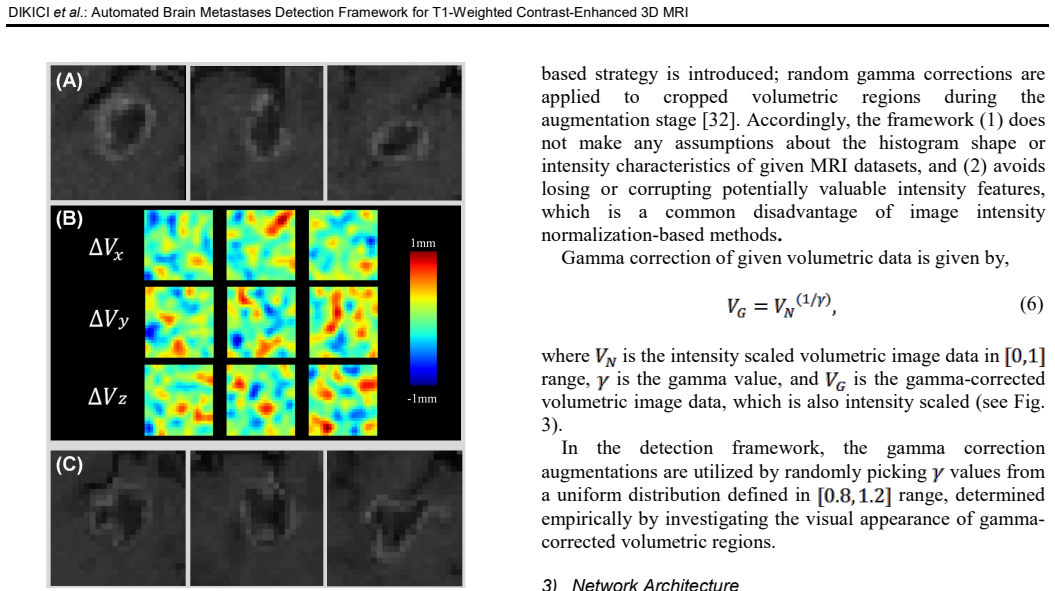
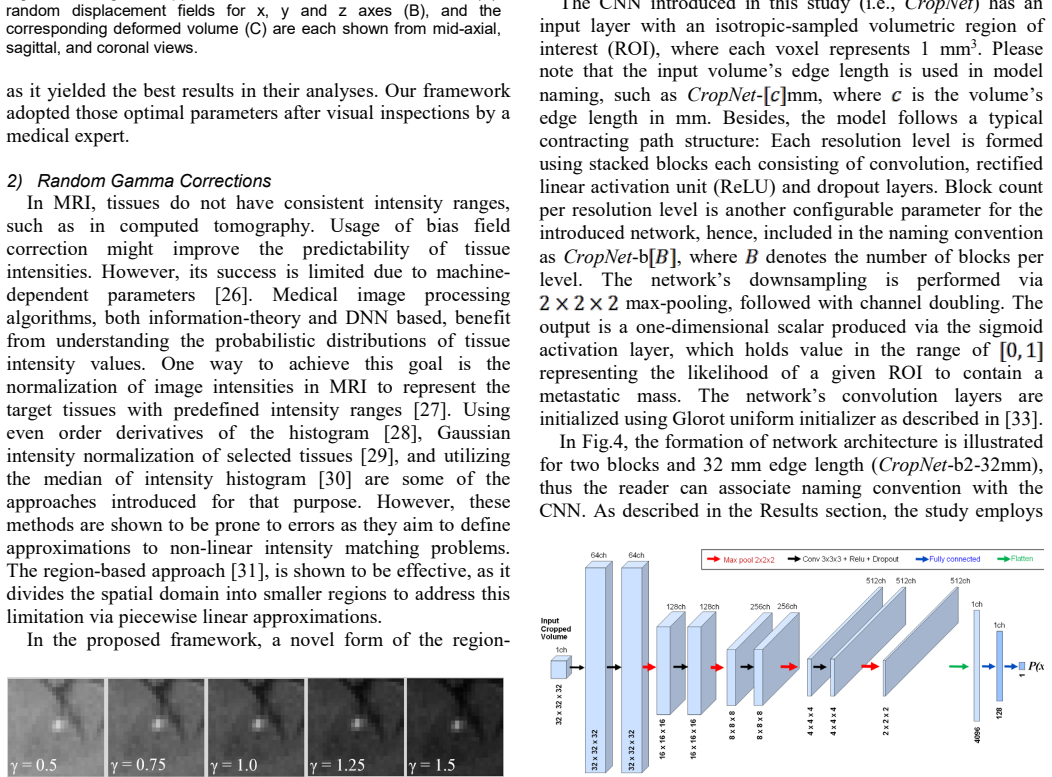
The load-bearing mechanism is a two-stage cascade driven by scale-space blob detection. The first stage applies the scale-normalized Laplacian of Gaussian to build a scale-space representation; local extrema in space and scale mark candidate blob centers, and a grid search sets the Laplacian-of-Gaussian parameters under a constraint that at least 95% of true lesions survive. The second stage is CropNet, a 3D convolutional network with a contracting path of convolution-ReLU-dropout blocks, downsampled by max-pooling with channel doubling, ending in a sigmoid that scores each 16 mm isotropic candidate region. Training pairs random positive and negative candidates and augments them on the fly with random gamma correction and 3D elastic deformation, which supplies the intensity and shape variation the network needs to generalize from a small set of 932 lesions.
What would settle it
Take a held-out set of contrast-enhanced T1 volumes containing small, irregular, or centrally necrotic metastases, run only the Laplacian-of-Gaussian candidate stage, and count how many true lesions produce a scale-space extremum within the optimized parameter range; if the candidate-stage sensitivity falls below 95 percent, the reported end-to-end sensitivity cannot be reached by any downstream classifier.
Extended reading notes
Core claim
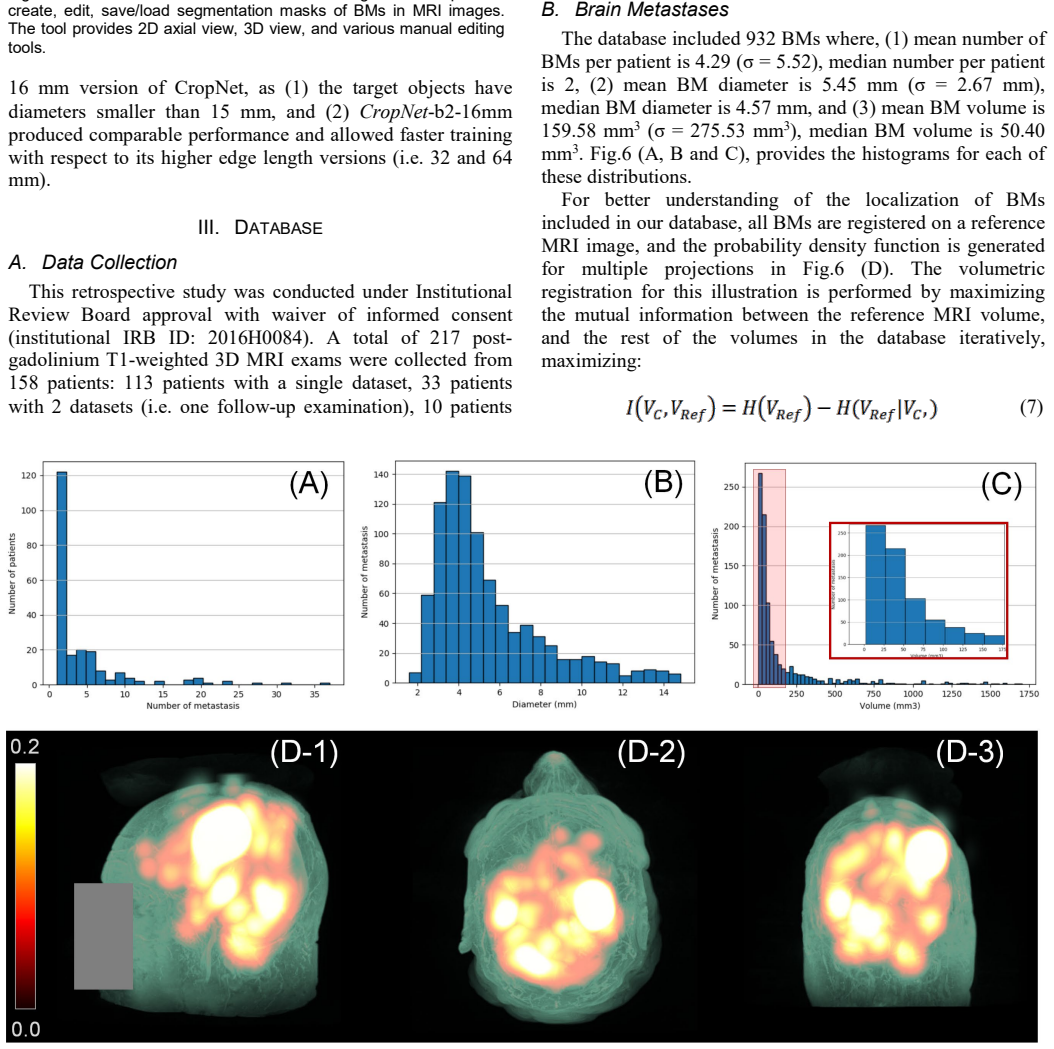
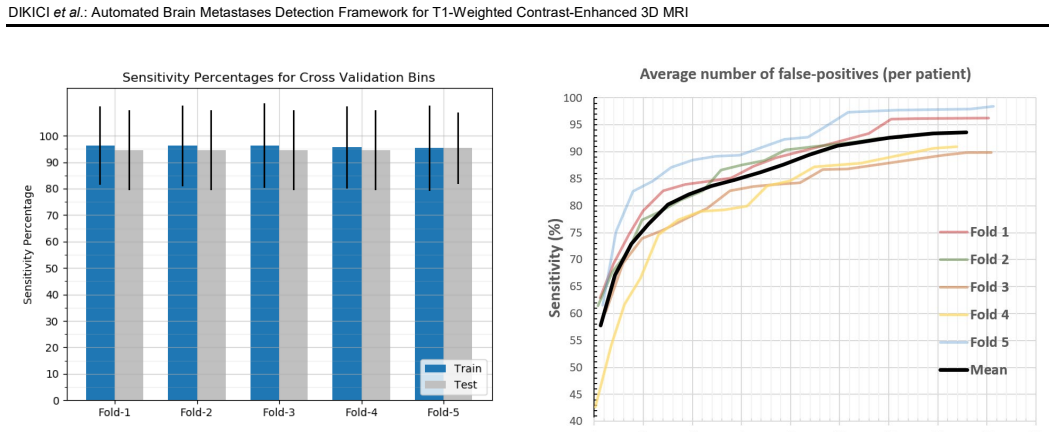
The discovery the paper asserts is that small brain metastases can be detected at clinically meaningful sensitivity from one contrast-enhanced T1-weighted sequence alone, without the multi-sequence inputs used by comparable systems. On 217 datasets from 158 patients, with five-fold cross-validation split by patient, the sensitivity-constrained Laplacian-of-Gaussian candidate stage retains 95.8% of true lesions, and the CropNet classifier then yields 90% end-to-end sensitivity at an average cost of 9.12 false positives per patient, or 85% sensitivity at 5.85 false positives. Because the mean lesion volume is 159.58 mm3, far below the 672 mm3 mean of the nearest comparison study, the paper treats this as evidence that lesion size is not a fundamental barrier to CNN-based detection.
Load-bearing premise
The framework assumes that every metastasis worth finding appears as a local blob-shaped brightening or darkening that the Laplacian-of-Gaussian detector can catch at the chosen scales; any lesion without such a blob signature is discarded before the neural network sees it.
Editorial extensions
If this is right
- A single post-contrast T1-weighted sequence may be enough for automated small-lesion screening, lowering acquisition and processing requirements relative to multi-sequence approaches.
- At 90% sensitivity with about nine false positives per patient, the framework could serve as a radiologist worklist aid for detecting punctate metastases rather than as a final diagnosis.
- Since the candidate stage caps end-to-end sensitivity at 95.8%, any improvement in the CNN classifier alone can only reduce false positives, not recover lesions the Laplacian-of-Gaussian stage discards.
- Retuning the Laplacian-of-Gaussian scale bounds and CropNet input size should let the same cascade be adapted to larger lesions, though the paper does not demonstrate that configuration.
- The framework's detection output could seed a segmentation network, extending it toward radiation-treatment planning, but the paper only sketches this extension.
Reading between the lines
- If the 95.8% candidate-stage sensitivity is close to the true ceiling on non-blob lesions, the next bottleneck is the Laplacian-of-Gaussian selector, not the CNN; a recall-focused candidate stage or a second complementary detector would be the natural next step.
- The augmentation strategy—uniform random gamma correction and elastic deformation—implicitly treats intensity and shape priors as uniform over a plausible range; switching to Gaussian-distributed gamma or deformation magnitudes, as the paper itself suggests, might tighten or improve calibration.
- The framework's robustness to motion-degraded studies and scanner intensity differences is asserted through inclusion of such data and through augmentation, but cross-institution performance remains untested; a multi-scanner external validation would be the direct test.
- Because the system uses only T1-weighted contrast-enhanced data, it could be deployed retrospectively on existing single-sequence archives, enabling large-scale re-screening of historical studies without new acquisitions.
Signed reviews
Editorial analysis
A structured set of objections, weighed in public.
Referee Report
Summary. The manuscript proposes a two-stage automated framework for detecting small brain metastases (<15 mm) in single-sequence gadolinium-enhanced T1-weighted 3D MRI. The first stage uses a Laplacian-of-Gaussian (LoG) scale-space approach with a sensitivity constraint to generate candidate lesion locations. The second stage classifies each candidate by feeding cropped 16 mm isotropic ROIs into a custom 3D CNN called CropNet. Training uses extensive on-the-fly augmentation including elastic deformation, gamma correction, flipping, and rotation. The method is evaluated with five-fold patient-wise cross-validation on 217 datasets from 158 patients, all with lesions smaller than 15 mm (mean volume 159.58 mm^3). At 90% detection sensitivity, the framework yields on average 9.12 false positives per patient; at 85% sensitivity, 5.85 false positives. The authors compare this performance with prior CNN-based BM detection/segmentation studies and conclude that their framework is comparable to state-of-the-art despite targeting substantially smaller lesions.
Significance. If the reported performance holds, this work is clinically valuable because small brain metastases are notoriously difficult to detect and are becoming increasingly important with the shift toward stereotactic radiation treatment of individual lesions. The manuscript's strengths include a well-designed patient-wise five-fold cross-validation scheme that prevents data leakage, a clear focus on a clinically challenging lesion-size regime, a single-sequence protocol that is simpler than multi-sequence alternatives, and a transparent reporting of the sensitivity-versus-false-positive trade-off. The technical novelties (sensitivity-constrained LoG candidate selection, 3D elastic deformation augmentation, and volumetric gamma correction) are reasonable and potentially reusable. However, the central quantitative claims rest on an unspecified candidate-to-lesion matching criterion, which compromises reproducibility and the validity of cross-study comparisons.
major comments (3)
- [Section II.A, Eqs. (3)–(5)] The definition of sensitivity for both the LoG candidate-selection stage and the final detection stage is incomplete because the manuscript never specifies the criterion by which a candidate point is considered to match an actual BM center. Equations (3)–(5) reference 'actual BM centers' and candidate points, but the distance threshold or overlap rule is not given. Since the mean BM diameter is only 5.45 mm, a loose match radius (e.g., 5–10 mm) could inflate the reported 95.8% candidate-selection sensitivity and the final 90% sensitivity / 9.12 AFP result. This is load-bearing: the candidate-selection sensitivity is the upper bound on the final detection sensitivity, and the AFP numbers similarly depend on how candidate detections are counted. The authors must state the exact matching rule (e.g., Euclidean distance from candidate to annotated center within a fixed radius, or overlap with the ground-truth mask) and ideally report how the results vary with that threshold.
- [Table I and Section V] The claim that the framework is 'comparable with state-of-art approaches' is not substantiated because the comparison in Table I relies on AFP and sensitivity numbers measured on different datasets, different MRI sequences, different lesion sizes, and, most importantly, potentially different matching conventions. Without a common evaluation protocol or a head-to-head comparison on the same data, the AFP values from Charron et al. [11] and Grøvik et al. [15] are not directly comparable to those reported here. The authors should either temper the 'comparable' conclusion to 'reported in the same range' with explicit caveats, or perform a direct comparative experiment on a shared dataset.
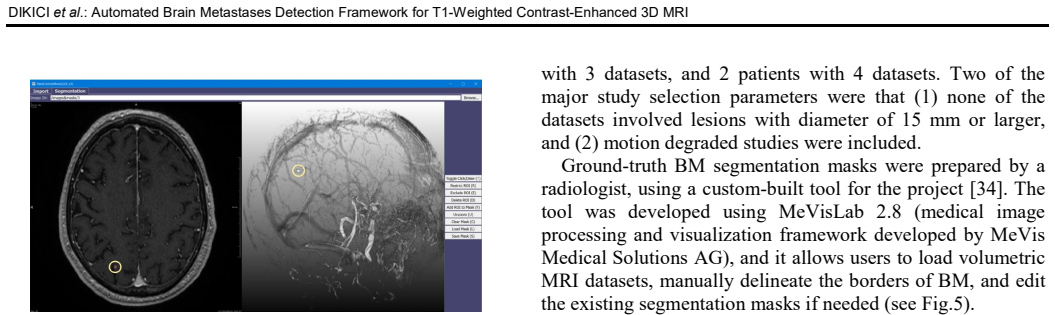
- [Section III.A] The ground truth was prepared by a single radiologist, and the manuscript provides no inter-observer variability analysis. For small lesions that are difficult even for expert radiologists to identify consistently, single-reader ground truth can bias both sensitivity and false-positive estimates in an unknown direction. The authors should acknowledge this limitation explicitly and, if feasible, include a subset of cases annotated by a second reader to quantify agreement. At minimum, the discussion of limitations should be expanded to mention this point.
minor comments (7)
- [Abstract and throughout] The phrase 'state-of-art' should be 'state-of-the-art' for consistency and correctness.
- [Section II.B.3 and Fig. 4] The text states that the sigmoid output holds a value in the range [0,1], but the caption of Fig. 4 says the output is in the range [-1,1]. Please correct the inconsistency.
- [Section II.B.2, Eq. (6)] The gamma correction is described as 'given by' followed by Eq. (6), but the equation itself is missing from the text. Please insert the actual formula.
- [Section II.B] The description of the batch size as 'a batch of 2N samples where N is the number of training cases' is confusing. Please clarify the typical batch size used in practice and how it scales with the number of training cases per fold.
- [Section II.A] The optimization in Eqs. (3)–(5) is called a 'minimax problem,' but the implemented solution is a grid search with a sensitivity constraint. Please rephrase to avoid overstating the optimization methodology.
- [Reference [34]] Reference [34] appears to be an in-press or unpublished manuscript ('Paper RYAI-18-0095'). Please provide full publication details or a DOI so readers can access it.
- [Section IV] The sentence 'The framework contained CropNet-b2-16mm' should be reworded, e.g., 'The framework used CropNet-b2-16mm.'
Circularity Check
No significant circularity: the framework's sensitivity and false-positive results are measured on held-out cross-validation folds, and no fitted parameter is renamed as a prediction.
full rationale
This is an empirical detection paper rather than a derivation, and its central results are direct measurements on held-out test folds. The candidate-selection stage optimizes LoG parameters on training bins with a sensitivity constraint (Eq. 5), but the reported 95.8% mean candidate-selection sensitivity is evaluated on both training and testing groups of each fold, not assumed from the constraint. The final AFP-at-sensitivity curve is obtained by varying the CropNet output threshold and counting detections on test data, so the headline 90%/9.12 point is an observed operating point, not an input refit as a prediction. Hyperparameters such as gamma range, elastic deformation parameters, and network architecture are chosen empirically or by expert visual inspection before evaluation, which constitutes standard model selection rather than circularity. The most notable weakness is the unspecified distance threshold for deciding when a candidate 'detects' a BM center, which affects reproducibility and comparability with other studies; however, this is a missing evaluation-criterion detail, not a step where a result reduces to its own input by construction. There is a self-citation to the authors' prior work for the ground-truth annotation tool (Ref. 34), but it is not load-bearing for the detection performance claim. No fitted quantity is presented as an independent prediction, no uniqueness theorem is imported from the authors' own prior work, and no known result is merely renamed. Therefore the paper is not circular.
Assumptions & free parameters
free parameters (6)
- LoG scale range (sigma_min, sigma_max) =
unknown; grid-searched per fold
- LoG threshold =
unknown; grid-searched
- Gamma correction range =
unknown; empirical uniform range
- Elastic deformation parameters (sigma, alpha) =
unknown; adopted from Simard et al.
- CropNet input edge length =
16 mm
- Number of blocks per resolution level =
2
assumptions (4)
- domain assumption All brain metastases present as blob-like local intensity extrema in T1-weighted contrast-enhanced MRI.
- domain assumption The radiologist-drawn segmentation masks are accurate enough to serve as ground truth.
- domain assumption Data augmentation via elastic deformation and gamma correction generates plausible variations of BM appearance.
- standard math Standard scale-space theory for LoG blob detection.
Cite this review
Pith. "Pith review of Automated Brain Metastases Detection Framework for T1-Weighted Contrast-Enhanced 3D MRI." pith.science (2026). https://pith.science/paper/GBEEIATB
@misc{pith2026190804701,
  author       = {Pith},
  title        = {Pith review of: Automated Brain Metastases Detection Framework for T1-Weighted Contrast-Enhanced 3D MRI},
  year         = {2026},
  howpublished = {\url{https://pith.science/paper/GBEEIATB}},
  note         = {Machine review of arXiv:1908.04701}
}
read the original abstract
Brain Metastases (BM) complicate 20-40% of cancer cases. BM lesions can present as punctate (1 mm) foci, requiring high-precision Magnetic Resonance Imaging (MRI) in order to prevent inadequate or delayed BM treatment. However, BM lesion detection remains challenging partly due to their structural similarities to normal structures (e.g., vasculature). We propose a BM-detection framework using a single-sequence gadolinium-enhanced T1-weighted 3D MRI dataset. The framework focuses on detection of smaller (< 15 mm) BM lesions and consists of: (1) candidate-selection stage, using Laplacian of Gaussian approach for highlighting parts of a MRI volume holding higher BM occurrence probabilities, and (2) detection stage that iteratively processes cropped region-of-interest volumes centered by candidates using a custom-built 3D convolutional neural network ("CropNet"). Data is augmented extensively during training via a pipeline consisting of random gamma correction and elastic deformation stages; the framework thereby maintains its invariance for a plausible range of BM shape and intensity representations. This approach is tested using five-fold cross-validation on 217 datasets from 158 patients, with training and testing groups randomized per patient to eliminate learning bias. The BM database included lesions with a mean diameter of ~5.4 mm and a mean volume of ~160 mm3. For 90% BM-detection sensitivity, the framework produced on average 9.12 false-positive BM detections per patient (standard deviation of 3.49); for 85% sensitivity, the average number of false-positives declined to 5.85. Comparative analysis showed that the framework produces comparable BM-detection accuracy with the state-of-art approaches validated for significantly larger lesions.
Figures
Figures from the paper (4 more)
Reference graph
Works this paper leans on
-
[11]
O. Charron, A. Lallement, D. Jarnet, V. Noblet, J.- B. Clavier, and P. Meyer, “Automatic detection and segmentation of brain metastases on multimodal MR images with a deep convolutional neural network,” Comput. Biol. Med., vol. 95, pp. 43–54, 2018
work page 2018
-
[15]
T. Sugimoto, S. Katsuragawa, T. Hirai, R. Murakami, and Y. Yamashita, “Computerized detection of metastatic brain tumors on contrast- enhanced 3D MR images by using a selective enhancement filter,” in Proc. World Congr. Med. Phys. Biomed. Eng., 2009, pp. 2070–2072
work page 2009
-
[1]
Random Elastic Deformations Plausible no n-rigid augmentations of the BM regions are produced by generalizing the random elastic deformation field generation algorithm proposed by Simard et al [25] from 2D to 3D . For a given volumetric image data , random displacements fields , , and are defined, where each of these has similar dimensions as , and their ...
-
[2]
Usage of bias field correction might improve the predictability of tissue intensities
Random Gamma Corrections In MRI, tissues do not have consistent intensity ranges, such as in computed tomography. Usage of bias field correction might improve the predictability of tissue intensities. However, its success is limited due to machine - dependent parameters [26] . Medical image processing algorithms, both information- theory and DNN based, be...
-
[3]
For 90% BM -detection sensitivity, the framework produced on average 9.12 false- positive BM detections per patient (standard deviation of 3.49); for 85% sensitivity, t he average number of false- positives declined to 5.85. Comparative analysis showed that the framework produces comparable BM -detection accuracy with the state-of -art approaches validate...
work page 2019
-
[4]
To our knowledge, no prior work focused on BM with volumes smaller than 500 mm 3
Such tiny lesions are difficult for even experienced neuroradiologists to detect, and missed lesions can lead to inadequate or delayed treatment. To our knowledge, no prior work focused on BM with volumes smaller than 500 mm 3. Detection of small lesions is particularly important given the clinical challenge they represent and due to recent paradigm shift...
-
[5]
Computer-aided detection of metastatic brain tumors using magnetic resonance black-blood imaging,
S. Yang, Y. Nam, M.- O. Kim, E. Y. Kim, J. Park, and D.- H. Kim, “Computer-aided detection of metastatic brain tumors using magnetic resonance black-blood imaging,” Invest. Radiol., vol. 48, no. 2, pp. 113– 119, 2013
work page 2013
-
[6]
Network Architecture The CNN introduced in this study (i.e., CropNet ) has an input layer with an isotropic -sampled volumetric region of interest (ROI), where each voxel represents 1 mm 3. Please note that the input volume’s edge length is used in model naming, such as CropNet - mm, where is the volume’s edge length in mm. Besides, the model follows a ty...
Show all 45 references
-
[7]
Epidemiology of brain metastases,
L. Nayak, E. Q. Lee, and P. Y. Wen, “Epidemiology of brain metastases,” Curr. Oncol. Rep., vol. 14, no. 1, pp. 48–54, 2012
2012
-
[8]
Computer-aided detection of brain metastases using a three -dimensional template-based matching algorithm,
Ú. Pérez-Ramírez, E. Arana, and D. Moratal, “Computer-aided detection of brain metastases using a three -dimensional template-based matching algorithm,” in Proc. Annu. Int. Conf. IEEE Eng. Med. Biol. Soc., 2014, pp. 2384–2387
2014
-
[9]
Computer-aided detection of metastatic brain tumors using automated three -dimensional template matching,
R. D. Ambrosini, P. Wang, and W. G. O’dell, “Computer-aided detection of metastatic brain tumors using automated three -dimensional template matching,” J. Magn. Reson. Imaging, vol. 31, no. 1, pp. 85–93, 2010
2010
-
[10]
An approach for compute r-aided detection of brain metastases in post -Gd T1-W MRI,
R. Farjam, H. A. Parmar, D. C. Noll, C. I. Tsien, and Y. Cao, “An approach for compute r-aided detection of brain metastases in post -Gd T1-W MRI,” Magn. Reson. Imaging, vol. 30, no. 6, pp. 824–836, 2012
2012
-
[12]
3D brain tumor segmentation in MRI using fuzzy classification, symmetry analysis and spatially constrained deformable models,
H. Khotanlou, O. Colliot, J. Atif, and I. Bloch, “3D brain tumor segmentation in MRI using fuzzy classification, symmetry analysis and spatially constrained deformable models,” Fuzzy Sets Syst., vol. 160, no. 10, pp. 1457–1473, 2009
2009
-
[13]
Automated robust image segmentation: Level set method using nonnegative matrix factorization with application to brain MRI,
D. Dera, N. Bouaynaya, and H. M. Fathallah -Shaykh, “Automated robust image segmentation: Level set method using nonnegative matrix factorization with application to brain MRI,” Bull. Math. B iol., vol. 78, no. 7, pp. 1450–1476, 2016
2016
-
[14]
The system yielded an average Dice similarity coefficient of 0.67, where the detection false- positive rate in connection to the sensitivity percentage is not reported
and their post -contrast T1 -weighted MRI collection of brain metastases with a mean tumor volume of 672 mm 3. The system yielded an average Dice similarity coefficient of 0.67, where the detection false- positive rate in connection to the sensitivity percentage is not reporte...
-
[16]
Identifying the best machine learning algorithms for brain tumor segmentation, progression assessment, and overall survival prediction in the BRATS challenge,
S. Bakas et al. , “Identifying the best machine learning algorithms for brain tumor segmentation, progression assessment, and overall survival prediction in the BRATS challenge,” arXiv Prepr. arXiv 1811.02629, 2018
2018 arXiv
-
[17]
Detection and segmentation of brain metastases with deep convolutional networks,
M. Losch, “Detection and segmentation of brain metastases with deep convolutional networks,” M.S. thesis, KTH, Computer Vision and Active Perception, CVAP, 2015
2015
-
[18]
Efficient multi-scale 3D CNN with fully connected CRF for accurate brain lesion segmentation,
K. Kamnitsas et al., “Efficient multi-scale 3D CNN with fully connected CRF for accurate brain lesion segmentation,” Med. Image Anal., vol. 36, pp. 61–78, 2017
2017
-
[19]
A deep convolutional neural network -based automatic delineation strategy for multiple brain metastases stereotactic radiosurgery,
Y. Liu et al. , “A deep convolutional neural network -based automatic delineation strategy for multiple brain metastases stereotactic radiosurgery,” PLoS One, vol. 12, no. 10, p. e0185844, 2017
2017
-
[20]
The multimodal brain tumor image segmentation benchmark (BRATS),
B. H. Menze et al., “The multimodal brain tumor image segmentation benchmark (BRATS),” IEEE Trans. Med. Imaging , vol. 34, no. 10, pp. 1993–2024, 2014
1993
-
[21]
Deep learning enables automatic detection and segmentation of brain metastases on multi- sequence MRI,
E. Grøvik, D. Yi, M. Iv, E. Tong, D. L. Rubin, and G. Zaharchuk, “Deep learning enables automatic detection and segmentation of brain metastases on multi- sequence MRI,” arXiv Prepr. arXiv1903.07988 , 2019
2019 arXiv
-
[22]
Going deeper with convolutions,
C. Szegedy et al. , “Going deeper with convolutions,” in Proc. IEEE Conf. Comput. Vis. Pattern Recognit., 2015, pp. 1–9
2015
-
[23]
Whole brain radiotherapy for brain metastasis,
E. McTyre, J. Scott, and P. Chinnaiyan, “Whole brain radiotherapy for brain metastasis,” Surg. Neurol. Int., vol. 4, no. Suppl 4, p. S236, 2013
2013
-
[24]
Image matching using generalized scale -space interest points,
T. Lindeberg, “Image matching using generalized scale -space interest points,” J. Math. Imaging Vis., vol. 52, no. 1, pp. 3–36, 2015
2015
-
[25]
Scale selection properties of generalized scale- space interest point detectors,
T. Lindeberg, “Scale selection properties of generalized scale- space interest point detectors,” J. Math. Imaging Vis. , vol. 46, no. 2, pp. 177 – 210, 2013
2013
-
[26]
3D blob based brain tumor detection and segmentation in MR images,
C.-P. Yu, G. Ruppert, R. Collins, D. Nguyen, A. Falcao, and Y. Liu, “3D blob based brain tumor detection and segmentation in MR images,” in Proc. IEEE 11th Int. Symp. Biomed. Imag., 2014, pp. 1192–1197
2014
-
[27]
Machine learning and radiology,
S. Wang and R. M. Summers, “Machine learning and radiology,” Med. Image Anal., vol. 16, no. 5, pp. 933–951, 2012
2012
-
[28]
V -net: Fully convolutional neural networks for volumetric medical image segmentation,
F. Milletari, N. Navab, and S.- A. Ahmadi, “V -net: Fully convolutional neural networks for volumetric medical image segmentation,” in Proc. IEEE 4th Int. Conf. 3D Vis., 2016, pp. 565–571
2016
-
[29]
Discriminative unsupervised feature learning with exemplar convolutional neural networks,
A. Dosovitskiy, P. Fischer, J. T. Spring enberg, M. Riedmiller, and T. Brox, “Discriminative unsupervised feature learning with exemplar convolutional neural networks,” IEEE Trans. Pattern Anal. Mach. Intell., vol. 38, no. 9, pp. 1734–1747, 2015
2015
-
[30]
U -net: Convolutional networks for biomedical image segmentation,
O. Ronneberger, P. Fischer, and T. Brox, “U -net: Convolutional networks for biomedical image segmentation,” in Proc. Int. Conf. Med. Image Comput. Comput.-Assisted Intervent., 2015, pp. 234–241
2015
-
[31]
Best practices for convolutional neural networks appli ed to visual document analysis,
P. Y. Simard, D. Steinkraus, and J. C. Platt, “Best practices for convolutional neural networks appli ed to visual document analysis,” in Seventh International Conference on Document Analysis and Recognition, 2003. Proceedings., 2003, vol. 1, pp. 958–963
2003
-
[32]
Tissue-based MRI intensity standardization: Application to multicentric datasets,
N. Robitaille, A. Mouiha, B. Crépeault, F. Valdivia, and S. Duchesne, “Tissue-based MRI intensity standardization: Application to multicentric datasets,” J. Biomed. Imaging, vol. 2012, p. 4, 2012. DIKICI et al.: Automated Brain Metastases Detection Framework for T1-Weighted Co...
2012
-
[33]
Evaluating intensity normalization on MRIs of human brain with multiple sclerosis,
M. Shah et al. , “Evaluating intensity normalization on MRIs of human brain with multiple sclerosis,” Med. Image Anal., vol. 15, no. 2, pp. 267– 282, 2011
2011
-
[34]
Normalization of brain magnetic resonance images using histogram even-order derivative analysis,
J. D. Christensen, “Normalization of brain magnetic resonance images using histogram even-order derivative analysis,” Magn. Reson. Imaging, vol. 21, no. 7, pp. 817–820, 2003
2003
-
[35]
Comparison between intensity normalization techniques for dynamic susceptibility contrast (DSC) -MRI estimates of cerebral blood volume (CBV) in human gliomas,
B. M. Ellingson et al. , “Comparison between intensity normalization techniques for dynamic susceptibility contrast (DSC) -MRI estimates of cerebral blood volume (CBV) in human gliomas,” J. Magn. Reson. Imaging, vol. 35, no. 6, pp. 1472–1477, 2012
2012
-
[36]
New variants of a method of MRI scale standardization,
L. G. Nyúl, J. K. Udupa, and X. Zhang, “New variants of a method of MRI scale standardization,” IEEE Trans. Med. Imaging , vol. 19, no. 2, pp. 143–150, 2000
2000
-
[37]
Patch based intensity normalization of brain MR images,
S. Roy, A. Carass, and J. L. Prince, “Patch based intensity normalization of brain MR images,” in Proc. IEEE 10th Int. Symp. Biomed. Imag. , 2013, pp. 342–345
2013
-
[38]
Data-driven color augmentation techniques for deep skin image analysis,
A. Galdran et al., “Data-driven color augmentation techniques for deep skin image analysis,” arXiv Prepr. arXiv1703.03702, 2017
2017 arXiv
-
[39]
Understanding the difficulty of training deep feedforward neural networks,
X. Glorot and Y. Bengio, “Understanding the difficulty of training deep feedforward neural networks,” in Proc. 13th Int. Con f. Artif. Intell. Statist., 2010, pp. 249–256
2010
-
[40]
A user interface for optimizing radiologist engagement in image- data curation for artificial intelligence,
M. Demirer et al. , “A user interface for optimizing radiologist engagement in image- data curation for artificial intelligence,” Radiol. Artif. Intell., Paper RYAI-18-0095
-
[41]
Mutual - information-based registration of medical images: A survey,
J. P. W. Pluim, J. B. A. Ma intz, and M. A. Viergever, “Mutual - information-based registration of medical images: A survey,” IEEE Trans. Med. Imaging, vol. 22, no. 8, pp. 986–1004, 2003
2003
-
[42]
Machine learning for medical imagin g,
B. J. Erickson, P. Korfiatis, Z. Akkus, and T. L. Kline, “Machine learning for medical imagin g,” Radiographics, vol. 37, no. 2, pp. 505 – 515, 2017
2017
-
[43]
Hyperparameter importance across datasets,
J. N. van Rijn and F. Hutter, “Hyperparameter importance across datasets,” in Proc. 24th ACM SIGKDD Int. Conf. Knowl. Discovery Data Mining, 2018, pp. 2367–2376
2018
-
[44]
Me trics for evaluating 3D medical image segmentation: Analysis, selection, and tool,
A. A. Taha and A. Hanbury, “Me trics for evaluating 3D medical image segmentation: Analysis, selection, and tool,” BMC Med. Imaging , vol. 15, no. 1, p. 29, 2015
2015
-
[45]
Kernel Density Estimation and Classification,
T. Hastie, R. Tibshirani, and J. Friedman, “Kernel Density Estimation and Classification,” in The elements of statistical learning: Data mining, inference, and prediction, Springer, 2009, pp. 208–212
2009
Reviewed August 14, 2026 · model on record in the stance chip above.
Discussion (0). Continue with ORCID to comment.