REVIEW 3 major objections 5 minor 1 cited by
R-miss-tastic: a unified platform for missing values methods and workflows
T0 review · 3 major / 5 minor · reviewed 2026-08-14 · deepseek-v4-flash
Pith's one-line read This paper introduces R-miss-tastic, an open platform that gathers missing-data resources and supplies reproducible R and Python workflows for generating missing values, imputing them, estimating parameters, and predicting outcomes.
desk verdict A useful and honest resource paper that curates missing-data tools and workflows, with illustrative rather than definitive simulations behind its recommendations. read the letter →
The pith
A machine-rendered reading of the paper's core claim, the machinery that carries it, and where it could break.
The reading
What carries the argument
The load-bearing object is the platform itself together with its standardized workflows. The organizing scientific machinery is the three-way taxonomy of missingness mechanisms (missing completely at random, missing at random, missing not at random), which the workflows use to generate missing values in a controlled way. Around that taxonomy, the paper builds comparison protocols: a common function for generating missing values, a mean-squared-error benchmark for imputation, and a train/test prediction-scoring function, each implemented symmetrically in R and Python. The routines are written generically so a user can swap in their own data or methods.
What would settle it
Run the parameter-estimation workflow on a dataset whose covariates are skewed or mixed-type rather than multivariate normal and show that multiple imputation produces less biased logistic-regression coefficients than the EM implementation; that would overturn the platform's illustrative recommendation. A simpler check is to rerun each published workflow from the platform's public code on a fresh machine and see whether the reported rankings reproduce.
Extended reading notes
Core claim
The paper's central discovery is that the scattered missing-data landscape can be organized into a single, documented, extendable resource with standardized workflows. It establishes that missing-data generation can be unified through functions that produce MCAR, MAR, and MNAR values on complete or already incomplete data; that imputation methods can be compared by a common mean-squared-error protocol on simulated and real data; that for parameter estimation under a Gaussian covariate model with MAR missingness, an EM-based joint model gives less biased logistic-regression estimates than multiple imputation; and that for prediction on linearly generated data, imputing train and test sets with the same constant and adding the missingness indicator performs well, while a one-step missingness-aware tree method is a strong option under MNAR. These findings are presented as illustrations of the workflows rather than as universal prescriptions.
Load-bearing premise
The load-bearing assumption is that the simulation setups used in the workflows are representative enough of real missing-data problems; if real data do not look like multivariate-normal covariates with linear targets, the recommended methods may not transfer.
Editorial extensions
If this is right
- An analyst with incomplete data can run the platform's code on their own dataset and get a concrete ranking of imputation or estimation methods without writing bespoke simulation code.
- Researchers proposing a new imputation method gain a ready-made benchmark: generate missingness under a chosen mechanism, compare by mean squared error against standard methods, and report reproducible code.
- Teachers can use the lecture, bibliography, and workflow material to bring missing-data practice into statistics curricula where it is currently absent.
- The illustrative recommendations carry caveats: the EM-over-imputation result assumes Gaussian covariates, and the linear-regression-over-trees prediction result assumes a linear target, so users should check whether their data match those conditions.
Reading between the lines
- If the platform becomes the community's default benchmark, new missing-data methods will likely be judged against a common set of datasets and workflows, which could make published comparisons more decisive.
- The absence of a Python estimation workflow points to a gap: porting the EM-based estimation pipeline to Python would let the platform cover all four tasks in both languages.
- An obvious testable extension is a set of MNAR-focused workflows, since the paper lists this as future work and the current imputation results show all methods degrade toward mean imputation under MNAR.
- The platform's usefulness depends on continued curation; without a maintenance process, its recommendations will age as packages and methods change.
Signed reviews
Editorial analysis
A structured set of objections, weighed in public.
Referee Report
Summary. The paper presents R-miss-tastic, an open web platform that collects, organizes, and creates missing-data resources: a bibliography, lecture materials, an R package overview (building on a CRAN Task View), a dataset list, and a set of reproducible workflows in R and Python for generating missing values, imputation, parameter estimation, and prediction with incomplete data. The manuscript describes the platform structure, gives code excerpts and outputs, and formulates practical recommendations, e.g., using mean imputation with a universally consistent learner for prediction and the misaem EM implementation for estimation under Gaussian MAR assumptions.
Significance. If the platform is maintained, it fills a real community need: a single entry point for teaching, bibliography, and software for missing data, with reproducible workflows that can be extended. The public GitHub repository, the CRAN Task View, and the dual R/Python implementations are concrete, verifiable artifacts. The paper is transparent about several limitations, including the statement in Section 3 that the workflows do not cover the entire spectrum of methods. The main risk is that some comparative recommendations are drawn from narrow simulations with no uncertainty quantification.
major comments (3)
- [Section 3.3] The sentence "For this simulated data set, which follows the multivariate normal distribution, misaem gives less biased results than mice" presents a general comparative claim without Monte Carlo repetition or standard errors. Since the workflow is introduced as guidance for practitioners, the claim is load-bearing. Either add a small simulation study with several configurations (varying sample size, number of covariates, missingness rate, and signal strength) and report standard errors, or explicitly label the result as a single illustrative example tied to the Gaussian/MAR assumptions.
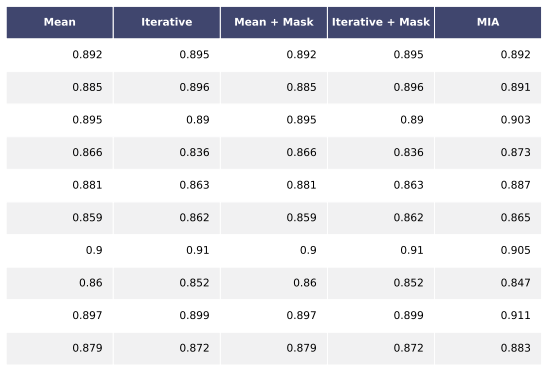
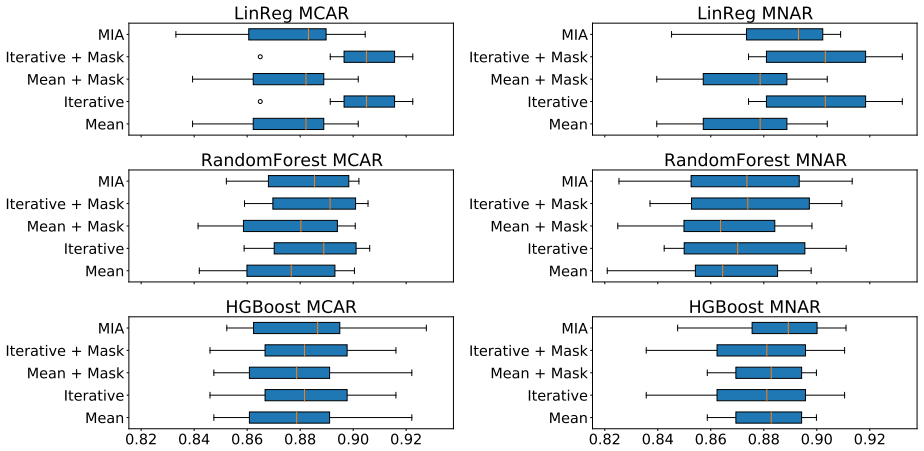
- [Section 3.4] The recommendation to "impute the train set and the test set with the same constant, as the mean, and then apply a universally consistent learner" is justified by the consistency theorem of Josse et al. (2019), a self-cited arXiv preprint not independently verified here, and the finite-sample illustration in Figure 9 uses nbsim = 10, no error bars, and a linear-regression data-generating process that the paper acknowledges favors linear regression. The transfer of this guidance to non-Gaussian, nonlinear, or heteroscedastic settings is untested; please either broaden the evidence or substantially soften the recommendation.
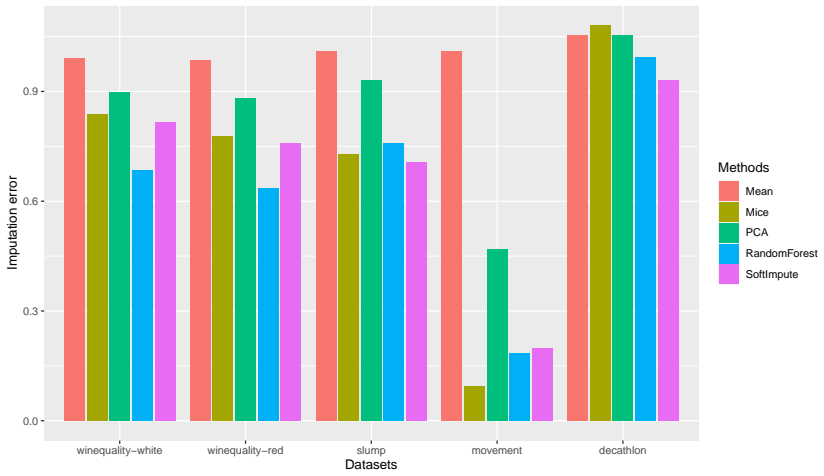
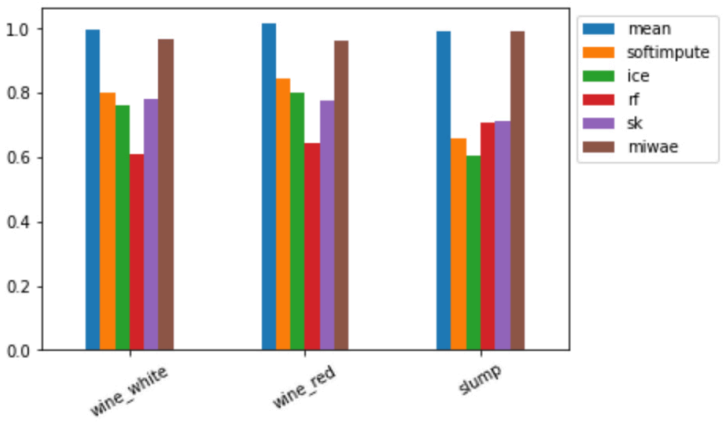
- [Section 3.2] The imputation comparisons in Figures 5-7 and the associated tables report only means over nbsim = 10 repetitions, with no standard errors or confidence intervals, and the simulation design is a single multivariate normal model with exchangeable correlation. For a platform that aims to give guidance on choosing a method, the lack of uncertainty quantification in these rankings is a concern; report variability across repetitions and at least a small set of data-generating scenarios, or reframe the outputs as purely illustrative.
minor comments (5)
- [Section 3.1] The formula for P(R1 = 0|X; φ) is missing a closing parenthesis: 1/(1 + exp(−(φ2X2 + φ3X3)) should read 1/(1 + exp(−(φ2X2 + φ3X3))).
- [Section 3.2] Figure 6 caption states "10% MCAR missing values" but the code in Listing 9 sets perc <- 0.2, which is 20%; the caption and the code should be consistent.
- [Section 3.4] The phrase "Missing Incorparated in Attributes" appears twice and should be "Missing Incorporated in Attributes".
- [References] The reference "Rubin, D. B. Multiple imputation after 18+ years. Journal of the American Statistical Association 91.434 (2012)" is misdated; the article appeared in 1996.
- [Code listings] Several code listings contain artifacts from line wrapping (e.g., "me ch an is m" in Listing 1); if the PDF is the final version, these should be cleaned.
Circularity Check
No circularity: the platform's workflows and recommendations are self-contained, and the cited consistency theorem is an independent prior result.
full rationale
The paper's central claim is the existence, structure, and reproducibility of the R-miss-tastic platform, not a new derivational result about missing-data methods. The simulation-based comparisons are presented as illustrative workflows rather than as predictions from first principles. For example, Section 3.3 states: 'For this simulated data set, which follows the multivariate normal distribution, misaem gives less biased results than mice. This was expected as misaem fits here perfectly with the parametric assumptions.' Section 3.4 similarly states: 'Note that the simulated dataset is generated considering a linear regression, which explains why the linear regression gives better results than other learners.' These passages explicitly tie the comparative conclusions to the data-generating assumptions, so no fitted input is relabeled as a prediction and no conclusion is forced by construction. The only self-citation is the Section 3.4 recommendation of constant imputation plus a universally consistent learner, attributed to Josse et al. (2019); that is a prior research paper with its own arguments and is not a result derived from the platform's own outputs or fitted values. Finally, the paper disclaims generality at the start of Section 3: 'we are aware that these workflows do not cover the entire spectrum of existing methods and data problems,' further showing that the workflows are deliberately framed as starting points, not as universal prescriptions. Consequently, no equation or recommendation reduces by construction to its own inputs.
Assumptions & free parameters
assumptions (3)
- domain assumption Rubin's taxonomy of missing data mechanisms (MCAR, MAR, MNAR) is a valid and sufficient classification for the workflows.
- domain assumption The asymptotic consistency result for mean imputation plus a universally consistent learner, cited to Josse et al. (2019) and used in Section 3.4 for the prediction recommendation.
- standard math Rubin's rules for pooling multiple imputation estimates provide valid inference.
Cite this review
Pith. "Pith review of R-miss-tastic: a unified platform for missing values methods and workflows." pith.science (2026). https://pith.science/paper/RQ3L2PTA
@misc{pith2026190804822,
  author       = {Pith},
  title        = {Pith review of: R-miss-tastic: a unified platform for missing values methods and workflows},
  year         = {2026},
  howpublished = {\url{https://pith.science/paper/RQ3L2PTA}},
  note         = {Machine review of arXiv:1908.04822}
}
read the original abstract
Missing values are unavoidable when working with data. Their occurrence is exacerbated as more data from different sources become available. However, most statistical models and visualization methods require complete data, and improper handling of missing data results in information loss or biased analyses. Since the seminal work of Rubin (1976), a burgeoning literature on missing values has arisen, with heterogeneous aims and motivations. This led to the development of various methods, formalizations, and tools. For practitioners, it remains nevertheless challenging to decide which method is most suited for their problem, partially due to a lack of systematic covering of this topic in statistics or data science curricula. To help address this challenge, we have launched the "R-miss-tastic" platform, which aims to provide an overview of standard missing values problems, methods, and relevant implementations of methodologies. Beyond gathering and organizing a large majority of the material on missing data (bibliography, courses, tutorials, implementations), "R-miss-tastic" covers the development of standardized analysis workflows. Indeed, we have developed several pipelines in R and Python to allow for hands-on illustration of and recommendations on missing values handling in various statistical tasks such as matrix completion, estimation and prediction, while ensuring reproducibility of the analyses. Finally, the platform is dedicated to users who analyze incomplete data, researchers who want to compare their methods and search for an up-to-date bibliography, and also teachers who are looking for didactic materials (notebooks, video, slides).
Figures


Figures from the paper (3 more)
Forward citations
Cited by 1 Pith paper
-
How to rank imputation methods?
The energy-I-Score ranks imputation methods by comparing observed values with repeated imputations using the energy score, and is claimed to be proper under a new condition, CIMAR_j.
Reference graph
Works this paper leans on
-
[1]
write newline
" write newline "" before.all 'output.state := FUNCTION article output.bibitem format.authors "author" output.check author format.key output output.year.check new.block format.title "title" output.check new.block crossref missing format.jour.vol output format.article.crossref output.nonnull format.pages output if new.block note output fin.entry FUNCTION b...
-
[2]
Bennett, J., S. Lanning, and Netflix (2007). The netflix prize. In Proceedings of KDD Cup and Workshop , Volume 2007, pp.\ 35. cs.uic.edu
work page 2007
-
[3]
Carpenter, J. and M. Kenward (2012, December). Multiple Imputation and its Application . John Wiley & Sons
work page 2012
-
[4]
Cheng, X., D. Cook, and H. Hofmann (2015). Visually exploring missing values in multivariable data using a graphical user interface. Journal of statistical software\/ 68\/ (1), 1--23
work page 2015
-
[5]
Dua, D. and C. Graff (2019). UCI machine learning repository
work page 2019
-
[6]
Enders, C. (2010). Applied Missing Data Analysis . Guilford Press
work page 2010
-
[7]
Gelman, A. and J. Hill (2011). Opening windows to the black box. Journal of Statistical Software\/ 40
work page 2011
-
[8]
Gondara, L. and K. Wang (2018). Mida: Multiple imputation using denoising autoencoders. In D. Phung, V. Tseng, G. Webb, B. Ho, M. Ganji, and L. Rashidi (Eds.), Proceedings of the 22nd Pacific-Asia Conference on Knowledge Discovery and Data Mining (PAKDD 2018) , Lecture Notes in Computer Science, pp.\ 260--272. Springer International Publishing
work page 2018
Show all 27 references
-
[9]
King, and M
Honaker, J., G. King, and M. Blackwell (2011). Amelia II : A program for missing data. Journal of Statistical Software\/ 45\/ (7), 1--47
2011
-
[10]
Ihaka, R. (1998). R : past and future history. A draft paper for Interface '98
1998
-
[11]
Josse, J. and F. Husson (2016). missMDA : A package for handling missing values in multivariate data analysis. Journal of Statistical Software\/ 70\/ (1), 1--31
2016
-
[12]
Prost, E
Josse, J., N. Prost, E. Scornet, and G. Varoquaux (2019). On the consistency of supervised learning with missing values. arXiv preprint\/
2019
-
[13]
Josse, J. and J. P. Reiter (2018). Introduction to the special section on missing data. Statistical Science\/ 33\/ (2), 139--141
2018
-
[14]
Kowarik, A. and M. Templ (2016). Imputation with the R package VIM . Journal of Statistical Software\/ 74\/ (7), 1--16
2016
-
[15]
Little, R. J. A. and D. B. Rubin (2002, September). Statistical Analysis with Missing Data\/ (2nd ed. ed.). New York ; Chichester: Wiley
2002
-
[16]
Spiliotis, and V
Makridakis, S., E. Spiliotis, and V. Assimakopoulos (2018, October). The M4 competition: results, findings, conclusion and way forward. International Journal of Forecasting\/ 34\/ (4), 802--808
2018
-
[17]
Murray, J. S. and J. P. Reiter (2015). Multiple imputation of missing categorical and continuous values via bayesian mixture models with local dependence
2015
-
[18]
Varoquaux, A
Pedregosa, F., G. Varoquaux, A. Gramfort, V. Michel, B. Thirion, O. Grisel, M. Blondel, P. Prettenhofer, R. Weiss, V. Dubourg, J. Vanderplas, A. Passos, D. Cournapeau, M. Brucher, M. Perrot, and E. Duchesnay (2011). Scikit-learn: Machine learning in P ython. Journal of Machine...
2011
-
[19]
Rubin, D. (1976). Inference and missing data. Biometrika\/ 63\/ (3), 581--592
1976
-
[20]
Schafer, J. L. and J. W. Graham (2002, June). Missing data: our view of the state of the art. Psychological methods\/ 7\/ (2), 147--177
2002
-
[21]
Tierney, N., D. Cook, M. McBain, and C. Fay. naniar: Data Structures, Summaries, and Visualisations for Missing Data . R package version 0.2.0
-
[22]
Tierney, N. J. and D. H. Cook (2018). Expanding tidy data principles to facilitate missing data exploration, visualization and assessment of imputations. Preprint arXiv 1809.02264
2018 arXiv
-
[23]
(2012, March)
van Buuren, S. (2012, March). Flexible Imputation of Missing Data . CRC Press
2012
-
[24]
van Buuren , S. and K. Groothuis-Oudshoorn (2011). mice : Multivariate imputation by chained equations in r. Journal of Statistical Software\/ 45\/ (3), 1--67
2011
-
[25]
Van Rossum, G. and F. L. Drake Jr (1995). Python reference manual . Centrum voor Wiskunde en Informatica Amsterdam
1995
-
[26]
Presmanes Hill, and A
Xie, Y., A. Presmanes Hill, and A. Thomas (2017). blogdown: Creating Websites with R Markdow . The R Series. Chapman and Hall/CRC
2017
-
[27]
Wang, and R
Zhu, Z., T. Wang, and R. J. Samworth (2019). High-dimensional principal component analysis with heterogeneous missingness. arXiv preprint\/
2019
Reviewed August 14, 2026 · model on record in the stance chip above.
Discussion (0). Continue with ORCID to comment.