REVIEW 3 major objections 5 minor 32 references
Quasar Main Sequence: a line or a plane?
T0 review · 3 major / 5 minor · reviewed 2026-08-14 · deepseek-v4-flash
Pith's one-line read The paper argues the quasar main sequence is a nonlinear curve; distance along it and from it give two linearly independent coordinates that explain most of the variance, with black hole mass and luminosity as likely drivers.
desk verdict The PCA replication is solid and worth knowing; the new curved-plane claim rests on removing the same outliers that create the correlation, so it is conditional until validated independently. read the letter →
The pith
A machine-rendered reading of the paper's core claim, the machinery that carries it, and where it could break.
The reading
What carries the argument
The load-bearing object is the nonlinear decay curve fitted to the mean-normalized FWHM(Hβ)–$R_{\mathrm{FeII}}$ plane, with $y$ the Hβ FWHM, $x$ the $R_{\mathrm{FeII}}$, and $a,b$ the fitted parameters. Its 'nearpoint' projection assigns each quasar two new coordinates: the arc length along the curve and the perpendicular offset from it. These coordinates serve as a nonlinear analogue of the PCA eigenvectors, and the curve's steep-to-shallow shape is what lets the projection absorb variance that a straight line cannot.
What would settle it
Re-measure Hβ FWHM and RFeII for the ten excluded quasars from high signal-to-noise spectra with a physically motivated Fe II model; if the measurements confirm the catalog values, or if the Spearman correlation between the two new coordinates is still significant (p < 0.05) when the full sample is included, the claimed plane is falsified.
Extended reading notes
Core claim
The central discovery is a re-parameterization of the quasar main sequence in the FWHM(Hβ)–$R_{\mathrm{FeII}}$ plane. Rather than taking the two dominant PCA eigenvectors as straight orthogonal axes, the paper fits a simple two-parameter decay curve to the data and projects each quasar onto its nearest point on that curve. The new principal coordinate is the distance along the curve from a fixed origin; the new secondary coordinate is the Euclidean distance of the data point from the curve. After excluding two groups of five quasars at the curve's ends, these coordinates are linearly independent, and the plane they define accounts for the majority of the variance. The authors identify the main axis as an anti-correlation with black hole mass, with Eddington ratio rising along it, and the secondary axis as an anti-correlation with luminosity, while noting that inclination likely still shapes Hβ width.
Load-bearing premise
The linear independence of the two new axes rests on removing ten quasars at the ends of the fitted curve after the fact; if those objects are real members of the main sequence rather than measurement artifacts, the axes stay correlated and the claimed plane does not exist.
Editorial extensions
If this is right
- The two leading eigenvectors remain dominant in newer high-quality quasar samples, so the main-sequence idea is not an artifact of the original 1992 sample.
- Distance along the decay curve anti-correlates with black hole mass in the reduced Shen sample, making mass the best-supported candidate for the main axis.
- Distance from the curve anti-correlates with luminosity, consistent with the broad-line-region radius–luminosity relation for the secondary axis.
- If the mass interpretation holds, Eddington ratio declines at higher black hole mass along the sequence, possibly tied to a sub-Eddington limit and gas depletion in massive galaxies.
- Inclination is not a primary driver of either axis but likely contaminates Hβ FWHM, so orientation should remain in the modeling.
Reading between the lines
- A natural next test would be to fit the same decay curve to samples with independently measured virial black hole masses and Eddington ratios, rather than catalog estimates, to see whether arc length tracks mass cleanly.
- The same curved-coordinate projection could be applied to rest-frame UV planes such as Mg II or C IV based diagnostics, to test whether the two-coordinate structure persists at higher redshift.
- If the ten excluded quasars are reobserved and turn out to be genuine extreme members of the sequence, the plane would reduce to a line with residual correlation, so their re-measurement is the decisive check.
- The functional form of the fitted curve gives photoionization and disk-structure models a concrete shape to reproduce, turning a geometric claim into a physical prediction.
Signed reviews
Editorial analysis
A structured set of objections, weighed in public.
Referee Report
Summary. The paper applies PCA to two quasar samples — a 30-object XSHOOTER/Capellupo sample and a quality-selected 175-object subset of the Shen et al. (2011) catalog — and finds that two dominant eigenvectors reproduce the classical Boroson & Green result. It then fits a two-parameter decay curve y = 1/(a + x^b) to the FWHM(Hβ)–RFeII plane of the reduced Shen sample, defines two new coordinates (distance along the curve and perpendicular distance from the curve), removes two groups of five outliers at the curve ends to make these coordinates linearly independent, and interprets the main axis as an anti-correlation with black hole mass and the secondary axis as luminosity. The abstract and Section 5 conclude that the quasar main sequence can be described by a plane spanned by these two nonlinear coordinates.
Significance. If the central claim were fully established, the paper would provide a useful nonlinear generalization of the quasar main sequence and a concrete mapping of its two coordinates onto physical drivers. The PCA replication on newer high-quality samples (Table 2) is a genuine contribution, and the paper is clearly written with explicit parameter lists and reproducible enough to be checked. However, the new-plane result rests on a post-hoc exclusion of ten objects and on a variance claim that is not independently quantified, so the significance of the headline claim is currently limited.
major comments (3)
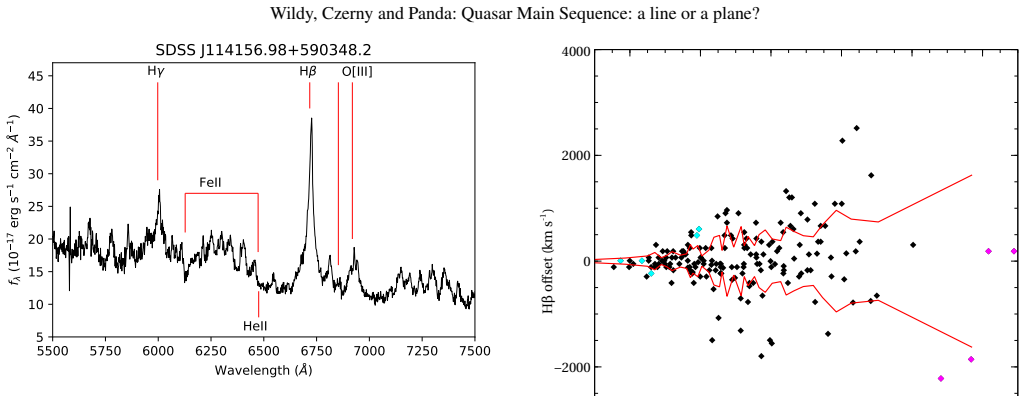
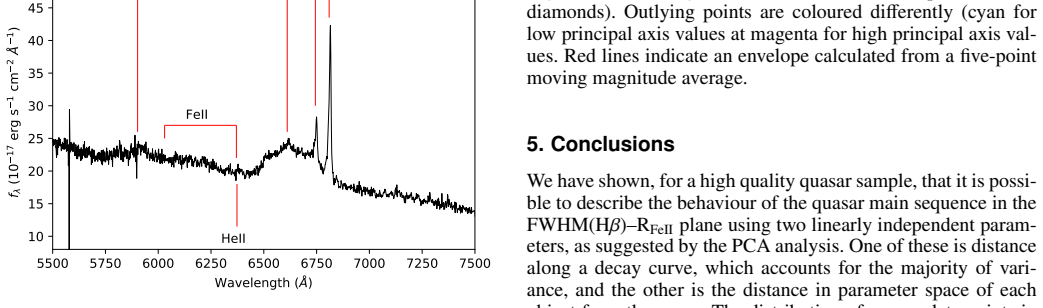
- [Section 3 and Fig. 4] The central claim that the two new parameters are linearly independent rests on the post-hoc removal of ten quasars. For the full reduced Shen sample, the Spearman test on the two new axes gives p = 0.03, i.e., a significant anti-correlation. The removal of the two endpoint groups is decided after observing this correlation, and Section 4.1 supports it only with suggestive evidence: the Sniegowska et al. (2018) result concerns 21/27 objects, the offset-envelope statistic is 60% versus 37% on a sample of ten, and the paper itself says it is "not certain" that RFeII > 1.3 values are accurate and calls the double-peaked Hβ explanation "plausible." No independent test is provided, such as applying the same procedure to the Capellupo sample, to a withheld subset, or to bootstrapped samples with random rejection. The abstract and Section 5 claim that the plane is spanned by linearly independent axes, but this is not established for the full sample and needs either independent validation or an explicit conditional statement.
- [Section 3 and Section 5] The statement that the new plane "accounts for the majority of the variance" is not quantified and is partly circular. The main axis is the arc length along the decay curve whose parameters a and b in Eq. (1) are fitted to the same reduced Shen sample, and the secondary axis is the residual distance from that fitted curve. A two-parameter least-squares curve will by construction reduce the residuals of the training data; what is missing is a variance fraction, a comparison with PCA on the same two variables, and an assessment of out-of-sample behavior. No uncertainties or bootstrap estimates for a, b, or the variance fraction are provided. As written, the variance claim is a property of the fit rather than an independent test.
- [Sections 4 and 5] The physical interpretation — main axis anti-correlating with black hole mass, secondary axis with luminosity — is not quantitatively tested. The supporting evidence is a color-coded figure (Fig. 4) and qualitative statements about correlations; no regression coefficients, Spearman rho values for the new coordinates against MBH and L3000, or partial correlations are given, and no attempt is made to separate the proposed mass/luminosity drivers from the inclination effect discussed in Section 4. Since the abstract and conclusions present these identifications as the main physical result, the authors should either provide the quantitative correlations or weaken the conclusion to a conjecture.
minor comments (5)
- [Section 3 vs. Section 4.1] The outlier threshold is RFeII > 1.2 in Section 3, but Section 4.1 later says "not certain that values of RFeII greater than approximately 1.3" are accurate; please make the threshold consistent.
- [Fig. 2] The vector label "fwhmmg" in Fig. 2 does not match the parameter label "fwhmmg2" used in the text.
- [Table 2] The column headers "Capellupo 17" and "Capellupo 13" should explicitly state that the numbers refer to the number of input parameters, and the caption should indicate that the Boroson & Green column is reproduced from their Table 4 rather than newly computed.
- [Eq. (1)] Please state the allowed domain (x > 0) and note that y diverges as x approaches zero, which motivates the chosen starting point in Section 3.
- [Fig. 7 caption and Section 4.1] The caption says the envelope is calculated from a "five-point moving magnitude average"; this should be clarified (mean or median), and the text "mean envelop" should be corrected to "mean envelope."
Circularity Check
The claimed new plane is defined by a curve fitted to the same data it is said to explain, its mass interpretation reuses the Hβ FWHM that defines the axis, and the linear independence claim survives only after post-hoc exclusion of the very points that violate it.
-
fitted input called prediction
[Section 3 (Non-linear analysis), Eq. (1) and subsequent coordinate definition]
"As a test, we choose a simple decay curve having 2 free parameters of the form shown in Equation 1 y = 1/(a + x^b) where y and x are the Hβ FWHM and RFeII respectively, while a and b are the free parameters. To find a and b we use the nls routine in R to find a fit to the reduced Shen datapoints on the plane. ... The path along of the decay curve can be considered a non-linear analog of the EV1 derived from PCA, while the EV2 would correspond to the perpendicular offset from the curve."
The new principal parameter is the arc length along, and the secondary parameter is the Euclidean distance from, a curve fitted to the same reduced Shen datapoints used in the analysis. The Section 5 conclusion that the new plane 'accounts for the majority of the variance' is therefore a restatement of the fit's residual structure rather than an independent test: the curve was chosen by least-squares fitting to minimize residuals to that very data, so the coordinates are defined in terms of the data they are claimed to explain. No independent sample, cross-validation, or prediction on unseen data is provided. This is a fitted input presented as a validating result, not an independent derivation.
-
self definitional
[Section 4 (Discussion) and Section 5 (Conclusions)]
"It is known from reverberation mapping (Blandford & McKee 1982) that AGN black hole mass scales with the Hβ FWHM, since the calculated masses ... are found to follow the M–σ relation ... This means Eddington ratio should correlate negatively with Hβ FWHM, and indeed a significant anti-correlation between the two is found using a Spearman correlation test on the reduced Shen sample. Is it therefore possible that the new principal parameter is measuring black hole mass? ... The most likely candidate for the new main axis is an anti-correlation with black hole mass."
The new principal axis is distance along a monotonically decreasing curve in Hβ FWHM, so it is effectively monotonically related to the same Hβ FWHM that defines the x-axis of the plane. The black hole masses interpreted here come from the Shen et al. (2011) catalog, whose virial mass estimators are constructed from Hβ FWHM (combined with luminosity). Thus the claimed anti-correlation between the new principal parameter and black hole mass is largely an algebraic consequence of the shared Hβ FWHM input on both sides of the correlation. It is an interpretation of the axis, not an independent confirmation of its physical meaning.
1 more flagged steps
-
other
[Section 3 (Spearman test of linear independence)]
"If these new parameters do indeed represent a plane analogous to EV1 and EV2 from PCA, then they should be linearly independent. However, a Spearman rank correlation test reveals a significant anti-correlation (probability of no correlation p = 0.03) between the new parameters across the sample. A visual examination of the plane in Fig. 3 suggests two outlying populations of five quasars at either end of the decay curve could be responsible. ... With these outliers removed, the significant correlation disappears."
The linearly independent plane advertised in Section 5 is not a property of the full reduced Shen sample: the Spearman test on the full sample gives p = 0.03. Independence is manufactured by deleting the ten objects that visually sit at the ends of the fitted curve after the correlation has already been seen. The paper offers plausible but explicitly uncertain artifact explanations ('It is not certain that values of RFeII greater than approximately 1.3 as derived from the Shen et al. (2011) catalog are accurate'), so the exclusion is not an independent a priori criterion. The central claim is thus made true by post-hoc sample selection rather than by a property demonstrated on the complete dataset.
full rationale
The PCA replication in Sections 2.1-2.3 is a self-contained empirical analysis and is not circular: it reports eigenvalues of the covariance matrices of independent samples, and the conclusion that two eigenvectors dominate is an ordinary, checkable result. The circularity enters at the non-linear step. The new principal and secondary axes are defined from a two-parameter decay curve fitted to the same reduced-Shen datapoints with nls (Eq. 1), so the Section 5 claim that this plane 'accounts for the majority of the variance' is a restatement of the fit's residual size rather than an independent prediction, and no independent sample or cross-validation is provided. The physical interpretation compounds the problem: the main axis is essentially decreasing Hβ FWHM, and the Shen catalog's black hole masses are virial estimates built from the same Hβ FWHM, so the reported 'anti-correlation with black hole mass' is partly guaranteed by construction. Additionally, the claimed linear independence of the two new parameters is obtained only after deleting two groups of five quasars identified visually as outliers after the Spearman correlation test; the paper itself is uncertain about the artifact explanation. The PCA work provides independent grounding, but the paper's central and novel claims—the new plane, its variance explanation, and its mass interpretation—reduce to the fitted curve and the post-hoc sample selection, making the overall analysis partially circular.
Assumptions & free parameters
free parameters (2)
- a in decay curve y = 1/(a + x^b) =
not reported
- b in decay curve y = 1/(a + x^b) =
not reported
assumptions (4)
- ad hoc to paper The quasar main sequence can be represented by the two-parameter decay curve y = 1/(a + x^b).
- ad hoc to paper The ten excluded outliers are spurious measurements rather than genuine extreme quasars.
- domain assumption PCA on the chosen line and luminosity parameters recovers the intrinsic physical drivers of quasar diversity.
- standard math Principal components are orthogonal and ordered by variance on standardized data.
Cite this review
Pith. "Pith review of Quasar Main Sequence: a line or a plane?." pith.science (2026). https://pith.science/paper/FAZ5BPBH
@misc{pith2026190804990,
  author       = {Pith},
  title        = {Pith review of: Quasar Main Sequence: a line or a plane?},
  year         = {2026},
  howpublished = {\url{https://pith.science/paper/FAZ5BPBH}},
  note         = {Machine review of arXiv:1908.04990}
}
abstract
A quasar main sequence is widely believed to reveal itself through objects represented in a plane spanned by two parameters: the full-width at half-maximum (FWHM) of H$\beta{}$, and the ratio of Fe II to H$\beta{}$ equivalent width. This sequence is related to the application to quasar properties of principal component analysis (PCA), which reveals that the main axis of variance (Eigenvector 1) is co-directional with a strong anti-correlation between these two measurements. We aim to determine whether the dominance of two Eigenvectors, originally discovered over two decades ago, is replicated in newer high-quality quasar samples. If so, we aim to test if a non-linear approach is an improvement on the linear PCA method by finding two new parameters which represent a more accurate projection of the variances than the Eigenvectors recovered from PCA. We selected quasars from the XSHOOTER archive and a major quasar catalog to build high quality samples. These samples were tested with PCA. We find that the new high-quality samples do indeed have two dominant Eigenvectors as originally discovered. Subsequently we find that the fitting of a non-linear decay curve to the main sequence allows a new plane spanned by linearly independent axes to be defined, based on the distance along the decay curve as the main axis and the distance of each quasar datapoint from the curve as the secondary axis respectively. The results show that it is possible to define a new plane based on the quasar main sequence which accounts for the majority of the variance. The most likely candidate for the new main axis is an anti-correlation with black hole mass. In this case the secondary axis likely represents luminosity. However, given the results of previous studies, inclination angle likely plays a role in H$\beta{}$ width.
Figures


Figures from the paper (3 more)

Reference graph
Works this paper leans on
- [1]
-
[2]
A., Czerny, B., Lasota, J
Abramowicz, M. A., Czerny, B., Lasota, J. P., & Szuszkiewicz, E. 1988, ApJ, 332, 646
1988
-
[3]
2017, MNRAS, 464, 385
Bisogni, S., Marconi, A., & Risaliti, G. 2017, MNRAS, 464, 385
2017
-
[4]
Blandford, R. D. & McKee, C. F. 1982, ApJ, 255, 419
1982
-
[5]
Boroson, T. A. & Green, R. F. 1992, ApJS, 80, 109
work page 1992
-
[6]
M., Netzer, H., Lira, P., Trakhtenbrot, B., & Mej ´ıa-Restrepo, J
Capellupo, D. M., Netzer, H., Lira, P., Trakhtenbrot, B., & Mej ´ıa-Restrepo, J. 2015, MNRAS, 446, 3427 6
work page 2015
-
[7]
M., Netzer, H., Lira, P., Trakhtenbrot, B., & Mej ´ıa-Restrepo, J
Capellupo, D. M., Netzer, H., Lira, P., Trakhtenbrot, B., & Mej ´ıa-Restrepo, J. 2016, MNRAS, 460, 212
work page 2016
-
[8]
Collin, S., Kawaguchi, T., Peterson, B. M., & Vestergaard, M. 2006, A&A, 456, 75 de Nicola, S., Marconi, A., & Longo, G. 2019, MNRAS, 2130
work page 2006
Show all 32 references
-
[9]
2019, ApJ, 882, 138
Decarli, R., Walter, F., G´onzalez-L´opez, J., et al. 2019, ApJ, 882, 138
2019
-
[10]
2017, Frontiers in Astronomy and Space Sciences, 4, 1
Fraix-Burnet, D., Marziani, P., D’Onofrio, M., & Dultzin, D. 2017, Frontiers in Astronomy and Space Sciences, 4, 1
2017
-
[11]
J., & Jones, A
Garofalo, D., Christian, D. J., & Jones, A. M. 2019, Universe, 5, 145
2019
-
[12]
2005, ApJ, 629, 61
Kaspi, S., Maoz, D., Netzer, H., et al. 2005, ApJ, 629, 61
2005
-
[13]
J., Schmidt, G., et al
Kuraszkiewicz, J., Wilkes, B. J., Schmidt, G., et al. 2009, ApJ, 692, 1180
2009
-
[14]
1998, AJ, 115, 2285
Magorrian, J., Tremaine, S., Richstone, D., et al. 1998, AJ, 115, 2285
1998
-
[15]
2018, Frontiers in Astronomy and Space Sciences, 5, 28
Marziani, P., Del Olmo, A., D’Onofrio, M., & Dultzin, D. 2018, Frontiers in Astronomy and Space Sciences, 5, 28
2018
-
[16]
& Sulentic, J
Marziani, P. & Sulentic, J. W. 2012, New Astronomy Reviews, 56, 49
2012
-
[17]
W., Zwitter, T., Dultzin-Hacyan, D., & Calvani, M
Marziani, P., Sulentic, J. W., Zwitter, T., Dultzin-Hacyan, D., & Calvani, M. 2001, ApJ, 558, 553
2001
-
[18]
2003, Monthly Notices of the Royal Astronomical Society, 342, 422 Mej´ıa-Restrepo, J
Matt, G., Maiolino, R., & Guainazzi, M. 2003, Monthly Notices of the Royal Astronomical Society, 342, 422 Mej´ıa-Restrepo, J. E., Trakhtenbrot, B., Lira, P., Netzer, H., & Capellupo, D. M. 2016, MNRAS, 460, 187
2003
-
[19]
P., et al
Panda, S., Czerny, B., Adhikari, T. P., et al. 2018, ApJ, 866, 115
2018
-
[20]
Peeples, M. S. & Shankar, F. 2011, MNRAS, 417, 2962
2011
-
[21]
Peterson, B. M. 1997, An Introduction to Active Galactic Nuclei
1997
-
[22]
S., & Peeples, M
Popping, G., Behroozi, P. S., & Peeples, M. S. 2015, MNRAS, 449, 477
2015
-
[23]
2011, MNRAS, 411, 2223
Risaliti, G., Salvati, M., & Marconi, A. 2011, MNRAS, 411, 2223
2011
-
[24]
Shakura, N. I. & Sunyaev, R. A. 1973, A&A, 24, 337
1973
-
[25]
I., Popovi´c, L
Shapovalova, A. I., Popovi´c, L. ˇC., Burenkov, A. N., et al. 2010, Astronomy and Astrophysics, 509, A106
2010
-
[26]
Shen, Y . & Ho, L. C. 2014, Nature, 513, 210
2014
-
[27]
T., Strauss, M
Shen, Y ., Richards, G. T., Strauss, M. A., et al. 2011, ApJS, 194, 45 ´Sniegowska, M., Czerny, B., You, B., et al. 2018, A&A, 613, A38
2011
-
[28]
Steinhardt, C. L. & Elvis, M. 2010, MNRAS, 402, 2637
2010
-
[29]
W., Bachev, R., Marziani, P., Negrete, C
Sulentic, J. W., Bachev, R., Marziani, P., Negrete, C. A., & Dultzin, D. 2007, ApJ, 666, 757
2007
-
[30]
W., Zwitter, T., Marziani, P., & Dultzin-Hacyan, D
Sulentic, J. W., Zwitter, T., Marziani, P., & Dultzin-Hacyan, D. 2000, ApJ, 536, L5
2000
-
[31]
Wills, B. J. & Brotherton, M. S. 1995, ApJ, 448, L81
1995
-
[32]
J., et al
Woo, J.-H., Treu, T., Barth, A. J., et al. 2010, ApJ, 716, 269 Zamfir, S., Sulentic, J. W., & Marziani, P. 2008, MNRAS, 387, 856 7
2010
Reviewed August 14, 2026 · model on record in the stance chip above.
Discussion (0). Continue with ORCID to comment.