REVIEW 3 major objections 5 minor 24 references
Is being `Robust' beneficial?: A perspective from the Indian market
T0 review · 3 major / 5 minor · reviewed 2026-08-14 · deepseek-v4-flash
Pith's one-line read Worst-case risk models can beat standard VaR and CVaR, but only in specific settings: more stocks, or simulated data.
desk verdict Applies known robust VaR/CVaR methods to Indian data, but the 'robustness helps' claim is built on in-sample Sortino comparisons and a post hoc choice of l, so the paper needs major empirical revision before the finding can be trusted. read the letter →
The pith
A machine-rendered reading of the paper's core claim, the machinery that carries it, and where it could break.
The reading
What carries the argument
The argument runs on two robust formulations. For VaR, the worst-case version replaces estimated moments with conservative bounds: a lower bound on expected return and an upper bound on covariance, obtained from a nonparametric bootstrap, and uses the distribution-free quantile factor $\kappa(\epsilon)=\sqrt{(1-\epsilon)/\epsilon}$; the resulting problem is a second-order cone program. For CVaR, the worst-case version assumes the return density lies in the set of all mixtures of $l$ likelihood distributions and solves a linear program with one constraint block per mixture component. Both are compared through the Sortino ratio, excess return over a 6% annual risk-free rate divided by downside semi-deviation.
What would settle it
Re-run the same comparison out of sample: split the BSE 30 and BSE 100 daily return series into an estimation window (compute means, covariances, bootstrap bounds, and mixture components) and a holdout window; construct optimal portfolios from the estimation window and compare Sortino ratios on the holdout. If WVaR and WCVaR do not beat their base versions on held-out returns, the central claim fails. A simulation version would generate returns from a known distribution, estimate inputs on one sample, and test the constructed portfolios on an independent sample.
Extended reading notes
Core claim
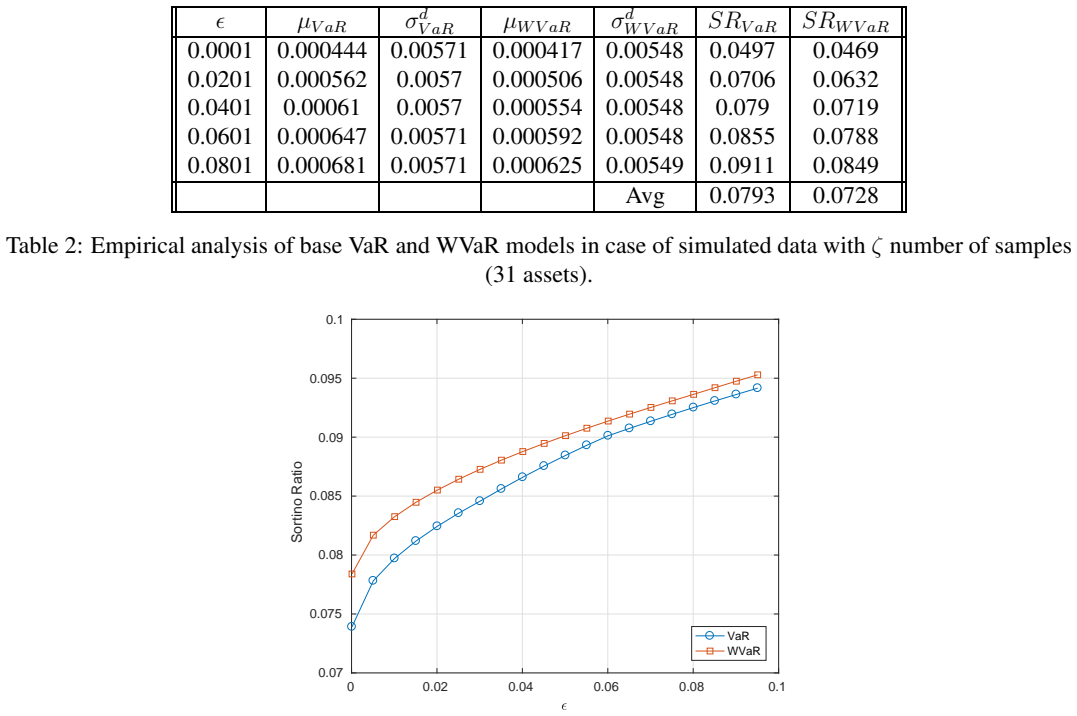
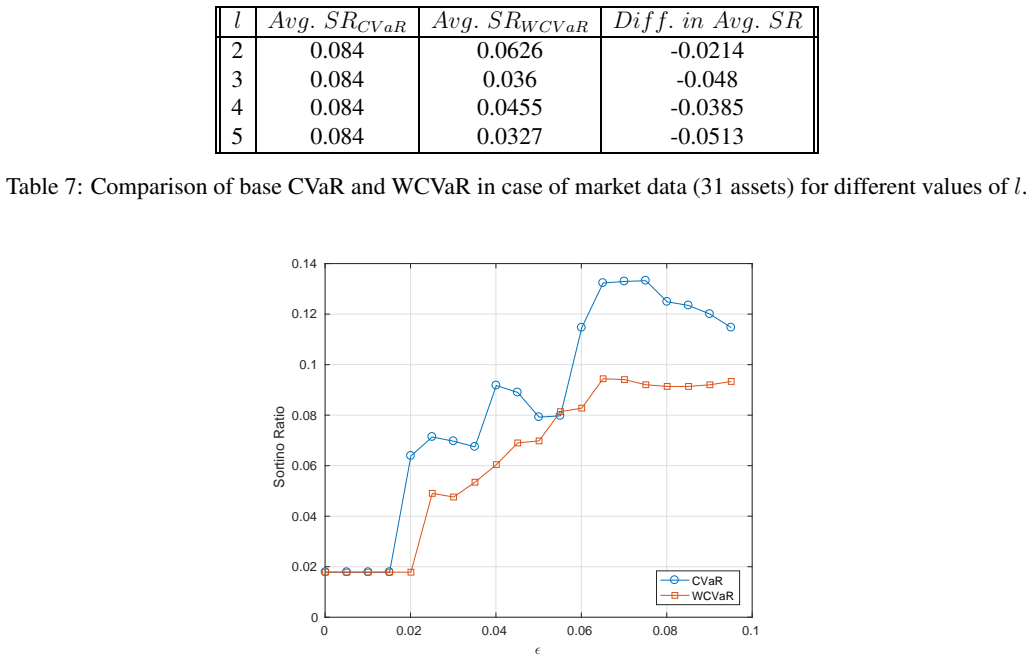
The paper's central claim is that the practical benefit of robustness is context-dependent but real in specific cases. Worst-case VaR, built with moment bounds from a nonparametric bootstrap, dominates base VaR for N=98 stocks in every data environment tested: average Sortino 0.117 versus 0.105 on market data, 0.0932 versus 0.0538 with bootstrapped samples matching market size, and 0.140 versus 0.109 with 1000 simulated samples. For N=31, WVaR only wins when 1000 samples are simulated. Worst-case CVaR, using mixture-distribution uncertainty with l components, beats base CVaR in simulated data—average Sortino up to 0.142 versus 0.133 for N=98 with 1000 samples—but loses to base CVaR on real market data. The paper also reports that base CVaR beats WCVaR on market data regardless of N, which it attributes to market returns not following the mixture-of-likelihoods assumption.
Load-bearing premise
The comparisons evaluate each portfolio on the same historical or simulated data used to estimate its inputs, so the reported Sortino gains are in-sample; if the robust models lose that advantage when tested on unseen data, the paper's claim that robustness is beneficial would not hold.
Editorial extensions
If this is right
- With around 100 stocks, choosing WVaR over VaR raises the Sortino ratio in every data setting the paper examines, so robust VaR is a defensible default for larger Indian equity portfolios.
- Larger simulated samples make WVaR win even at 31 stocks, suggesting that the precision of bootstrap moment bounds, not just portfolio size, drives the benefit.
- For CVaR, WCVaR's advantage appears only in simulated data; using WCVaR on real Indian market data would, by these results, lower Sortino performance.
- The mixture component count l must be tuned: the best l changes across scenarios, and the paper selects l by the largest average-Sortino gap, so practical use requires scenario-specific choice.
Reading between the lines
- Because the evaluation is in-sample, the reported gains are an upper bound on the practical benefit; the natural next test is a rolling-window out-of-sample comparison, which the paper does not report.
- The pattern that robust VaR helps most when N is large fits the idea that estimation error grows with the number of parameters; artificially perturbing the estimated covariance matrix and checking whether WVaR's edge widens would test that mechanism directly.
- WCVaR's poor showing on market data may reflect the specific mixture-distribution uncertainty set rather than a general failure of robust CVaR; box or ellipsoidal uncertainty sets could behave differently on the same data.
- A practical investor might also ask whether the Sortino gains survive transaction costs and turnover, since robust portfolios with different weights could trade more; this is not addressed in the paper.
Signed reviews
Editorial analysis
A structured set of objections, weighed in public.
Referee Report
Summary. The paper studies whether worst-case robust counterparts of VaR and CVaR portfolio optimization are beneficial compared with their base versions. Using S&P BSE 30 (N=31) and S&P BSE 100 (N=98) daily log-returns, as well as bootstrap-simulated data, the authors construct minimum-risk portfolios and compare average Sortino ratios across a grid of the confidence-level parameter epsilon. The formulations are standard: WVaR uses covariance upper bounds and mean lower bounds from a nonparametric bootstrap, and WCVaR uses a mixture-distribution uncertainty set. The paper reports that WVaR outperforms VaR for N=98 in all data environments and for N=31 with 1000 simulated samples, while WCVaR outperforms CVaR mainly in simulated data. The discussion attributes these patterns to estimation-error accumulation and distributional assumptions.
Significance. If the empirical claims were established, the paper would provide useful evidence on the practical value of robust downside-risk optimization in an emerging-market setting, a topic that is less studied than mean-variance robustness. The paper also gives a clear and correct presentation of the relevant conic and linear programming formulations. The tabulated results are transparent and the comparison to prior work by Zhu and Fukushima is informative. However, the central empirical claim is not yet supported because the evidence is based entirely on in-sample performance comparisons without uncertainty quantification, and the WCVaR comparison selects the mixture size l after observing the evaluation results.
major comments (3)
- [Section 3.1 and Tables 19-20] The Sortino ratios are computed on the same historical or simulated sample that is used to estimate the model inputs (means, covariance bounds, bootstrap resamples, and WCVaR mixture components). No split into estimation and evaluation periods is performed, and no out-of-sample test is reported. Since the paper's stated goal is to assess whether robustness is 'beneficial' for a practitioner, the central claim that WVaR and WCVaR 'exhibit superior performance' requires an out-of-sample evaluation, or at a minimum a validation scheme such as rolling windows or cross-validation. As written, the reported differences may simply reflect in-sample fitting.
- [Section 3.2.1 and Section 3.2.2, Tables 7-18] The number of mixture components l for WCVaR is selected after viewing the results, choosing the l that gives the maximum difference in average Sortino ratio between WCVaR and CVaR. This is a post hoc selection on the evaluation metric. For example, in Table 15 (simulated data, ζ samples, N=98), l=5 yields a negative difference of -0.00543 while l=4 gives a positive difference of +0.00497; the paper reports only the favorable l=4. Similarly, in Table 17, l=5 is reported because it gives the largest favorable gap. This selection inflates the apparent advantage of WCVaR and undermines the claim that WCVaR is superior in simulated settings. The paper should treat l as a tuning parameter and report results for all values, or use a proper model-selection procedure that does not peek at the Sortino outcomes.
- [Tables 19 and 20] The reported advantages are small in magnitude and are presented without standard errors, confidence intervals, or significance tests. For instance, the market-data WVaR advantage for N=98 is an average Sortino of 0.117 versus 0.105 (Table 19), and the simulated-data WCVaR advantage for 1000 samples and N=98 is 0.142 versus 0.133 (Table 20). Given that these are averages over a grid of epsilon values with only 194 or so daily observations, such differences could easily arise from sampling noise. The paper should report bootstrap or other distributional measures to show that the improvements are not within the range of noise.
minor comments (5)
- [Equation (2.9)] The minimization in equation (2.9) is written as 'min over γ ∈ R^N', but the auxiliary variable γ should be a scalar, not an N-dimensional vector; this appears to be a typographical error.
- [Equation (2.16)] The definition of WCVaR in equation (2.16) writes 'min α∈R' but the expression inside the max uses γ; the minimization variable should be γ for consistency with the preceding and following LPP formulations.
- [Section 3.1] The description of the nonparametric bootstrap procedure used to obtain the mean and covariance bounds is too brief to be reproducible: the number of bootstrap resamples, the block structure (if any), and the exact construction of the 95% bounds are not specified.
- [Section 3.1] The risk-free rate is assumed to be 6% based on a statement about Indian Treasury Bill yields from 2016 to 2018, but no sensitivity analysis is provided for this assumption; since Sortino ratio is directly affected by the excess-return definition, this choice deserves at least a short robustness check.
- [Throughout] There are minor typographical issues, such as 'Rockafeller' instead of 'Rockafellar' in the citation of the CVaR transformation, and inconsistent use of 'epsilon' and 'ǫ' in the text.
Circularity Check
WCVaR headline advantage is selected by choosing l to maximize the Sortino gap; WVaR branch is independent.
-
fitted input called prediction
[Section 3.2.1, methodology paragraph before Figure 7; applied in Section 3.2.2, Tables 17 and 20.]
"In order to capture the maximum potential of WCVaR, for this case as well as other cases, we choose the value of l with maximum difference in the average Sortino Ratio between the WCVaR and CVaR model."
The WCVaR mixture parameter l is selected by maximizing the exact quantity that the paper then reports as evidence of WCVaR superiority. For the simulated 1000-sample, N=98 case, Table 17 shows l=5 selected because it gives the largest difference (0.00937), and Tables 18 and 20 then report WCVaR 0.142 vs CVaR 0.133 as the headline result. The claim that the robust WCVaR model exhibits superior performance in the simulated setup is therefore a restatement of the l-selection rule rather than an independent empirical prediction: the reported advantage is the maximum of the searched grid, not a held-out outcome. This selection does not affect the WVaR comparisons, which involve no such tuning parameter, but it does undermine the WCVaR-specific 'simulated setup' conclusion in the abstract.
full rationale
The WVaR branch is self-contained: the formulations are taken from external prior work (Ghaoui et al. and Zhu/Fukushima), the performance metric is an external Sortino benchmark, and there is no self-citation chain or uniqueness theorem imported from the authors. The WVaR results, including the N=98 market-data advantage (0.117 vs 0.105), do not reduce to any fitted parameter and are not circular. The same-data evaluation is a limitation for external validity, but it is applied symmetrically to base and robust models and therefore does not by itself make either model's output equal to its input. The only load-bearing self-referential element is the WCVaR l-selection, where the parameter is chosen to maximize the Sortino Ratio difference and that same difference is then presented as evidence of the robust model's benefit. This is a fitted input called prediction for the WCVaR-specific conclusion, but it leaves the WVaR central claim intact, so the overall circularity score is moderate rather than severe.
Assumptions & free parameters
free parameters (5)
- WCVaR mixture component count l =
l=2 (market N=31), l=5 (simulated zeta N=31), l=2 (simulated 1000 N=31), l=3 (market N=98), l=4 (simulated zeta N=98)…
- Equal split of samples among likelihood distributions =
Sj = S/l for each j
- Confidence level epsilon grid =
epsilon in (0,0.1), tabulated at 0.0001, 0.0201, 0.0401, 0.0601, 0.0801
- Bootstrap confidence level for robust bounds =
95%
- Risk-free rate for Sortino excess return =
6% annual
assumptions (4)
- standard math The Chebyshev-based factor kappa(epsilon) = sqrt((1 - epsilon)/epsilon) in equation (2.3) gives a valid upper bound for VaR when only mean and covariance are known.
- domain assumption The worst-case distribution family for WVaR is representable by a separate lower bound on expected return and an upper bound on covariance obtained from bootstrap.
- ad hoc to paper For WCVaR, the true return distribution lies in P_M, the set of mixtures of l likelihood distributions in equation (2.15), and the l likelihoods can be formed by equal subsamples of the data.
- domain assumption The in-sample Sortino ratio is a meaningful measure of the practical benefit of robust optimization.
Cite this review
Pith. "Pith review of Is being `Robust' beneficial?: A perspective from the Indian market." pith.science (2026). https://pith.science/paper/RZXXCSIJ
@misc{pith2026190805002,
  author       = {Pith},
  title        = {Pith review of: Is being `Robust' beneficial?: A perspective from the Indian market},
  year         = {2026},
  howpublished = {\url{https://pith.science/paper/RZXXCSIJ}},
  note         = {Machine review of arXiv:1908.05002}
}
read the original abstract
The problem of data uncertainty has motivated the incorporation of robust optimization in various arenas, beyond the Markowitz portfolio optimization. This work presents the extension of the robust optimization framework for the minimization of downside risk measures, such as Value-at-Risk (VaR) and Conditional Value-at-Risk (CVaR). We perform an empirical study of VaR and CVaR frameworks, with respect to their robust counterparts, namely, Worst-Case VaR and Worst-Case CVaR, using the market data as well as the simulated data. After discussing the practical usefulness of the robust optimization approaches from various standpoints, we infer various takeaways. The robust models in the case of VaR and CVaR minimization exhibit superior performance with respect to their base versions in the cases involving higher number of stocks and simulated setup respectively.
Figures


Figures from the paper (9 more)




Reference graph
Works this paper leans on
-
[1]
Reserve bank of india - weekly statistical supplement. https://www.rbi.org.in/
- [2]
-
[3]
C. Acerbi and D. Tasche. On the coherence of expected shor tfall. Journal of Banking & Finance , 26(7):1487–1503, 2002
work page 2002
-
[4]
P . Artzner, F. Delbaen, J. Eber, and D. Heath. Coherent me asures of risk. Mathematical Finance, 9(3):203– 228, 1999
work page 1999
-
[5]
D. Bertsimas and I. Popescu. Optimal inequalities in pro bability theory: A convex optimization approach. SIAM Journal on Optimization , 15(3):780–804, 2005
work page 2005
-
[6]
F. Black and R. Litterman. Global portfolio optimizatio n. Financial Analysts Journal, 48(5):28–43, 1992
work page 1992
-
[7]
M. Broadie. Computing efficient frontiers using estimat ed parameters. Annals of Operations Research , 45(1):21–58, Dec 1993
work page 1993
-
[8]
M. J. Capi´ nski and E. Kopp. Portfolio theory and risk management, volume 5. Cambridge University Press, 2014
work page 2014
Show all 24 references
-
[9]
V . K. Chopra and W. T. Ziemba. The effect of errors in means , variances, and covariances on optimal portfolio choice. The Journal of Portfolio Management, 19(2):6–11, 1993
1993
-
[10]
F. J. Fabozzi, P . N. Kolm, D. Pachamanova, and S. M. Focar di. Robust Portfolio Optimization and Manage- ment. Wiley, 2007
2007
-
[11]
L. E. Ghaoui, M. Oks, and F. Oustry. Worst-case value-at -risk and robust portfolio optimization: A conic programming approach. Operations Research, 51(4):543–556, 2003. 11
2003
-
[12]
Ju and N
X. Ju and N. D. Pearson. Using value-at-risk to control r isk taking: how wrong can you be? OFOR Working Paper Series, no. 98-08, 1998
1998
-
[13]
J. H. Kim, W. C. Kim, and F. J. Fabozzi. Recent developmen ts in robust portfolios with a worst-case approach. Journal of Optimization Theory and Applications , 161(1):103–121, 2014
2014
-
[14]
C. Lim, H. D. Sherali, and S. Uryasev. Portfolio optimiz ation by minimizing conditional value-at-risk via nondifferentiable optimization. Computational Optimization and Applications , 46(3):391–415, 2010
2010
-
[15]
T. J. Linsmeier and N. D. Pearson. Risk measurement: An i ntroduction to value at risk. Technical report, 1996
1996
-
[16]
Z. Lu. A new cone programming approach for robust portfo lio selection. Optimization Methods and Soft- ware, 26(1):89–104, 2006
2006
-
[17]
H. M. Markowitz. Portfolio selection. The Journal of Finance, 7(1):77–91, 1952
1952
-
[18]
H. M. Markowitz. Portfolio Selection: Efficient Diversification of Investme nts. Y ale University Press, 1959
1959
-
[19]
R. O. Michaud. The markowitz optimization enigma: Is ’o ptimized’ optimal? Financial Analysts Journal, 45(1):31–42, 1989
1989
-
[20]
G. Pflug. Some remarks on the value-at-risk and the condi tional value-at-risk, probabilistic constrained optimization: Methodology and applications. Kluwer Academic Publishers , 38:272–281, 2000
2000
-
[21]
R. T. Rockafellar and S. Uryasev. Optimization of condi tional value-at-risk. Journal of Risk, 2:21–42, 2000
2000
-
[22]
R. T. Rockafellar and S. Uryasev. Conditional value-at -risk for general loss distributions. Journal of Banking & Finance, 26(7):1443–1471, 2002
2002
-
[23]
R. H. T¨ ut¨ unc¨ u and M. Koenig. Robust asset allocation. Annals of Operations Research , 132(1-4):157–187, 2004
2004
-
[24]
Zhu and M
S. Zhu and M. Fukushima. Worst-case conditional value- at-risk with application to robust portfolio man- agement. Operations Research, 57(5):1155–1168, 2009. 12 0 0.02 0.04 0.06 0.08 0.1 0.075 0.08 0.085 0.09 0.095 0.1 0.105 0.11 Sortino Ratio VaR WVaR Figure 1: Sortino ratio ...
2009
Reviewed August 14, 2026 · model on record in the stance chip above.
Discussion (0). Continue with ORCID to comment.