REVIEW 4 major objections 5 minor 16 references
Search for neutrino emission in IceCube archival data from the direction of IceCube alert events
T0 review · 4 major / 5 minor · reviewed 2026-08-14 · deepseek-v4-flash
Pith's one-line read Ten and a half years of IceCube archival data show no steady neutrino excess from the directions of the detector's own high-energy alert events.
desk verdict The null result is plausible but the two headline p-values are not clearly defined; as written, the individual p-value of 0.83 cannot be a simple minimum of 81 uniform p-values, and the paper should clarify the p-value calibration and whether alert events are in the archival sample. read the letter →
The pith
A machine-rendered reading of the paper's core claim, the machinery that carries it, and where it could break.
The reading
What carries the argument
The engine is an unbinned likelihood-ratio test statistic, $$TS = -2\log\left[\frac{L(n_s=0)}{L(n_s=\hat{n}_s)}\right] = 2\sum_i \log\left[\frac{\hat{n}_s}{N_{\mathrm{obs}}}\left(\frac{S_i}{B_i}-1\right)+1\right],$$ with per-event signal and background densities split into spatial and energy factors. The signal spatial density is a two-dimensional Gaussian around the candidate position scaled by the event's reconstruction uncertainty; background is uniform in right ascension and a measured function of declination, with energy terms taken from Monte Carlo. Because the alert positions themselves are uncertain, the search re-fits the source position on a $0.1^\circ$ grid inside the 90% error contour and converts the best-fitting $TS$ under the background hypothesis into a p-value.
What would settle it
Check the archival data set for the 81 alert events and rerun both the individual and stacking searches with those events excluded; if any p-value changes materially, the background-compatible conclusion depends on self-triggering rather than an independent steady excess.
Extended reading notes
Core claim
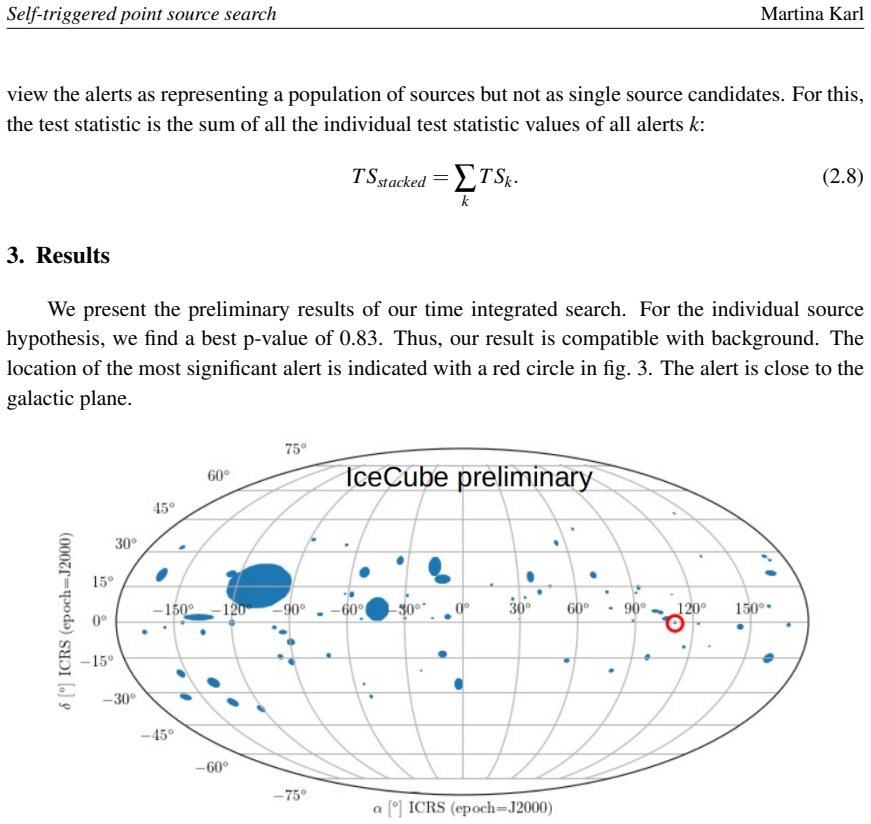
On its own terms, the paper claims that 10.5 years of through-going muon data contain no significant continuous neutrino emission from the reconstructed directions of 81 IceCube alert events. Using an unbinned likelihood ratio, the search scans each alert's 90% uncertainty region on a 0.1-degree grid, fits the expected number of signal events and the spectral index at every grid point, and ranks the alerts individually and as a stacked population. The best individual alert yields a p-value of 0.83 and the stacked population yields 0.856, so the paper concludes the observations are compatible with the background-only hypothesis. It also notes that the most significant alert lies close to the galactic plane, with a blazar, PKS 0723-008, about 0.33 arc minutes from the fitted source position.
Load-bearing premise
The reported p-values assume that, under the null hypothesis, the archival events in each alert direction are pure background, but the paper does not say whether the alert event that selected that direction is kept out of the archival sample.
Editorial extensions
If this is right
- If the result stands, IceCube's alert directions do not, as a group, coincide with steady neutrino-emitting sources in the archival sky.
- A population of sources emitting steadily at the level needed to produce the alerts would be incompatible with the reported p-values.
- The non-detection makes transient or flaring emission the more plausible way for alert-producing sources to hide from time-integrated searches, which is exactly what the announced follow-up will test.
- Automating the pipeline would let every future high-energy track alert be checked immediately against 10.5 years of archival data for a continuous source.
Reading between the lines
- The paper does not state whether the triggering alert event itself remains in the archival sample used to test its own direction; if it does, the null hypothesis is not pure background and the p-values would need to be recomputed with that event removed.
- A natural extension is to stack the same archival data on other candidate source lists, such as gamma-ray-loud blazars, to see whether the null result reflects IceCube's alert selection or a broader property of candidate neutrino source directions.
- The reported p-values are far enough from rejection that even a trial factor of about two for combining with the all-sky point-source search would leave the background-only conclusion unchanged.
Signed reviews
Editorial analysis
A structured set of objections, weighed in public.
Referee Report
Summary. The paper (ICRC2019 proceedings) searches for time-integrated neutrino emission from the directions of 81 IceCube high-energy track-like alert events, using 10.5 years of archival through-going muon data. The analysis uses an unbinned likelihood ratio with spatial and energy terms, performs a 0.1-degree grid scan within the 90% error contour of each alert, and reports a best individual p-value of 0.83 and a stacking p-value of 0.856, concluding that the data are compatible with background. The paper also indicates that a transient search is planned.
Significance. If the analysis were fully specified and correctly calibrated, a null result from archival IceCube data toward the directions of IceCube's own alerts would be a useful consistency check for the alert program and for the possible existence of steady sources in those directions. The paper is clearly written and uses a standard likelihood formalism; the stacking test statistic is explicitly defined in Eq. (2.8). However, as presented, the central null conclusion rests on p-value definitions and a background model that are not sufficiently described to be verified.
major comments (4)
- [Sections 2.2 and 3] The meaning of the reported 'best p-value of 0.83' is ambiguous. If 0.83 is the minimum of the 81 individual p-values, then the value is not trials-corrected; for 81 independent uniform p-values the expected minimum is about 0.012, and the probability that the minimum exceeds 0.83 is vanishingly small under the stated null. If 0.83 is instead a post-trial p-value for the most significant alert, the number of trials and the local p-value are not reported. The manuscript must state which quantity is being quoted and describe the trial-correction procedure explicitly.
- [Section 2.1, Eq. (2.7)] The null hypothesis is defined as background only (ns=0) for each alert direction, but the alert directions are selected from IceCube's own events, and the manuscript never states whether the triggering alert events are included in the 10.5-year archival sample used in the search. If an alert event is present in the data used to test its own direction, the null hypothesis is not pure background and the reported p-values do not measure an independent steady source excess. If the alert events are removed, that exclusion should be stated; if they are not removed, the analysis should account for the self-triggered contribution to the null model.
- [Section 2.2, position scan] The p-value calibration for the position-grid scan is not described. The text states that 'based on the expected distribution of the best-fit test statistic we determine a p-value for each of the 81 alerts,' but it does not specify how the scan over 0.1-degree grid points (which may number many per alert) enters the null distribution. Without knowing whether and how the number of scanned positions is incorporated into the background-only test-statistic distribution, the reported p-values cannot be reproduced or checked.
- [Section 3, Results] The paper reports only p-values and does not give the best-fit number of signal events, spectral index, or upper limits for the most significant alert or for the stacking result. These quantities are needed to assess the sensitivity of the search and the physical meaning of the null result, especially because the analysis is presented as a search rather than a limit-setting procedure.
minor comments (5)
- [Abstract] The abstract states that the search 'will be automated for all future high energy track-like neutrino alerts,' while the body reports results for 81 historic alerts; please clarify whether the current analysis already includes all alerts up to the stated data cutoff or only a subset, and where the automation is described.
- [Section 2.2] The event labeled 'IceCube-172209A' in the second paragraph appears to be a typo for 'IceCube-170922A' given the accompanying reference to TXS 0506+056; please correct the identifier.
- [Section 2.3] The sentence 'Therefore a trial factor of close to two would apply if those results were combined' is cryptic: it is unclear which results are being combined and why the factor is 'close to two.' Please expand this remark or remove it.
- [Figure 2] The two panels of Figure 2 lack visible axes labels and a color scale for the test-statistic values; adding these would make the illustration of the position scan easier to interpret.
- [Section 3] The most significant alert is described only as 'close to the galactic plane,' with no identifier or coordinates; provide the alert name and its fitted right ascension and declination so that the result is reproducible.
Circularity Check
No circular derivation found: the archival steady-emission search and its p-values are not equivalent by construction to the alert inputs; the notable ambiguities are statistical reporting issues, not circularity.
full rationale
The paper's central quantity is an unbinned likelihood-ratio test statistic (Eq. 2.7) that compares a background-only hypothesis (ns = 0) with a fitted signal hypothesis at positions supplied by IceCube alerts. The alert directions are inputs, but the analysis does not define its conclusion in terms of those inputs: it searches for additional events in a 10.5-year through-going muon sample and reports compatibility with background. No fitted parameter is renamed as a prediction, no uniqueness claim is imported from the authors' prior work, and no ansatz is smuggled in via self-citation. The cited Monte Carlo energy PDFs are standard detector-response ingredients, not a self-citation chain that forces the null result. The only substantive concern is statistical, not circular: Section 2.1 and Eq. 2.7 do not state whether the triggering alert events are removed from the archival sample, and Sections 2.3 and 3 do not define the trial procedure behind the reported 'best p-value of 0.83'. If the alert events are included, the null hypothesis is not strictly pure background at those positions; if 0.83 is the minimum of 81 local p-values, it is not trials-corrected. These are calibration and reporting questions, not cases where the result is equivalent to the input by construction. The self-triggered nature of the search is explicitly acknowledged in the running head, and testing known alert directions for additional steady emission is a legitimate conditional analysis rather than a circular derivation. No circular step can be exhibited from the text.
Assumptions & free parameters
free parameters (3)
- signal event count n_s =
not reported
- source spectral index gamma =
not reported
- source position on the scan grid =
not reported
assumptions (4)
- domain assumption The archival through-going muon sample and Monte Carlo correctly model the signal and background probability densities.
- domain assumption The null hypothesis is pure background for every alert direction.
- standard math The likelihood-ratio test statistic follows the assumed background distribution used to assign p-values.
- domain assumption Alert uncertainty regions are valid search regions and sources inside them are point-like.
Cite this review
Pith. "Pith review of Search for neutrino emission in IceCube archival data from the direction of IceCube alert events." pith.science (2026). https://pith.science/paper/JSV3S5ET
@misc{pith2026190805162,
  author       = {Pith},
  title        = {Pith review of: Search for neutrino emission in IceCube archival data from the direction of IceCube alert events},
  year         = {2026},
  howpublished = {\url{https://pith.science/paper/JSV3S5ET}},
  note         = {Machine review of arXiv:1908.05162}
}
read the original abstract
IceCube is a cubic-kilometer scale neutrino detector instrumenting a gigaton of ice at the geographic South Pole in Antarctica. On average, 8 track-like high-energy neutrino events with a high probability of being astrophysical are detected and published as alerts per year. The bright appearance of these events in the detector allow a precise pointing to their origins. This work presents a search for cosmic neutrino sources. The analysis uses high statistics archival IceCube neutrino-induced through-going muon samples to search for these sources in the vicinity of the incoming directions of the track-like high energy neutrino alert-events. The analysis searches for both steady sources emitting neutrinos over the entire uptime of IceCube, and transient sources that only temporarily produce neutrinos. This search will be applied to all historic alerts and will be automated for all future high energy track-like neutrino alerts.
Figures


Figures from the paper (1 more)

Reference graph
Works this paper leans on
-
[1]
write newline
" write newline "" before.all 'output.state := FUNCTION blank.sep after.quote 'output.state := FUNCTION fin.entry output.state after.quoted.block = 'skip 'add.period if write newline FUNCTION new.block output.state before.all = 'skip output.state after.quote = after.quoted.block 'output.state := after.block 'output.state := if if FUNCTION new.sentence out...
-
[2]
Aartsen et al., Journal of Instrumentation 12 (2017) P03012--P03012
IceCube Collaboration, M. Aartsen et al., Journal of Instrumentation 12 (2017) P03012--P03012
work page 2017
-
[3]
Aartsen et al., Science 342 (2013)
IceCube Collaboration, M. Aartsen et al., Science 342 (2013)
work page 2013
-
[4]
IceCube Collaboration, M. G. Aartsen et al., Astropart. Phys. 92 (2017) 30--41
work page 2017
-
[5]
Thomas Kintscher for the IceCube Collaboration , Journal of Physics: Conference Series 718 (2016) 062029
work page 2016
-
[6]
IceCube, Fermi-LAT, MAGIC, AGILE, ASAS-SN, HAWC, H.E.S.S, INTEGRAL, Kanata, Kiso, Kapteyn, Liverpool telescope, Subaru, Swift/NuSTAR, VERITAS, and VLA/17b-403 Collaboration, M. G. Aartsen et al., Science 361 (2018) eaat1378
work page 2018
-
[7]
IceCube Collaboration, M. G. Aartsen et al., Science 361 (2018) 147--151
2018
-
[8]
IceCube Collaboration, M. G. Aartsen et al., Astrophys. J. 835 (2017) 151
2017
Show all 16 references
-
[9]
Braun, J
J. Braun, J. Dumm, F. De Palma, C. Finley, A. Karle, and T. Montaruli, Astropart. Phys. 29 (2008) 299--305
2008
-
[10]
Charlot , D
P. Charlot , D. A. Boboltz , A. L. Fey , E. B. Fomalont , B. J. Geldzahler , D. Gordon , C. S. Jacobs , G. E. Lanyi , C. Ma , and C. J. Naudet , Astronomical Journal 139 (2010) 1713--1770
2010
-
[11]
A. L. Fey , D. Gordon , C. S. Jacobs , C. Ma , R. A. Gaume , E. F. Arias , G. Bianco , D. A. Boboltz , S. B \"o ckmann , and S. Bolotin , Astronomical Journal 150 (2015) 58
2015
-
[12]
IceCube Collaboration, PoS(ICRC2015)1099 (2016)
2016
-
[13]
IceCube-Gen2 Collaboration, PoS(ICRC2017)1052 (2018)
2018
-
[14]
IceCube Collaboration, PoS(ICRC2019)xyz (these proceedings)
-
[15]
IceCube Collaboration, M. G. Aartsen et al. , JINST 12 (2017) P03012
2017
-
[16]
Waxman and J
E. Waxman and J. N. Bahcall, Phys. Rev. D59 (1999) 023002
1999
Reviewed August 14, 2026 · model on record in the stance chip above.
Discussion (0). Continue with ORCID to comment.