REVIEW 4 major objections 5 minor 1 cited by
Modelling Crypto Asset Price Dynamics, Optimal Crypto Portfolio, and Crypto Option Valuation
T0 review · 4 major / 5 minor · reviewed 2026-08-14 · deepseek-v4-flash
Pith's one-line read Minimum-risk portfolios of crypto assets can beat the S&P 500, the paper finds, and the same model prices European options on them.
desk verdict A competent but overclaimed application of standard econometric machinery to crypto portfolios; the headline outperformance result contradicts the paper's own tables. read the letter →
The pith
A machine-rendered reading of the paper's core claim, the machinery that carries it, and where it could break.
The reading
What carries the argument
Two pieces carry the argument. For portfolio construction, the central object is the multivariate ARMA(1,1)-GARCH(1,1) model with Gaussian innovations and a multivariate Student-t distribution with five degrees of freedom: it converts daily log returns of seven crypto assets into 10,000 one-step-ahead scenarios per rolling window, and those scenarios feed mean-variance and CVaR optimizations that select the minimum-risk weights. For option pricing, the carrying mechanism is the Esscher transform applied to an ARMA(1,1)-GARCH(1,1) model whose innovations are normal inverse Gaussian (NIG): at each time step a one-dimensional equation tilts the physical return distribution to the unique equivalent martingale measure, and Monte Carlo averaging of discounted payoffs gives European option prices. The NIG distribution, with tail, skew, scale, and location parameters, is what lets the risk-neutral prices reproduce the short-maturity smile.
What would settle it
Re-run the same rolling optimization on data after July 2019 (or between 2017 and 2018) and record the min-CVaR portfolio's cumulative return net of realistic crypto bid-ask spreads and rebalancing fees; if it no longer exceeds the S&P 500 on Sharpe or cumulative return, the paper's major finding is specific to the original window and frictionless assumption.
Extended reading notes
Core claim
The paper reports two findings. First, an equally weighted basket of the seven largest crypto assets is not the best use of the universe: over 04/04/2018 to 07/02/2019, the rolling minimum-CVaR portfolio beat the SPDR S&P 500 ETF in cumulative return during the second quarter of 2019 and recorded the best Sharpe, M2, and Rachev ratios of the three competitors, while the minimum-variance portfolio behaved similarly to SPY on those ratios; risk budgeting attributes the effect to bitcoin as the risk diversifier and EOS as the risk contributor. Second, the innovations of both minimum-risk portfolio returns fit a normal inverse Gaussian distribution inside an ARMA(1,1)-GARCH(1,1) model, and applying the Esscher transform yields unique equivalent martingale measure prices for European calls and puts on the portfolios; Monte Carlo simulation of 10,000 paths gives option smiles whose curvature increases as maturity shortens. Because no crypto index options trade, the authors cannot compare the prices with market quotes, but they claim their theoretical prices are what such options should follow once frictions and design details are adjusted for.
Load-bearing premise
The load-bearing premise is that the 04/04/2018 to 07/02/2019 backtest, run with zero transaction costs and with the model chosen on the same window used for evaluation, reflects how the portfolios would actually perform; if real crypto trading costs or the look-ahead in model selection are large enough, the reported edge over the S&P 500 could disappear.
Editorial extensions
If this is right
- If the reported outperformance is not an artifact of the sample, diversified minimum-risk crypto portfolios become a credible equity-beating asset class built only from crypto assets.
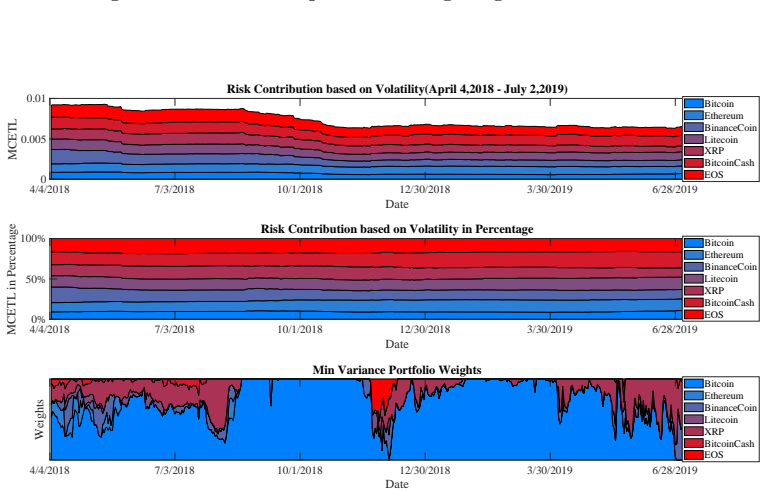
- The risk-budgeting ordering (bitcoin contributes least risk, EOS most) gives portfolio managers a concrete starting point for sizing crypto positions.
- If crypto index options are introduced, the NIG-Esscher model predicts their implied volatility smiles and provides a fair-value benchmark for calls and puts.
- The absence of a traded options market means the pricing claim can only be checked indirectly, for example by simulating the dynamic hedging strategy on the minimum-risk portfolios.
Reading between the lines
- A stronger test would freeze the model after the in-sample window and evaluate the same weights on later data, including the 2020-2021 crypto cycle; the paper's out-of-sample period is the same window used for model selection.
- Because the min-CVaR weights fluctuate sharply and crypto bid-ask spreads are wide, charging realistic transaction costs to the rebalancing rule could erase the reported edge over SPY.
- If a crypto index option ever lists, the model makes a falsifiable prediction: implied volatility surfaces should look like the NIG-GARCH smiles, not flat Black-Scholes surfaces.
- The risk-contribution ordering suggests a testable tilt strategy: reduce exposure to high contributors such as EOS and increase exposure to low contributors such as bitcoin, then compare the tilted basket with the optimized portfolios.
Signed reviews
Editorial analysis
A structured set of objections, weighed in public.
Referee Report
Summary. The paper models daily log returns of seven crypto assets (BTC, ETH, XRP, LTC, BCH, EOS, BNB) using ARMA(1,1)-GARCH(1,1) dynamics with alternative innovation distributions (Gaussian, Student-t) and multivariate dependence structures (t copula, multivariate t, multivariate variance-gamma). Based on VaR/CVaR backtesting over 04/04/2018-07/02/2019, the authors select ARMA(1,1)-GARCH(1,1) with Gaussian innovations and a multivariate t distribution with five degrees of freedom. They then construct rolling min-variance and min-CVaR portfolios of the seven crypto assets and compare their performance with the SPY over the same window, reporting Sharpe, M2, Rachev ratios, and maximum drawdown. Finally, they fit NIG innovations to the min-variance and min-CVaR portfolio returns and price European options via the Esscher transform, asserting that the resulting theoretical prices would be followed closely by future crypto index options.
Significance. If the empirical claims held, the paper would offer a practical framework for constructing minimum-risk crypto portfolios and a first approach to pricing options on crypto indices. The use of standard GARCH-type dynamics, risk budgeting, and the Esscher transform is competent and the code/data description is mostly reproducible. However, the central advertised finding is contradicted by the paper's own results: the min-variance portfolio underperforms SPY throughout the evaluation window on almost all reported metrics. In addition, the model is selected and evaluated on the same out-of-sample window, and the option pricing section contains no external validation. The paper therefore does not currently support its main conclusions.
major comments (4)
- [Abstract, Section 3.1, Table 4] The headline claim that 'crypto portfolios constructed via optimizations that minimize variance and Conditional Value at Risk outperform a major stock market index' is contradicted by the authors' own empirical results. Section 3.1 states that 'the cumulative returns from the min Variance portfolio ... has relatively low cumulative returns than the benchmark (SPY) all the time in the estimation window,' and Figure 2 shows the min-variance portfolio below SPY for the entire window. Table 4 reports, for the min-variance portfolio, a Sharpe ratio of 0.0078 versus 0.0333 for SPY, a maximum drawdown of 0.7464 versus 0.1935, and a Rachev ratio of 1.0124 versus 1.0246; only the M2 ratio (0.0004 vs 0.0003) is slightly higher. Thus the advertised outperformance holds only for the min-CVaR portfolio, and only during part of 2019. The abstract and the conclusion in Section 5 must be revised to state the result accurately.
- [Section 2.2, Tables 2 and 4] The model is selected and evaluated on the same out-of-sample window. The backtesting in Table 2 uses data from 04/04/2018 to 07/02/2019 to choose the multivariate t innovation model, and Table 4 reports portfolio performance over exactly the same 455-day window. Consequently, the reported 'out-of-sample' Sharpe, M2, and Rachev ratios are not independent of the model choice; there is no hold-out period or cross-validation. This circularity weakens the claim that the model was 'carefully backtested' and that the portfolio horse race is out-of-sample.
- [Section 3.1, Figures 3 and 4] The portfolio comparison assumes no transaction costs, as stated in Section 3.1: 'we assume there are no transaction costs so that weights can be adjusted purely for hedging risk.' The weight plots in Figures 3 and 4 show large and frequent rebalancing, particularly for the min-CVaR portfolio. Given the wide bid-ask spreads observed in crypto markets, the reported performance advantage in Table 4 may vanish once realistic frictions are accounted for. The paper should report portfolio turnover and a cost-sensitivity analysis before claiming outperformance.
- [Section 4, Equations (26)-(29), Abstract] The option pricing claim is not supported by the evidence presented. The NIG parameters are estimated from the same 455 historical portfolio returns used to construct the portfolios, and the simulated prices in Equations (28)-(29) are not compared with any external market data because no such options are traded. The abstract's assertion that the model 'was carefully backtested' refers to the VaR/CVaR backtest of the return model in Section 2.2, not to option prices; the statement in Section 4 that future crypto options 'should follow closely our theoretical prices' is therefore an extrapolation without validation. At a minimum, the paper should report Monte Carlo standard errors, sensitivity to the NIG parameter estimates, and a clear caveat that the prices are untested predictions.
minor comments (5)
- [Figures 5 and 6] Both figures are captioned 'Option Prices based on the min CVaR portfolio,' but the text states that Figure 5 is based on the min Variance portfolio and Figure 6 on the min CVaR portfolio; the captions should be corrected.
- [Section 3.2] The notation is confusing: portfolio weights ωt(j) are introduced for the optimized portfolios, but the risk-budgeting analysis then redefines them as equal weights (1/d, ..., 1/d). The authors should clarify that the risk-contribution analysis in Figures 3 and 4 applies to the equally weighted portfolio, not to the optimized min-variance or min-CVaR portfolios.
- [Section 4, step 4(b)] Step 4(b) says 'Renew β as β + √σtθt,' while the Esscher condition in Equation (26) uses β + θ; the scaling with √σt should be explained or corrected, since it affects the risk-neutral innovation distribution.
- [Table 2] The table would benefit from a note specifying the confidence level, the definition of 'observations,' and the exact form of the binomial test used, since the traffic-light and binomial outcomes are central to model selection.
- [Section 3.1] The sentence 'The cumulative returns from the min Variance portfolio is very stable and has relatively low cumulative returns than the benchmark' contains a grammatical error and should read 'lower cumulative returns than the benchmark.'
Circularity Check
No significant circularity: the portfolio race is benchmarked externally against SPY, and the option prices are openly presented as unbacktested model outputs rather than as an independent empirical prediction.
full rationale
The paper's derivation chain is not circular. The portfolio claim is tested against SPY with dividends as an external benchmark in Section 3.1, and Table 4 reports Sharpe, M2, MDD, and Rachev ratios for the same out-of-sample window; whether the abstract overstates the evidence is an internal-consistency and correctness issue, not a circularity. The option-pricing section calibrates an ARMA(1,1)-GARCH(1,1) model with NIG innovations to the min-Variance and min-CVaR portfolio returns and then applies the Esscher transform following Chorro et al. (2012); the resulting prices are conditional expectations under a fitted pricing measure. The paper explicitly states, 'Because of the absence of traded crypto options we could not compare the prices obtained from our valuation model to market prices,' so it does not dress up fitted values as an out-of-sample empirical prediction. The self-citations that appear, such as Rachev et al. (2008) for the Rachev ratio, are references to standard definitions or prior modeling frameworks and are not load-bearing in the derivation: the min-CVaR conclusion is supported independently by Sharpe and M2 ratios. No equation is defined in terms of the quantity it is supposed to predict, and no fitted parameter is renamed as a prediction. The main legitimate concerns are overclaiming from a single short out-of-sample window, zero transaction costs, and model selection and evaluation on the same period; these are correctness risks, not circularity.
Assumptions & free parameters
free parameters (5)
- ARMA(1,1)-GARCH(1,1) coefficients per asset =
not reported
- Multivariate t degrees of freedom =
nu = 5
- NIG parameters for portfolio innovations =
not reported
- Portfolio weight bounds L and U =
not specified
- t-copula smoothing window ws =
tested 0, 0.8, 1.0
assumptions (5)
- domain assumption ARMA(1,1)-GARCH(1,1) with Gaussian innovations adequately captures each crypto asset's conditional mean and variance.
- domain assumption Multivariate t with five degrees of freedom is the correct joint distribution of standardized innovations.
- domain assumption No transaction costs and no liquidity constraints in daily rebalancing.
- standard math Esscher transform provides a unique equivalent martingale measure for the ARMA-GARCH-NIG model.
- domain assumption SPY returns on weekends and holidays are zero to align trading calendars.
Cite this review
Pith. "Pith review of Modelling Crypto Asset Price Dynamics, Optimal Crypto Portfolio, and Crypto Option Valuation." pith.science (2026). https://pith.science/paper/DWWTDTP4
@misc{pith2026190805419,
  author       = {Pith},
  title        = {Pith review of: Modelling Crypto Asset Price Dynamics, Optimal Crypto Portfolio, and Crypto Option Valuation},
  year         = {2026},
  howpublished = {\url{https://pith.science/paper/DWWTDTP4}},
  note         = {Machine review of arXiv:1908.05419}
}
abstract
Despite being described as a medium of exchange, cryptocurrencies do not have the typical attributes of a medium of exchange. Consequently, cryptocurrencies are more appropriately described as crypto assets. A common investment attribute shared by the more than 2,500 crypto assets is that they are highly volatile. An investor interested in reducing price volatility of a portfolio of crypto assets can do so by constructing an optimal portfolio through standard optimization techniques that minimize tail risk. Because crypto assets are not backed by any real assets, forming a hedge to reduce the risk contribution of a single crypto asset can only be done with another set of similar assets (i.e., a set of other crypto assets). A major finding of this paper is that crypto portfolios constructed via optimizations that minimize variance and Conditional Value at Risk outperform a major stock market index (the S$\&$P 500). As of this writing, options in which the underlying is a crypto asset index are not traded, one of the reasons being that the academic literature has not formulated an acceptable fair pricing model. We offer a fair valuation model for crypto asset options based on a dynamic pricing model for the underlying crypto assets. The model was carefully backtested and therefore offers a reliable model for the underlying crypto assets in the natural world. We then obtain the valuation of crypto options by passing the natural world to the equivalent martingale measure via the Esscher transform. Because of the absence of traded crypto options we could not compare the prices obtained from our valuation model to market prices. Yet, we can claim that if such options on crypto assets are introduced, they should follow closely our theoretical prices after adjusting for market frictions and design feature nuances.
Figures


Figures from the paper (3 more)


Forward citations
Cited by 1 Pith paper
-
Simple and Effective Portfolio Construction with Crypto Assets
A 90/10 traditional/crypto portfolio, diluted with cash to a target risk level, matched a full risk-allocation optimizer and beat an equities-only portfolio in a 2017-2024 backtest.
Reference graph
Works this paper leans on
-
[1]
Artzner, P., Delbaen, F., Eber, J., and Heath, D. (1999). Coheren t measures of risk. Mathematical Finance, 9:203–228
work page 1999
-
[2]
Balcilar, M., Bouri, E., Gupta, R., and Roubaud, D. (2017). Can volume predict Bitcoin returns and volatility? A quantiles-based approach. Economic Modelling , 64:74–81. Barndorff-Nielsen, O. (1977). Exponentially decreasing distributio ns for the logarithm of particle size. Scandinavian Journal of Statistics , 353(1674):401–419
work page 2017
-
[3]
Bollerslev, T. (1986). Generalized autoregressive conditional het eroskedasticity. Journal of Econometrics , 31(3):307–327
work page 1986
-
[4]
Borak, S., H¨ ardle, W. K., and Weron, R. (2005). Stable distribution s. SFB 649 Discus- sion Paper
work page 2005
-
[5]
Bruder, B. and Roncalli, T. (2012). Managing risk exposures using t he risk budgeting approach. Available at SSRN 2009778
work page 2012
- [6]
-
[7]
Chan, S., Chu, J., Nadarajah, S., and Osterrieder, J. (2017). A st atistical analysis of cryptocurrencies. Journal of Risk and Financial Management , 10(2):12
work page 2017
-
[8]
Chorro, C., Gu´ egan, D., and Ielpo, F. (2012). Option pricing for GA RCH-type models with generalized hyperbolic innovations. Quantitative Finance , 12(7):1079–1094
work page 2012
Show all 26 references
-
[9]
Chu, J., Chan, S., Nadarajah, S., and Osterrieder, J. (2017). GAR CH modelling of cryptocurrencies. Journal of Risk and Financial Management , 10(4):17. 23
2017
-
[10]
and McNeil, A
Demarta, S. and McNeil, A. J. (2005). The t copula and related copu las. International Statistical Review, 73:111–129. Duffie, D. (2001). Dynamic Asset Pricing Theory: 3 Ed . Princeton, NJ: Princeton University Press
2005
-
[11]
Gerber, H. U. and Shiu, E. S. W. (1994). Option pricing by Esscher t ransforms. Trans- actions of the Society of Actuaries , 46:99–191
1994
-
[12]
and Mercuri, L
Hitaj, A. and Mercuri, L. (2013). Portfolio allocation using multivaria te variance gamma models. Financial Markets and Portfolio Management , 27(1):65–99
2013
-
[13]
Hull, J. C. (2012). Options, Futures, and Other Derivatives: 8 Ed . Englewood, NJ: Pearson
2012
-
[14]
R., Platen, E., and Rachev, S
Hurst, S. R., Platen, E., and Rachev, S. T. (1999). Option pricing fo r a logstable asset price model. Mathematical and Computer Modelling , 29(10-12):105–119
1999
-
[15]
Krokhmal, P., Palmquist, J., and Uryasev, S. (2002). Portfolio optim ization with con- ditional value-at-risk objective and constraints. Journal of Risk , 4(2):11–27
2002
-
[16]
Markowitz, H. (1952). Portfolio selection. Journal of Finance , 7(1):77–91
1952
-
[17]
and Athey, S
Mitchnick, R. and Athey, S. (2018). A fundamental valuation fram ework for cryp- toassets. https://s3-us-west-1.amazonaws.com/fundamental-valuation-framework-for- cryptoassets/A+Fundamental+Valuation+Framework+for+Cryptoassets June+2018.pdf
2018
-
[18]
and Modigliani, L
Modigliani, F. and Modigliani, L. (1997). Risk-adjusted performance . Journal of Port- folio Management , 23(2):45–54
1997
-
[19]
T., Stoyanov, S
Rachev, S. T., Stoyanov, S. V., and Fabozzi, F. J. (2008). Advanced Stochastic Models, Risk Assessment, and Portfolio Optimization . Hoboken, NJ: John Wiley & Sons. 24
2008
-
[20]
Sharpe, W. F. (1994). The Sharpe ratio. Journal of Portfolio Management , 21(1):49–58
1994
-
[21]
V., Rachev, S
Stoyanov, S. V., Rachev, S. T., and Fabozzi, F. J. (2007). Optimal financial portfolios. Applied Mathematical Finance , 14(5):401–436
2007
-
[22]
Thakor, A. V. (2019). Fintech and banking. Available at SSRN 3332550
2019
-
[23]
Tsay, R. S. (2010). Analysis of Financial Time Series . Hoboken, NJ: John Wiley & Sons
2010
-
[24]
Wang, J. (2009). The multivariate variance gamma process and its a pplications in multi-asset option pricing, Doctoral dissertation, University of Ma ryland
2009
-
[25]
Whittle, P. (1951). Hypothesis Testing in Time Series Analysis . Uppsala, Sweden:
1951
-
[26]
Wilmott, P. (2006). Paul Wilmott On Quantitative Finance: 2 Ed . Hoboken, NJ: John Wiley & Sons. 25
2006
Reviewed August 14, 2026 · model on record in the stance chip above.
Discussion (0). Continue with ORCID to comment.