REVIEW 3 major objections 5 minor 73 references
Discarding the disc in a changing state AGN: the UV/X-ray relation in NGC 4151
T0 review · 3 major / 5 minor · reviewed 2026-08-14 · deepseek-v4-flash
Pith's one-line read The paper claims that the ultraviolet light of NGC 4151 is produced by X-ray reprocessing in broad-line-region gas, not by an inner accretion disc, which had vanished into a hot flow.
desk verdict A strong negative result on inner-disc reprocessing in NGC 4151, with a plausible but undertested BLR-scale interpretation. read the letter →
The pith
A machine-rendered reading of the paper's core claim, the machinery that carries it, and where it could break.
The reading
What carries the argument
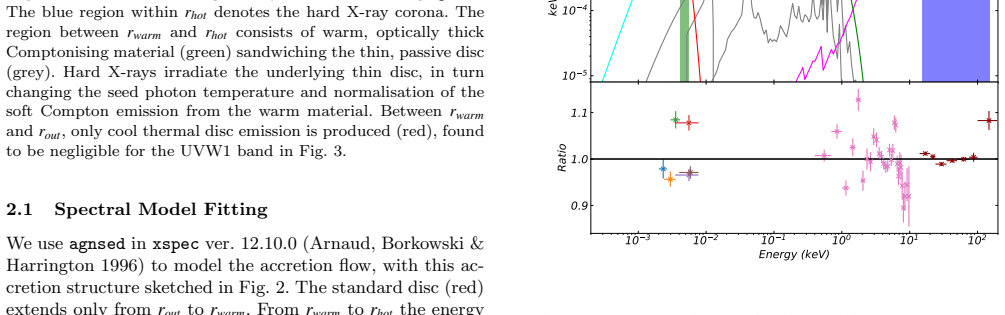
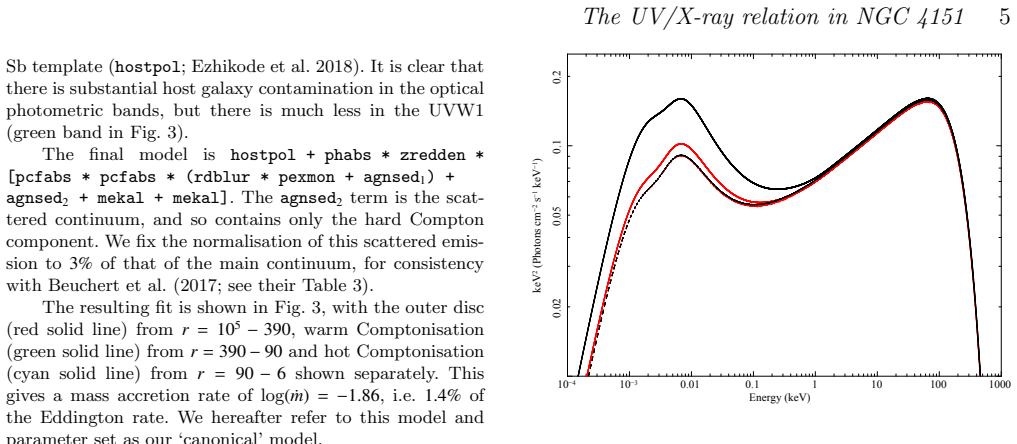
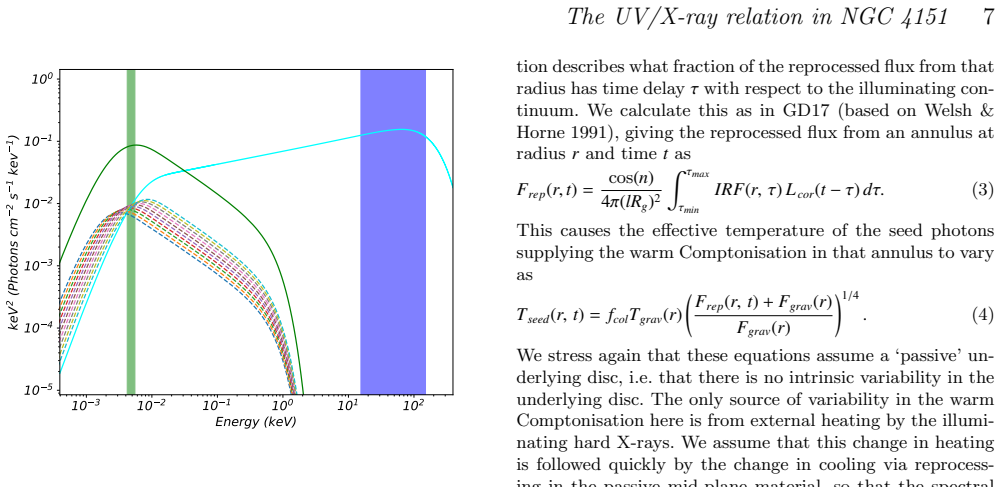
The central machinery is the agnsed spectral-timing model: it assumes Novikov-Thorne gravitational dissipation at each radius, but thermalises it to a blackbody only outside the warm-Compton radius, releases it in a warm Comptonising layer at intermediate radii, and puts the innermost radii into a hot corona, so the UV in the canonical fit originates at 90-390 $R_g$. The companion tool is an impulse-response decomposition in which the UVW1 light curve is a constant, plus a slow component formed by convolving the BAT light curve with a free impulse-response function, plus a small fast component. A double-Gaussian and then an exponentially modified double-Gaussian impulse response localise the slow component to 1.5-20 light-days, and the light-travel-time argument against any alternative at less than 1.5 light-days is what rules out the disc.
What would settle it
Higher-cadence, simultaneous monitoring with a hard-X-ray instrument covering above 50 keV would settle the picture: if the UVW1 versus greater-than-50 keV cross-correlation shows a peak at lags below 1.5 days, the claimed absence of inner optically thick material is wrong. A high signal-to-noise X-ray spectrum showing a relativistically broadened iron line from within roughly 1.5 light-days would also directly contradict the truncated-flow geometry.
Extended reading notes
Core claim
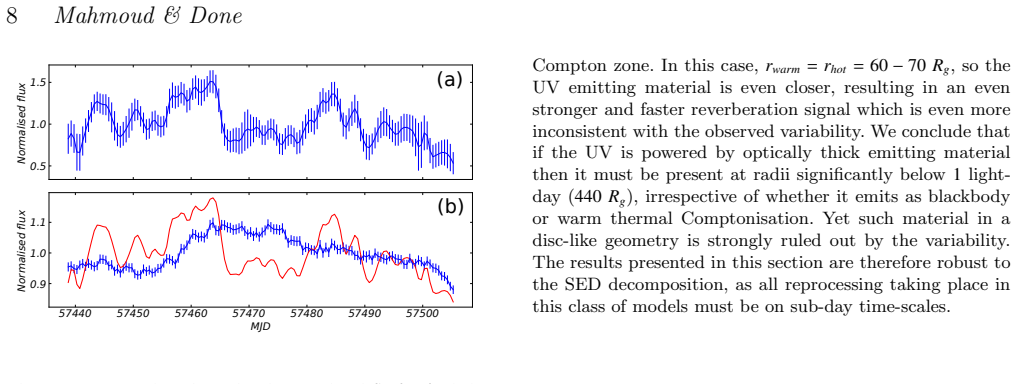
The central discovery is that the near-ultraviolet (UVW1) light curve of NGC 4151 cannot be powered by optically thick accretion-disc material inside roughly 1.5 light-days, and can instead be powered by X-ray reprocessing in broad-line-region gas. The canonical spectral fit places the UV source in a warm Comptonising region spanning 90-390 gravitational radii from the black hole, but when the Swift BAT hard X-ray light curve is convolved through the light-travel-time impulse response of that geometry, the predicted UV variability has far too much power on sub-day timescales and too high a correlation with the X-rays. Replacing the physical model with a free impulse-response function gives a good fit with 90 percent of the UV flux responding on lags of 1.5-20 days, matching known BLR size scales, and only 5-10 percent responding fast. The paper's conclusion is that the inner disc was absent during this epoch, replaced by an optically thin hot flow, and that the UV continuum is dominated by diffuse emission from dense BLR gas, with the inferred luminosity of 1.4 percent Eddington placing the source in the changing-state regime.
Load-bearing premise
The argument assumes the Swift BAT 15-50 keV light curve tracks the true bolometric X-ray luminosity that drives reprocessing; if the flux above 50 keV varied independently, both the failure of the disc model and the recovered 1.5-20 day response would be artifacts.
Editorial extensions
If this is right
- The standard irradiated-disc plus warm-Compton geometry cannot produce the observed UVW1 light curve of NGC 4151, even when the soft-excess region is removed or the corona is made vertically extended.
- A linear impulse response with delays of 1.5-20 days reproduces the UVW1 light curve, meaning the slow UV variability is consistent with reprocessing by dense gas in the broad line region.
- Only about 5-10 percent of the UVW1 flux can be fast-correlated with the hard X-rays, leaving no room for a significant disc or warm-Compton contribution inside roughly 1.5 light-days.
- The inner accretion flow in NGC 4151 at this epoch is inferred to be radiatively inefficient, consistent with its low Eddington fraction and with the absence of a relativistically broadened iron line.
Reading between the lines
- A direct test of the paper's logic: monitor a sample of AGN across the Eddington-fraction range 0.01-0.03 with simultaneous UV and greater-than-10 keV X-ray coverage and check whether fast (less than 1 day) UV response appears as the Eddington fraction rises, as expected if the thin disc reforms.
- If BLR diffuse continuum dominates the UV, the recovered impulse response should correlate with the known He II, H beta and H alpha lags of roughly 2-3, 6 and 11 days; a longer campaign could measure the UV lag structure and test this.
- The same analysis applied to other low-state AGN, including a re-analysis of NGC 5548 with a 15-50 keV driver, could show whether a truncated flow plus BLR reprocessing is generic rather than unique to NGC 4151.
Signed reviews
Editorial analysis
A structured set of objections, weighed in public.
Referee Report
Summary. This paper applies the Gardner & Done (2017) spectral-timing method to the 2016 Swift monitoring campaign of NGC 4151, using the BAT 15-50 keV light curve as the driving X-ray signal. The authors fit a truncated disc plus warm Comptonization model (agnsed) to the mean SED, inferring L/L_Edd ~ 1.4%. They then predict the UVW1 light curve from the observed BAT light curve and demonstrate that the predicted curve has far more fast variability and a shorter cross-correlation lag than the observed UVW1 curve. They next fit phenomenological linear transfer functions to the UVW1/BAT data, finding that a slowly responding component on 1.5-20 light-day timescales plus a small fast fraction describes the light curve well, and they interpret this as reprocessing by dense gas in the broad-line region. The paper concludes that optically thick material in a disc geometry is ruled out within 1.5 light days, supporting a changing-state picture in which the inner disc is replaced by a radiatively inefficient flow.
Significance. If the conclusions hold, the paper provides a strong observational constraint on accretion geometry in low-luminosity AGN: it would be the first to use a hard X-ray (BAT) driver to test disc reprocessing predictions, and it would support both the truncation of the thin disc at low Eddington ratios and the domination of the UV by diffuse BLR continuum. The manuscript is commendable for making an explicit, falsifiable prediction, for using a band less affected by absorption than the XRT, and for demonstrating robustness of the variability prediction to alternative SED decompositions in Appendix A. It also offers an energetic plausibility check for BLR reprocessing. However, the central claim rests on the unvalidated assumption that the 15-50 keV BAT band tracks the bolometric X-ray driver, and the recovered IRF parameters are presented without statistical uncertainties; both issues need to be addressed before the conclusions can be accepted at face value.
major comments (3)
- [Section 3, Eq. (3) and Fig. 8] The central claim that the disc/warm-Compton reprocessing model is ruled out for radii < 1.5 light days assumes that the Swift BAT 15-50 keV light curve faithfully tracks the bolometric X-ray luminosity that drives the UV reprocessing. The paper argues that BAT is preferable to XRT because the latter is affected by variable absorption, but it does not provide any direct validation that the 15-50 keV band traces the harder X-rays where the bolometric luminosity peaks. If the flux above 50 keV has different variability amplitude or power spectrum, the predicted UVW1 light curve would change and the disc model could be reconciled with the data. The authors should either support this proxy assumption with auxiliary data (e.g., simultaneous INTEGRAL/NuSTAR coverage or a coherence analysis between BAT and XRT after correcting for absorption) or explicitly restate the rule-out as conditional on this assumption. This is load-bearing for the abstract's headline conclusion.
- [Section 4, Eq. (5) and Fig. 10] The positive result - that the UVW1 is predominantly reprocessed on BLR scales of 1.5-20 light days - is obtained by fitting the UVW1 light curve with the BAT light curve as the input driver. A systematic error in the driver (for instance, if the true bolometric flux is less variable on short timescales than the 15-50 keV band) would propagate directly into the recovered IRF timescales and the inferred fast fraction. The paper does not test how the recovered IRF changes for plausible alternative drivers, so the BLR-scale conclusion is not uniquely determined. The authors should include a sensitivity analysis (e.g., a driver with a different power spectrum or with spectral-index-dependent variability) or qualify the interpretation accordingly.
- [Section 4, parameter uncertainties] The IRF fits are presented without confidence intervals on the parameters fc, fs, centroids, variances, and derived size scales. The only uncertainty discussed is the systematic difference between the double-Gaussian and exponentially-modified-Gaussian forms. Since the 1.5 light-day lower limit and the 90% slow fraction are quantitative claims, a bootstrap or Monte Carlo error estimate on the recovered IRF parameters and the implied length scales is needed to support them.
minor comments (5)
- [Eq. (6)] In the second term of the exponentially modified Gaussian IRF, the argument of the complementary error function uses lambda_1 sigma_2^2 where it should use lambda_2 sigma_2^2; as written the formula is internally inconsistent.
- [References] The reference entries for Edelson et al. (2015) and Edelson et al. (2017) are missing the publication years, and the entry for Welsh and Horne is listed as 2016 instead of 1991.
- [Section 3, first paragraph] The phrase 'to produce give an even sampling' contains a typo; it should read 'to produce an even sampling.'
- [Fig. 5 caption] The caption reads 'which is more consisted with the Bentz-corrected data'; this should be 'more consistent with.'
- [Section 3.1] The significance of the BAT-UVW1 correlation is not quoted for the UVW1 band itself; the text cites E17's value for UVW2. The authors should report the significance for the specific band used in the analysis.
Circularity Check
No significant circularity: the Section 3 UV variability prediction is genuinely out-of-sample, and the Section 4 IRF recovery is an explicitly fitted interpretation rather than a disguised input.
full rationale
The paper's central predictive step is not circular. Section 2 fits agnsed to the time-averaged SED only; the free parameters (rhot, rwarm, mdot) are determined from the mean spectrum, not from the UV variability. Section 3 then feeds the observed Swift BAT 15-50 keV light curve through equations (3)-(4) to predict the UVW1 light curve, and the predicted curve is compared to data without any UV-variability fitting. The failure of this prediction (excess fast variability, too-short lag) is a genuine, externally falsifiable result. Section 4 is an explicit fit rather than a prediction: equation (5) parameterizes fc, fs and an IRF and fits them to the UVW1 data; the recovered 1.5-20 day timescale is then compared to independent BLR size measurements (H-beta ~6 light-days, HeII 2-3 light-days), not assumed from them. The consistency of the fast fraction with the 9% direct coronal contribution is an output check, not an input constraint. Self-citations to GD17 and KD18 supply the spectral-timing machinery and the agnsed model, but the load-bearing conclusions do not reduce to those citations: the model's failure and the IRF-fit timescales are determined by the 2016 campaign data. The main weakness, that the 15-50 keV BAT band may not track the bolometric driver, is an external-validity assumption, not a circularity; it does not make the derivation equivalent to its inputs. One minor self-citation (GD17) is present but non-load-bearing, hence score 1.
Assumptions & free parameters
free parameters (6)
- Mass accretion rate (mdot) =
log mdot = -1.86 (1.4% L_Edd)
- rhot (inner hot flow radius) =
90 R_g
- rwarm (outer warm Compton radius) =
390 R_g
- Gamma_hot (hot corona photon index) =
Not stated explicitly (free in fit)
- Host galaxy 5100 angstrom flux (two alternatives) =
1.1e-14 (Shapovalova) or 1.7e-14 (Bentz) erg/s/cm2/A
- IRF parameters (fc, fs, Gaussian centroids/variances, K2, lambda1, lambda2) =
fc < 0.05, fs ~ 0.9; centroids/widths shown in Figs. 9-10, numerical values not tabulated
assumptions (5)
- domain assumption The accretion flow follows the Novikov-Thorne emissivity, with energy released in the disc and warm Compton layers, as implemented in agnsed (KD18).
- domain assumption The warm Comptonisation region is a slab with Gamma_warm = 2.7 set by energy balance (Petrucci et al. 2018).
- ad hoc to paper The reprocessor is a flat, optically thick disc annulus with no vertical structure, and the corona is a point-like source at height hcor = 10 R_g.
- domain assumption The 15-50 keV BAT lightcurve tracks the bolometric driving luminosity.
- ad hoc to paper The UVW1 flux is a linear, time-invariant combination of a constant, a slow BLR response, and a fast direct/reprocessed component (Equation 5).
Cite this review
Pith. "Pith review of Discarding the disc in a changing state AGN: the UV/X-ray relation in NGC 4151." pith.science (2026). https://pith.science/paper/T46SHA4M
@misc{pith2026190805461,
  author       = {Pith},
  title        = {Pith review of: Discarding the disc in a changing state AGN: the UV/X-ray relation in NGC 4151},
  year         = {2026},
  howpublished = {\url{https://pith.science/paper/T46SHA4M}},
  note         = {Machine review of arXiv:1908.05461}
}
abstract
Recent monitoring campaigns designed to map the accretion regime in AGN show major discrepancies with models where the optical/ultraviolet (UV) is produced by X-ray-illuminated, optically thick disc material within a few hundred gravitational radii. However, these campaigns only monitored X-rays below $10$ keV, whereas the bolometric luminosity for most of these AGN peaks above $50$ keV. We use data from the recent multiwavelength campaign by \cite{E17} on NGC 4151 - the only AGN bright enough to be monitored at higher energies with \textit{Swift} BAT. We develop a spectral-timing model with a hot corona, warm Comptonisation, and outer standard disc. This fits the time-averaged spectrum well, but completely fails to match the UV variability predicted from the X-ray lightcurve. However, it reveals that NGC 4151 had a bolometric luminosity around $1.4\%$ of the Eddington luminosity during this campaign, close to the luminosity at which AGN show a `changing-state' transition, where the broad optical lines disappear. Stellar mass black holes show a state transition at a similarly low Eddington fraction, which is broadly interpreted as the inner disc being replaced by an optically thin flow. We find that the UV lightcurve can instead be matched by reprocessing of the X-ray flux on size scales of the broad line region (BLR; $1.5-20$ light-days) and rule out there being optically thick material inwards of this, as expected if the thin disc is replaced by the flow below the inner radius of the BLR. These results emphasise the need for even longer-timescale, multiwavelength monitoring campaigns on variable AGN.
Figures


Figures from the paper (8 more)



Reference graph
Works this paper leans on
-
[1]
Almeyda T., Robinson A.,Richmond M., Vazquez B., Nikutta R., 2017, ApJ, 841, 1
work page 2017
- [2]
-
[3]
Ar\' e valo P., Uttley P., Lira P., Breedt E., McHardy I.M., Churazov E., 2009, MNRAS, 397, 2004
work page 2009
-
[4]
Arnaud K., Borkowski K.J., Harrington J.P., 1996, ApJ, 462, L75
work page 1996
-
[5]
Arnaud M., Raymond J., 1992, ApJ, 398, 394
work page 1992
-
[6]
Baron D., Stern J., Poznanski D., Netzer H., 2016, ApJ, 832 (1), 8
work page 2016
-
[7]
Barvainis R., 1987, ApJ, 320, 537
work page 1987
-
[8]
Beuchert T., Markowitz A.G., Dauser T. et al., 2017, A&A, 603, A50
work page 2017
Show all 73 references
-
[9]
et al., 2006, ApJ, 651, 775
Bentz M.C., Denney K.D., Cackett E.M. et al., 2006, ApJ, 651, 775
2006
-
[10]
et al., 2013, ApJ, 767 (2), 149
Bentz M.C., Denney K.D.,Grier C.J. et al., 2013, ApJ, 767 (2), 149
2013
-
[11]
& Paltani S., 2016, A&A, 588, A70
Boissay R., Ricci C. & Paltani S., 2016, A&A, 588, A70
2016
-
[12]
et al., 2018, MNRAS, 475 (2), 2306
Buisson D.J.K., Lohfink A.M., Alston W.N. et al., 2018, MNRAS, 475 (2), 2306
2018
-
[13]
Chelouche D., Nu\ n ez F.P., Kaspi, S., 2018, Nat. Astron
2018
-
[14]
Davis S.W., Woo J.-H., Blaes O.M, 2007, ApJ, 668 (2), 682
2007
-
[15]
et al., 2018, ApJ, 866, 133
De Rosa G., Fausnaugh M.M., Grier C.J. et al., 2018, ApJ, 866, 133
2018
-
[16]
et al., 2019, ApJ, 877 (2), 119
Dehghanian M., Ferland G.J., Kriss G.A. et al., 2019, ApJ, 877 (2), 119
2019
-
[17]
et al., 2019, ApJL, 882, 2
Dehghanian M., Ferland G.J., Peterson B.M. et al., 2019, ApJL, 882, 2
2019
-
[18]
Done C., Gierli\' n ski M., Kubota A., 2007, A&ARv, 15, 1
2007
-
[19]
Done C., Davis S.W., Jin C., Blaes O., Ward M., 2012, MNRAS, 420, 1848
2012
-
[20]
et al., ApJ, 806, 129
Edelson R., Gelbord K., Horne K. et al., ApJ, 806, 129
-
[21]
et al., ApJ, 840, 41 (E17)
Edelson R., Gelbord K., Cackett E. et al., ApJ, 840, 41 (E17)
-
[22]
et al., 2018, MNRAS, 472 (3), 3492
Ezhikode S.H., Gandhi P., Done C. et al., 2018, MNRAS, 472 (3), 3492
2018
-
[23]
Fabian A.C., Rees M.J., Stella L., White N.E., 1989, MNRAS, 238, 729
1989
-
[24]
Frank J., King A., Raine D., 2002, Accretion Power in Astrophysics: Third Edition, Cambridge University Press, pp. 83-84
2002
-
[25]
Galeev A., Rosner R., Vaiana G., 1979, ApJ, 229, 318
1979
-
[26]
et al., 2019, ApJ, 871, 88
Garc \' a J.A., Kara E., Walton D. et al., 2019, ApJ, 871, 88
2019
-
[27]
Gardner E., Done C., 2017, MNRAS, 470, 3591 (GD17)
2017
-
[28]
Gierli \'n ski M., Done C., 2004, MNRAS, 349, L7
2004
-
[29]
Haardt F., Maraschi L., 1993, ApJ, 413, 507
1993
-
[30]
Inoue Y., Doi A., 2018, ApJ, 869 (2), 114
2018
-
[31]
Jin C., Ward M., Done C., Gelbord J., 2012, MNRAS 420, 1825
2012
-
[32]
et al., 2000, ApJ, 528, 260
Kaiser M.E., Bradley L.D., Hutchings J.B. et al., 2000, ApJ, 528, 260
2000
-
[33]
et al., 2015, ApJ, 806, 149
Keck M.L., Brenneman L.W., Ballantyne D.R. et al., 2015, ApJ, 806, 149
2015
-
[34]
et al., ApJ Letts., 2013, 775 (2), L36
Kishimoto M., H\" o nig S.F., Antonucci R. et al., ApJ Letts., 2013, 775 (2), L36
2013
-
[35]
Korista K.T., Goad M.R., 2001, ApJ, 553, 695
2001
-
[36]
(KD18) Kubota A., Done C., 2018, MNRAS, 480, 1247
2018
-
[37]
Laor A., Davis S.W., 2014, MNRAS, 438 (4), 3042
2014
-
[38]
Lawrence A., 2018, Nature Astronomy, 2, 102-103
2018
-
[39]
Lawther D., Goad M.R., Korista K.T., Ulrich O., Vestergaard M., 2018, MNRAS, 481 (1), 533
2018
-
[40]
Lubi\' n ski P., Zdziarski A.A., Walter R., Paltani S., Beckmann V., Soldi S., Ferrigno C., Courvoisier T.J.-L., 2010, MNRAS, 408 (3), 1851
2010
-
[41]
Magdziarz P., Blaes O.M., Zdziarski A.A., Johnson W.N., Smith D.A., 1998, MNRAS, 301, 179
1998
-
[42]
et al., 2014, MNRAS, 439, 3016
Matt G., Marinucci A., Guainazzi M. et al., 2014, MNRAS, 439, 3016
2014
-
[43]
et al., 2011, A&A, 534, A39
Mehdipour M., Branduardi-Raymont G., Kaastra J.S. et al., 2011, A&A, 534, A39
2011
-
[44]
et al., 2015, A&A, 575, A22
Mehdipour M., Kaastra J.S., Kriss G.A. et al., 2015, A&A, 575, A22
2015
-
[45]
et al., 2016, A&A, 588, A139
Mehdipour M., Kaastra J.S., Kriss G.A. et al., 2016, A&A, 588, A139
2016
-
[46]
Mewe R., Gronenschild E.H.B.M., van den Oord, G.H.J., 1985, A&A Suppl., 62, 197
1985
-
[47]
et al., 2017, ApJ, 865 (2), 97
Miller J.M., Cackett E., Zoghbi A. et al., 2017, ApJ, 865 (2), 97
2017
-
[48]
Nandra K., O'Neill P.M., George I.M., Reeves J.N., 2007, MNRAS, 382, 194
2007
-
[49]
Noda H., Done C., 2018, MNRAS, 480, 3898
2018
-
[50]
Novikov I.D., Thorne K.S., 1973, blho.conf, 343
1973
-
[51]
Oknyansky V.L., Metlova N.V., Taranova O.G., Shenavrin V.I., Artamonov B.P., Gaskell C.M., Guo Di-Fu, 2014, Odessa Astronomical Publications, 27, 47
2014
-
[52]
et al., 2017, ApJ, 837, 131
Pei L., Fausnaugh M.M., Barth A.J. et al., 2017, ApJ, 837, 131
2017
-
[53]
Penston M.V., Perez E., 1984, MNRAS, 211, 33
1984
-
[54]
et al., 2013, A&A, 549, A73
Petrucci P.-O., Paltani S., Malzac J. et al., 2013, A&A, 549, A73
2013
-
[55]
Petrucci P.O., Ursini F., De Rosa A., Bianchi S., Cappi M., Matt G., Dadina M., Malzac J., 2018, A&A, 611, A59
2018
-
[56]
Peterson B.M., Cota S.A., 1988, ApJ, 330, 111
1988
-
[57]
Peterson B.M., Horne K., 2004, Astronomische Nachrichten, 325, 248
2004
-
[58]
Porquet D., Reeves J.N., O'Brien P., Brinkmann W., 2004, A&A, 422, 85
2004
-
[59]
et al., 2018, A&A, 609, A42
Porquet D., Reeves J.N., Matt G. et al., 2018, A&A, 609, A42
2018
-
[60]
et al., 2003, ApJ, 126 (3), 1131
Richards G.T., Hall P.B., Vanden Berk D.E. et al., 2003, ApJ, 126 (3), 1131
2003
-
[61]
et al., 2019, submitted, arXiv:1903.02553
Ruan J.J., Anderson S.F., Eracleous M. et al., 2019, submitted, arXiv:1903.02553
2019 arXiv
-
[62]
Shakura N.I., Sunyaev R.A., 1973, A&A, 24, 337
1973
-
[63]
et al., 2008, A&A, 486, 99
Shapovalova A.I., Popovi \'c L.C., Collin S. et al., 2008, A&A, 486, 99
2008
-
[64]
Shu X.W., Yaqoob T., Wang J.X., 2010, ApJ Suppl., 187, 581
2010
-
[65]
Shull M.J., Stevans M., Danforth C.W., 2012, ApJ, 752 (2), 162
2012
-
[66]
Telfer R.C., Zheng W., Kriss G.A., Davidsen A.F., 2002, ApJ, 565 (2), 772
2002
-
[67]
et al., 1984, MNRAS, 206 221
Ulrich M.H., Boksenber A., Bromage G.E. et al., 1984, MNRAS, 206 221
1984
-
[68]
Veledina A., 2016, ApJ, 832, 181
2016
-
[69]
Welsh W.F., Horne K., 2016, ApJ, 379, 586
2016
-
[70]
& Narayan R., 2003, ApJ, 598 (1), 301
Yuan F., Quataert E. & Narayan R., 2003, ApJ, 598 (1), 301
2003
-
[71]
Zheng W., Kriss G.A., Telfer R.C, Grimes J.P., Davidsen A.F., 1997, ApJ, 475 (2), 469
1997
-
[72]
Zoghbi A., Miller J., Cackett E., 2019, ApJ, 884, 26
2019
-
[73]
Zy \.c ki P.T., Done C., Smith D.A., 1999, MNRAS, 305, 231
1999
Reviewed August 14, 2026 · model on record in the stance chip above.
Discussion (0). Continue with ORCID to comment.